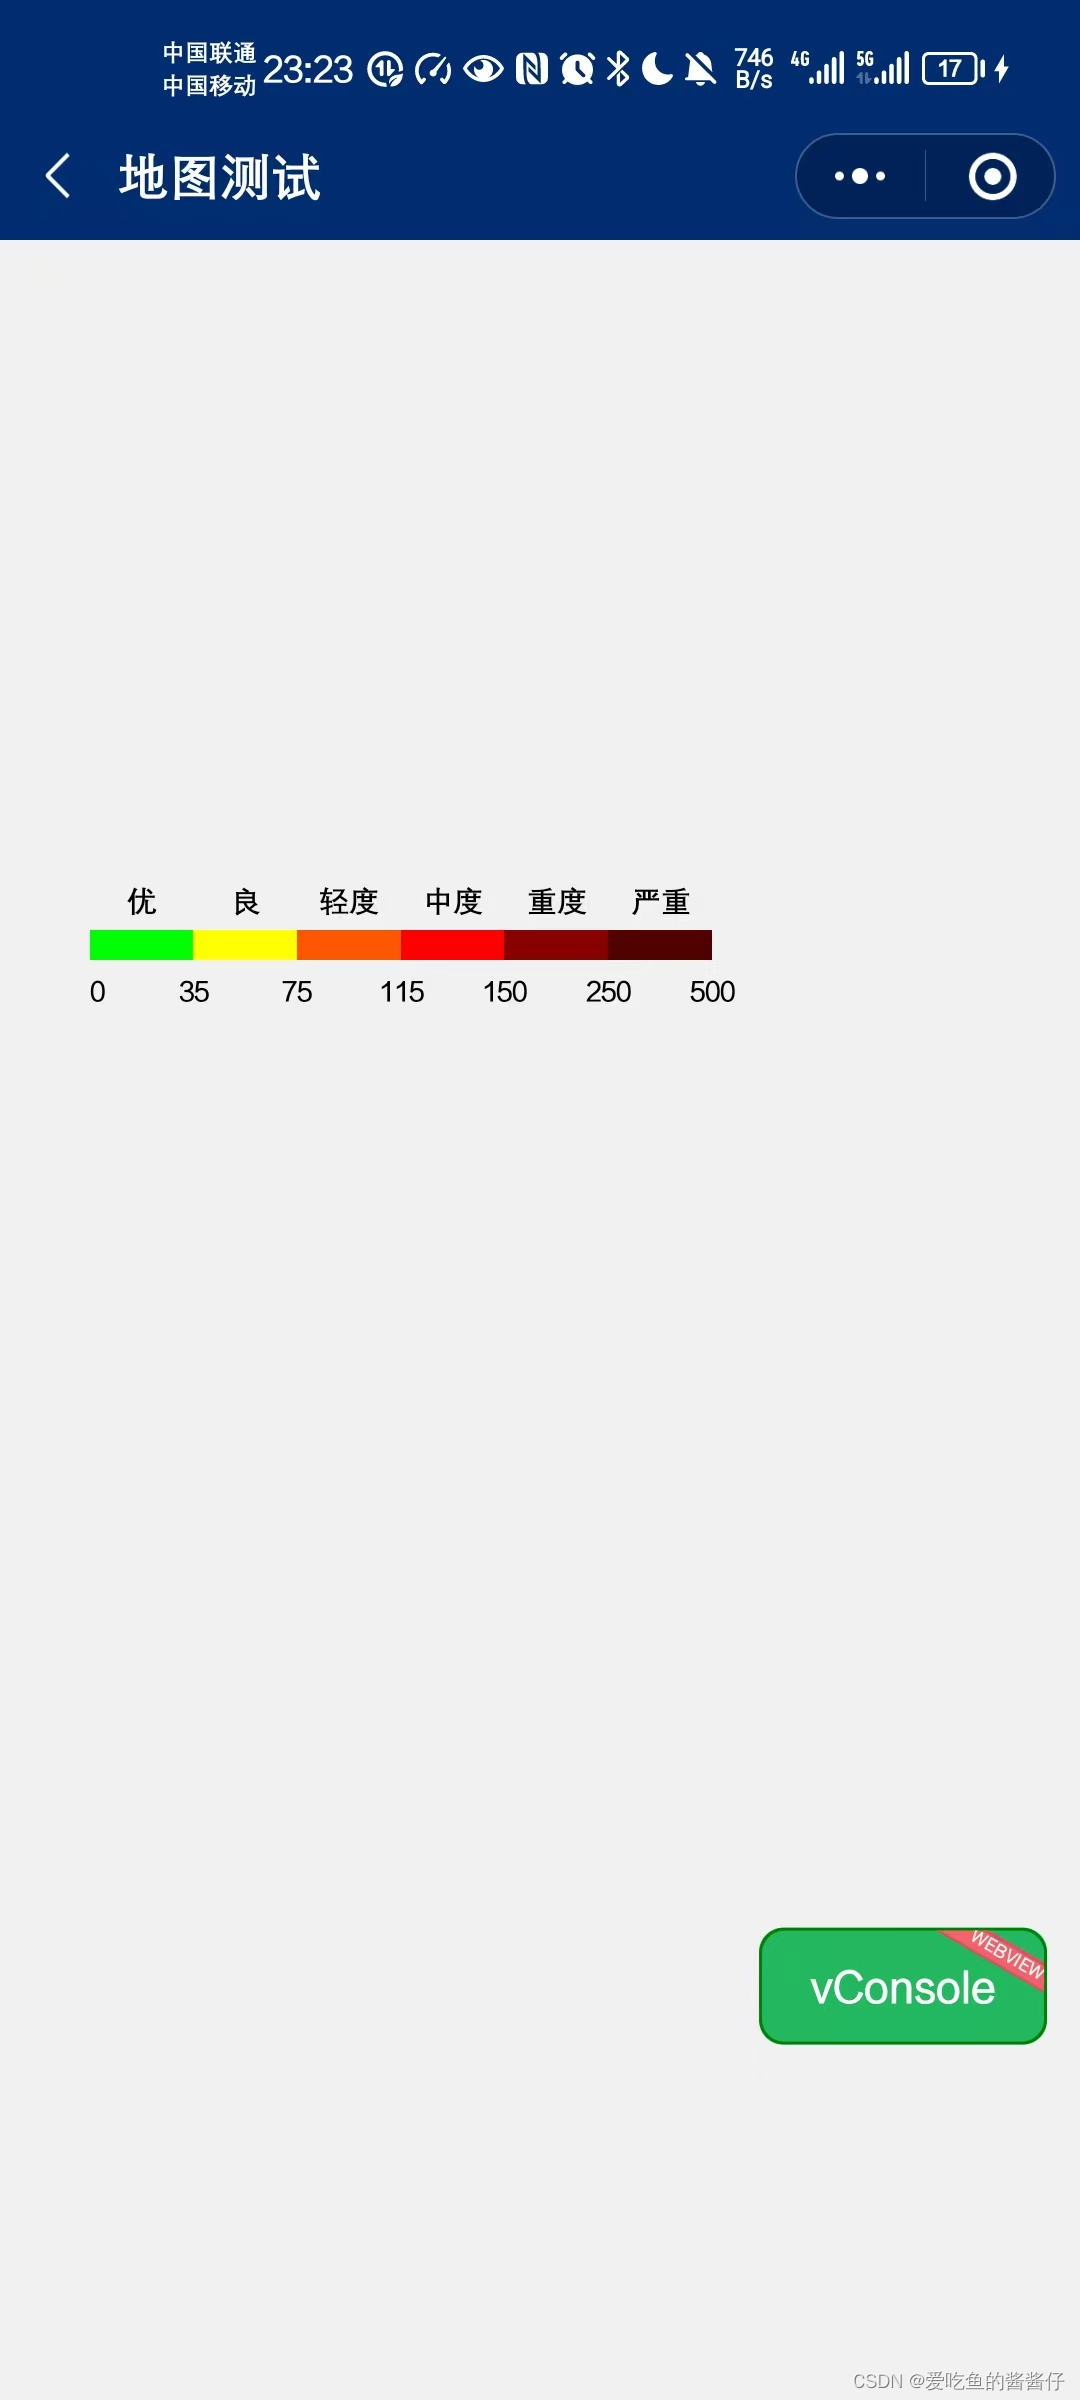
效果图如下:

思路:
1.首先我想到的就是使用图标库echarts或ucharts,可是找了找没有找到类似的。
2.其次我就想用画布来实现这个效果,直接上手。(app-vue和小程序均可以实现,但是在app-nvue页面不支持画布,尝试了一下再nvue页面直接导致程序闪退)
3.后来,使用手动创建一个竖向的类似效果。
注意:
1.app-nvue页面不支持画布效果,官方说引入插件支持,但直接导致闪退。
2.map很多参数app端仅支持app-nvue页面。
方法一 使用画布进行绘制(不支持app-nvue)
<template>
	<view class="container">
		<canvas :canvas-id="canvasId" style="width: 300px; height: 300px;"></canvas>
	</view>
</template>

<script>
	export default {
		data() {
			return {
				canvasId: "canvas",
				pollutionLevels: [{
						level: "优",
						color: "#00FF00",
						percent: 0.133,
						mark: "35"
					},
					{
						level: "良",
						color: "#FFFF00",
						percent: 0.133,
						mark: "75"
					},
					{
						level: "轻度",
						color: "#ff5500",
						percent: 0.133,
						mark: "115"
					},
					{
						level: "中度",
						color: "#FF0000",
						percent: 0.133,
						mark: "150"
					},
					{
						level: "重度",
						color: "#860000",
						percent: 0.133,
						mark: "250"
					},
					{
						level: "严重",
						color: "#510000",
						percent: 0.133,
						mark: "500"
					}
				]
			};
		},
		mounted() {
			this.drawChart();
		},
		methods: {
			drawChart() {
				const ctx = uni.createCanvasContext(this.canvasId, this);
				const startX = 0; // 图表起始位置X坐标
				const startY = 20; // 图表起始位置Y坐标
				const chartWidth = 260; // 图表宽度
				const chartHeight = 10; // 图表高度
				const textHeight = 20; // 标题高度
				const markfontSize = 10; //标点信息字体大小
				const fideWeight = 10 //减去范围坐标点的宽度
				const fideHeight = 44 //加上范围坐标点的高度
				const tdPaddingHeight = 4 //垂直距离高度
				let x = startX;
				const y = startY;
				let nextX = 0; // 下一个起始位置的x坐标

				function drawColorBlock(color, width, height) {
					ctx.setFillStyle(color);
					ctx.fillRect(x, y, width, height);
				}

				function drawText(text, width) {
					ctx.setFontSize(markfontSize);
					ctx.setFillStyle("#000000");
					const textWidth = ctx.measureText(text).width; // 计算文字宽度
					const textX = x + (width - textWidth) / 2; // 水平居中对齐
					ctx.fillText(text, textX, y - chartHeight + tdPaddingHeight); //在图表的上方
				}

				function drawMarkText(text) {
					ctx.setFontSize(markfontSize);
					ctx.setFillStyle("#000000");
					const textWidth = ctx.measureText(text).width; // 计算文字宽度
					const textX = startX + nextX - fideWeight - textWidth / 2; // 水平居中对齐
					if (text === "0") {
						ctx.fillText("0", startX, y - textHeight + fideHeight);
					} else {
						ctx.fillText(text, textX + 10, y - textHeight + fideHeight);
					}
				}
				this.pollutionLevels.forEach(level => {
					const width = chartWidth * level.percent;
					nextX = x + width; // 记录下一个起始位置的x坐标
					// 绘制颜色区块
					drawColorBlock(level.color, width, chartHeight);
					// 绘制标题
					drawText(level.level, width);
					drawMarkText(level.mark);
					if (level.level==='优') {
						drawMarkText("0");
						drawMarkText(level.mark);
					}
					x = nextX; // 更新起始位置的x坐标
				});
				ctx.draw();
			}
		}
	}
</script>
实现效果图如下
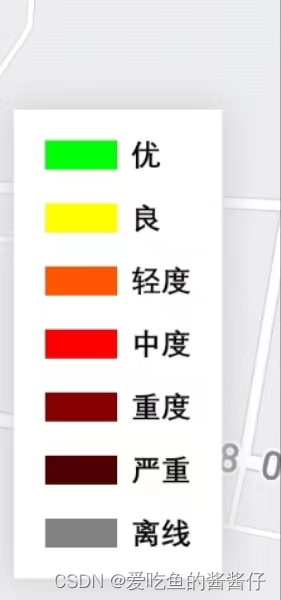
方法二 使用盒子创建竖向对应(比较笨拙,但是app-nvue页面只能这样来实现了)
这里我封装了一个方法
组件代码
<template>
	<view class="legend-section">
		<view class="rowlist" v-for="(item,index) in list" :key="index">
			<view class="bgColor" :style="{'width':'50rpx','height':'20rpx','background-color':item.bgColor}"></view>
			<view class="mark"><text style="font-size: 22rpx;">{

   {item.mark}}</text></view>
		</view>
	</view>
</template>

<script>
	export default {
		props: {
			legendList: {
				type: [Array],
				default: () => []
			},
		},
		data() {
			return {
				list: []
			}
		},
		watch: {
			legendList: {
				handler: function(newVal) {
					const datas = JSON.parse(newVal)
					datas.forEach((ele) => {
						if (ele.mark === '优') {
							ele.bgColor = "#00FF00"
						} else if (ele.mark === '良') {
							ele.bgColor = "#FFFF00"
						} else if (ele.mark === '轻度') {
							ele.bgColor = "#ff5500"
						} else if (ele.mark === '中度') {
							ele.bgColor = "#FF0000"
						} else if (ele.mark === '重度') {
							ele.bgColor = "#860000"
						} else if (ele.mark === '严重') {
							ele.bgColor = "#510000"
						} else if (ele.mark === '离线') {
							ele.bgColor = "#818181"
						}
					})
					this.list = datas
				},
				deep: true, // 深度监听
				immediate: true // 立即执行
			}
		},
	}
</script>

<style lang="scss" scoped>
	.legend-section {
		border-radius: 2rpx;
		padding: 10rpx;
	}

	.rowlist {
		display: flex;
		flex-flow: row nowrap;
		align-items: center;
		justify-content: flex-start;
		margin: 10rpx 12rpx;
	}

	.mark {
		padding-left: 10rpx;
	}
</style>
调用组件
	<cover-view class="maplegend-list" v-if="legendFlag">
				<legend :legend-list="legendList"></legend>
			</cover-view>

//数据初始化
	legendList: [], //图例信息

//传入数据
	this.legendList = JSON.stringify(legendList.data) //图例信息
实现效果如下
总而言之,app-nvue页面有很大的性能提升,但总会牺牲一些东西来弥补。app-nvue页面css很多有局限性,仔细阅读文档。