Echarts之前有提供离线地图可视化方案,我们下载对应的地图数据然后加上Echarts的配置文件,就能得到很好的地图可视化效果,现在的新版Echarts已经不提供对应的案例了,不过对应的配置项还是保留下来了
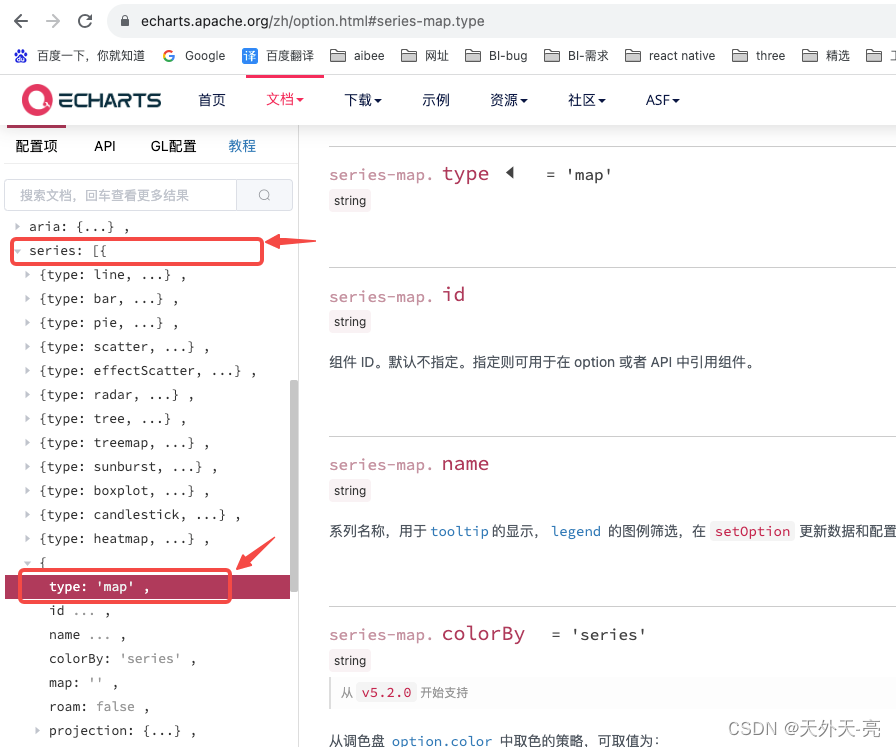
地图配置链接
接下来我会用几个案例依次给大家展示一些效果,根据这些配置,各位可以根据自己需求加以配置,先看效果图:
在此之前友情提示各位,一定要在国家认可的官网上下载合规的地图数据

以上是一些基础的地图效果,加上一个自定义的弹窗
$.get('./chinas.json', function (chinaJson) {
    echarts.registerMap('china', chinaJson);
    let chart = echarts.init(document.getElementById('china-map'));
    let option = {
      tooltip: {
        show: false,
        trigger: 'item',
        formatter: '{a}, {b},{c}'
      },
      series: [
        {
          type: 'map',
          map: 'china',
          mapType: 'china',
          roam: false,
          label: {
            show: true,
            fontSize: 12,
            position: 'bottom'
          },

          markPoint: {
            symbol: 'pin',
            symbolSize: [40, 50],
            itemStyle: {
              color: "#000",
              borderColor: "#000"
            },
            label: {
              show: true,
              // formatter: `{b}`,
              formatter: () => {
                let str1 = {
                  title: '郑州',
                  names: ['日均人次', '日均人数'],
                  values: [1000, 2000]
                };
                return `{a|${str1.title}}\n{b|${str1.names[0]}:} {c|${str1.values[0]}}\n{b|${str1.names[1]}:} {c|${str1.values[1]}}`;
              },
              backgroundColor: 'rgb(242,242,242)',
              borderColor: '#aaa',
              borderWidth: 1,
              borderRadius: 10,
              padding: [20, 20],
              lineHeight: 26,
              shadowBlur: 5,
              shadowColor: '#000',
              shadowOffsetX: 0,
              shadowOffsetY: 1,
              position: 'right',
              distance: 20,
              rich: {
                a: {
                  align: 'left',
                  lineHeight: 25,
                  paddingBottom: 5,
                  color: '#000',
                  fontSize: 14,
                  // textShadowBlur: 2,
                  // textShadowColor: '#000',
                  // textShadowOffsetX: 0,
                  // textShadowOffsetY: 1,
                  // textBorderColor: '#333',
                  // textBorderWidth: 2
                },
                b: {
                  lineHeight: 20,
                  fontSize: 14,
                  color: '#000'
                },
                c: {
                  lineHeight: 20,
                  color: '#ff8811',
                  textBorderColor: '#000',
                  textBorderWidth: 1,
                  fontSize: 14
                }
              }
            },
            data: [
              {
                name: '郑州',
                coord: [114.14, 34.16]
              }
            ]
          },

          itemStyle: {
            areaColor: "#5BA9F3",
            borderColor: "#000"
          }
        }
      ]
    };
    chart.setOption(option);
  });
$.get用的是jquery的方法,chinas.json是地图数据