一、简介
1、Prometheus简介
官网:https://prometheus.io
项目代码:https://github.com/prometheus
- Prometheus(普罗米修斯)是一个最初在SoundCloud上构建的监控系统。自2012年成为社区开源项目,拥有非常活跃的开发人员和用户社区。为强调开源及独立维护,Prometheus于2016年加入云原生云计算基金会(CNCF),成为继Kubernetes之后的第二个托管项目。
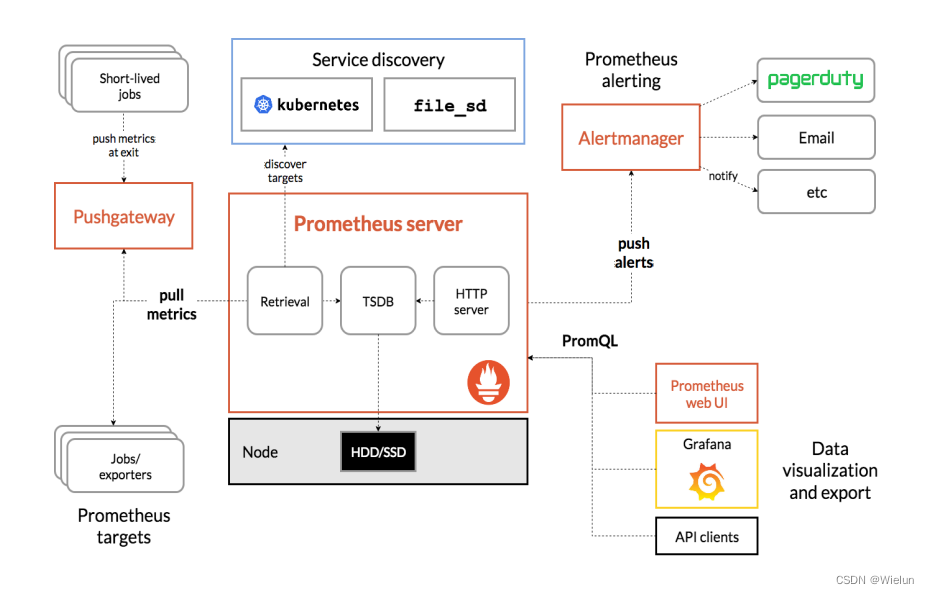
2、Prometheus组件与架构
- Prometheus Server:收集指标和存储时间序列数据,并提供查询接口
- ClientLibrary:客户端库
- Push Gateway:短期存储指标数据。主要用于临时性的任务
- Exporters:采集已有的第三方服务监控指标并暴露metrics
- Alertmanager:告警
- Web UI:简单的Web控制台
3、监控实现
exporter列表:https://prometheus.io/docs/instrumenting/exporters
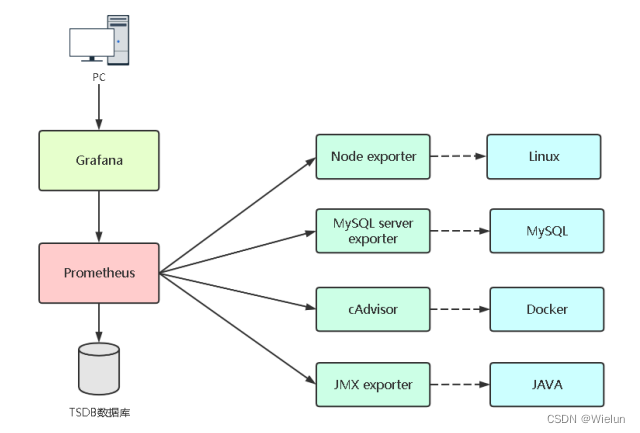
4、Grafana 简介
-
Grafana 官方是这么介绍 Grafana 的:grafana是用于可视化大型测量数据的开源程序,他提供了强大和优雅的方式去创建、共享、浏览数据。dashboard中显示了你不同metric数据源中的数据。
-
Grafana 官方还对 Grafana 的适用场景以及基本特征作了介绍:
- grafana最常用于因特网基础设施和应用分析,但在其他领域也有机会用到,比如:工业传感器、家庭自动化、过程控制等等。
- grafana有热插拔控制面板和可扩展的数据源,目前已经支持Graphite、InfluxDB、OpenTSDB、Elasticsearch。
二、实验环境
selinux iptables off
| 主机名 | IP | 系统版本 |
|---|---|---|
| jenkins | 10.10.10.10 | rhel7.5 |
| tomcat | 10.10.10.11 | rhel7.5 |
| winserver | 10.10.10.12 | winserver2016 |
三、部署Prometheus
安装文档:https://prometheus.io/docs/prometheus/latest/installation/
1、创建prometheus.yml
[root@jenkins ~]# mkdir -p Prometheus/data
[root@jenkins ~]# cat Prometheus/prometheus.yml
# my global config
global:
  scrape_interval: 15s # Set the scrape interval to every 15 seconds. Default is every 1 minute.
  evaluation_interval: 15s # Evaluate rules every 15 seconds. The default is every 1 minute.
  # scrape_timeout is set to the global default (10s).

# Alertmanager configuration
alerting:
  alertmanagers:
    - static_configs:
        - targets:
          # - alertmanager:9093

# Load rules once and periodically evaluate them according to the global 'evaluation_interval'.
rule_files:
  # - "first_rules.yml"
  # - "second_rules.yml"

# A scrape configuration containing exactly one endpoint to scrape:
# Here it's Prometheus itself.
scrape_configs:
  # The job name is added as a label `job=<job_name>` to any timeseries scraped from this config.
  - job_name: "prometheus"

    # metrics_path defaults to '/metrics'
    # scheme defaults to 'http'.

    static_configs:
      - targets: ["localhost:9090"]
2、安装
(1)docker启动
docker run -d \
--name=prometheus \
-v /root/Prometheus/prometheus.yml:/etc/prometheus/prometheus.yml \
-v /root/Prometheus/data:/prometheus \
-p 9090:9090 \
prom/prometheus
(2)报错
[root@jenkins ~]# docker logs -f 3e0e4270bd92
ts=2023-05-21T05:26:40.392Z caller=main.go:531 level=info msg="No time or size retention was set so using the default time retention" duration=15d
ts=2023-05-21T05:26:40.392Z caller=main.go:575 level=info msg="Starting Prometheus Server" mode=server version="(version=2.44.0, branch=HEAD, revi                                                                                                                                             sion=1ac5131f698ebc60f13fe2727f89b115a41f6558)"
ts=2023-05-21T05:26:40.392Z caller=main.go:580 level=info build_context="(go=go1.20.4, platform=linux/amd64, user=root@739e8181c5db, date=20230514                                                                                                                                             -06:18:11, tags=netgo,builtinassets,stringlabels)"
ts=2023-05-21T05:26:40.392Z caller=main.go:581 level=info host_details="(Linux 3.10.0-862.el7.x86_64 #1 SMP Wed Mar 21 18:14:51 EDT 2018 x86_64 3e                                                                                                                                             0e4270bd92 (none))"
ts=2023-05-21T05:26:40.392Z caller=main.go:582 level=info fd_limits="(soft=65536, hard=65536)"
ts=2023-05-21T05:26:40.392Z caller=main.go:583 level=info vm_limits="(soft=unlimited, hard=unlimited)"
ts=2023-05-21T05:26:40.393Z caller=query_logger.go:91 level=error component=activeQueryTracker msg="Error opening query log file" file=/prometheus                                                                                                                                             /queries.active err="open /prometheus/queries.active: permission denied"
panic: Unable to create mmap-ed active query log

goroutine 1 [running]:
github.com/prometheus/prometheus/promql.NewActiveQueryTracker({0x7fffcfb19f02, 0xb}, 0x14, {0x3c76360, 0xc0009bb360})
        /app/promql/query_logger.go:121 +0x3cd
main.main()
        /app/cmd/prometheus/main.go:637 +0x6f13
[root@jenkins ~]# chmod 777 -R Prometheus/
[root@jenkins ~]# docker ps -a
CONTAINER ID        IMAGE                               COMMAND                  CREATED             STATUS                     PORTS                                              NAMES
3e0e4270bd92        prom/prometheus                     "/bin/prometheus --c…"   2 minutes ago       Exited (2) 2 minutes ago                                                      prometheus
[root@jenkins ~]# docker start 3e0e4270bd92
3e0e4270bd92
[root@jenkins ~]# docker ps -a
CONTAINER ID        IMAGE                               COMMAND                  CREATED             STATUS              PORTS                                              NAMES
3e0e4270bd92        prom/prometheus                     "/bin/prometheus --c…"   2 minutes ago       Up 2 seconds        0.0.0.0:9090->9090/tcp                             prometheus
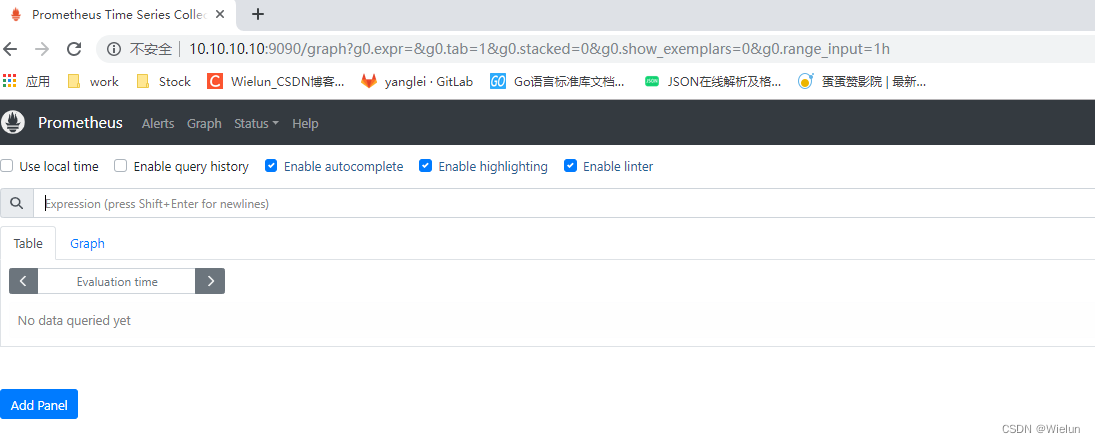
3、浏览器查看
http://10.10.10.10:9090
四、Grafana安装与使用
安装文档:https://grafana.com/grafana/download?platform=docker
1、安装
[root@jenkins ~]# mkdir -p grafana/data
[root@jenkins ~]# chmod 777 -R grafana
[root@jenkins ~]# docker run -d --name=grafana -p 3000:3000 -v /root/grafana/data:/var/lib/grafana grafana/grafana-enterprise
2、报错
升级下Google浏览器版本即可
If you're seeing this Grafana has failed to load its application files
1. This could be caused by your reverse proxy settings.
2. If you host grafana under subpath make sure your grafana.ini root_url setting includes subpath. If not using a reverse proxy make sure to set serve_from_sub_path to true.
3. If you have a local dev build make sure you build frontend using: yarn start, or yarn build
4. Sometimes restarting grafana-server can help
5. Check if you are using a non-supported browser. For more information, refer to the list of supported browsers.

3、访问登录
http://10.10.10.10:3000/login
直接输入账号密码设置即可,默认admin/admin

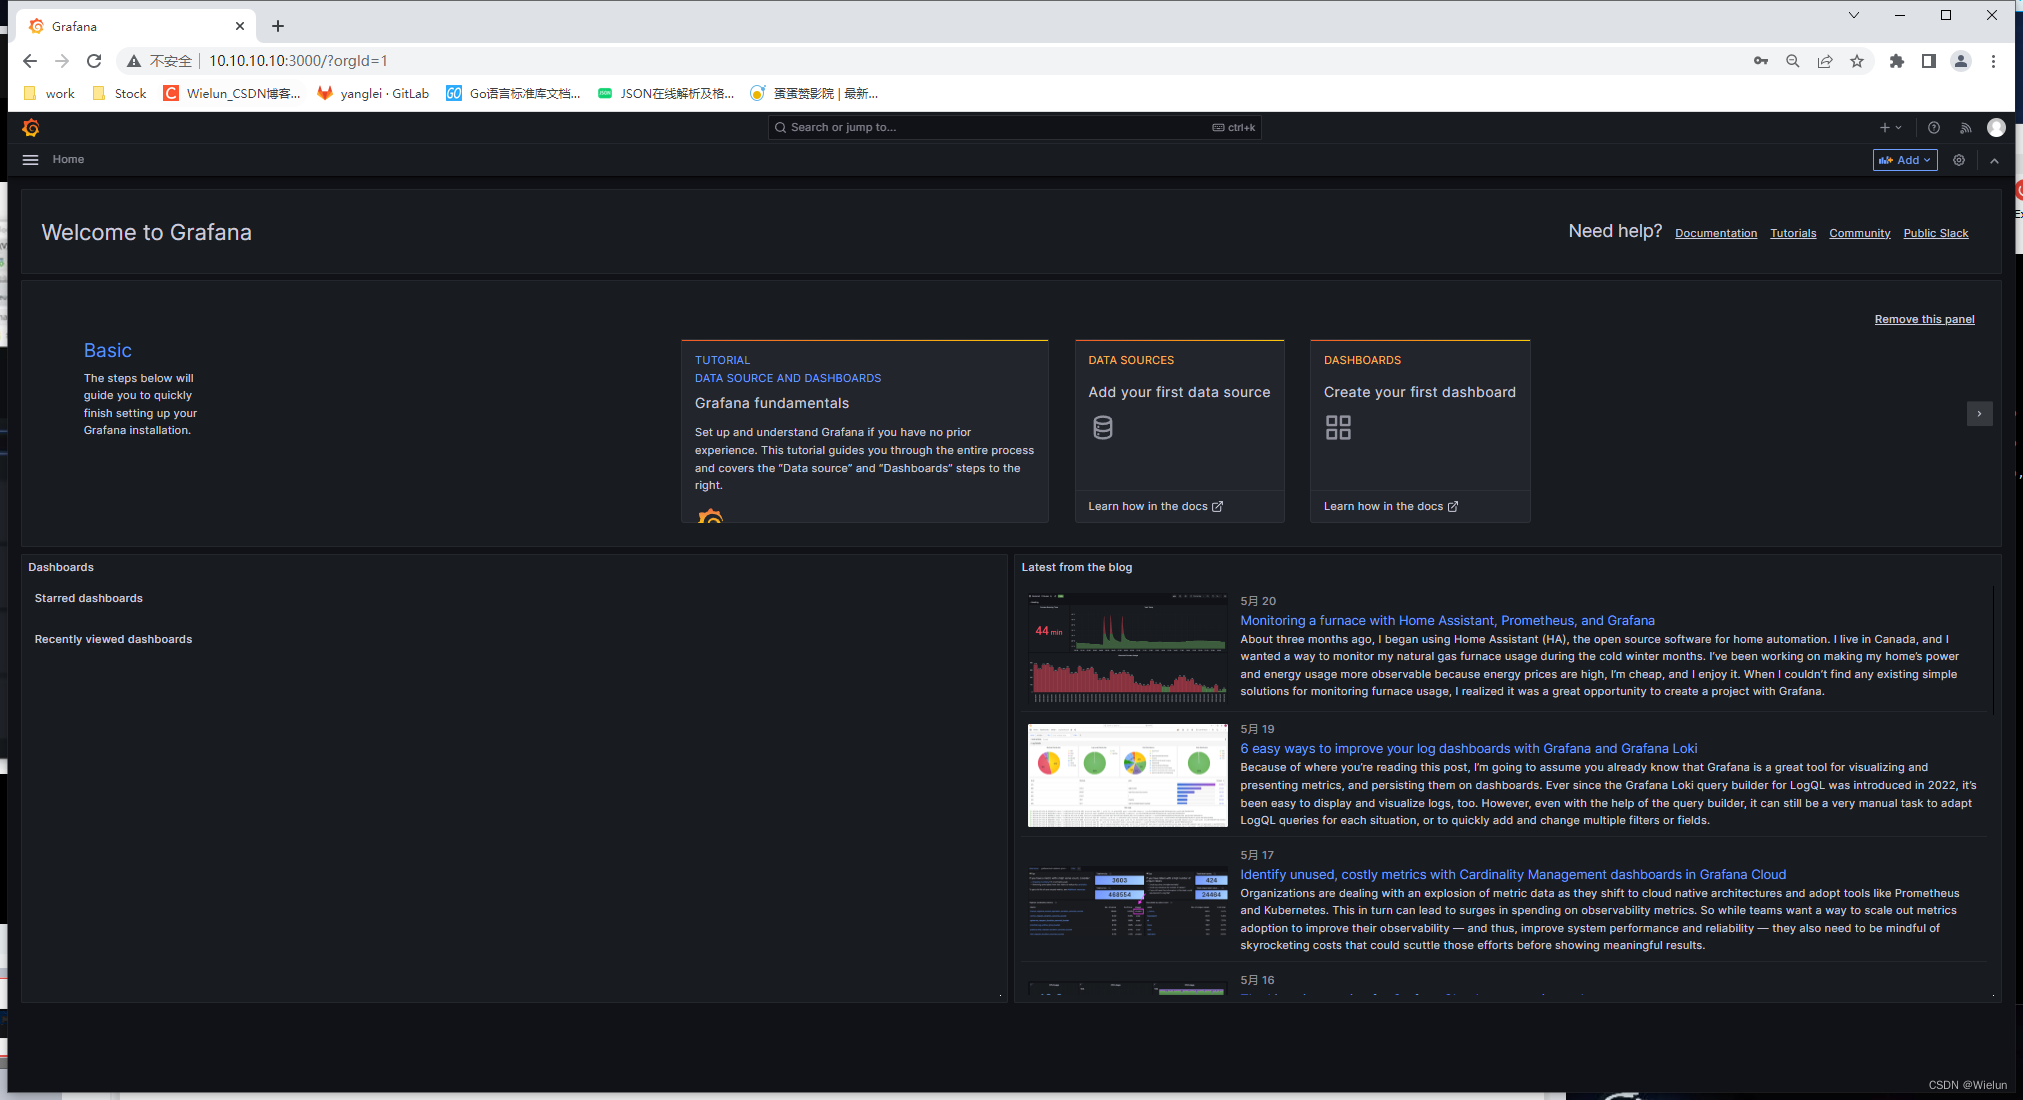
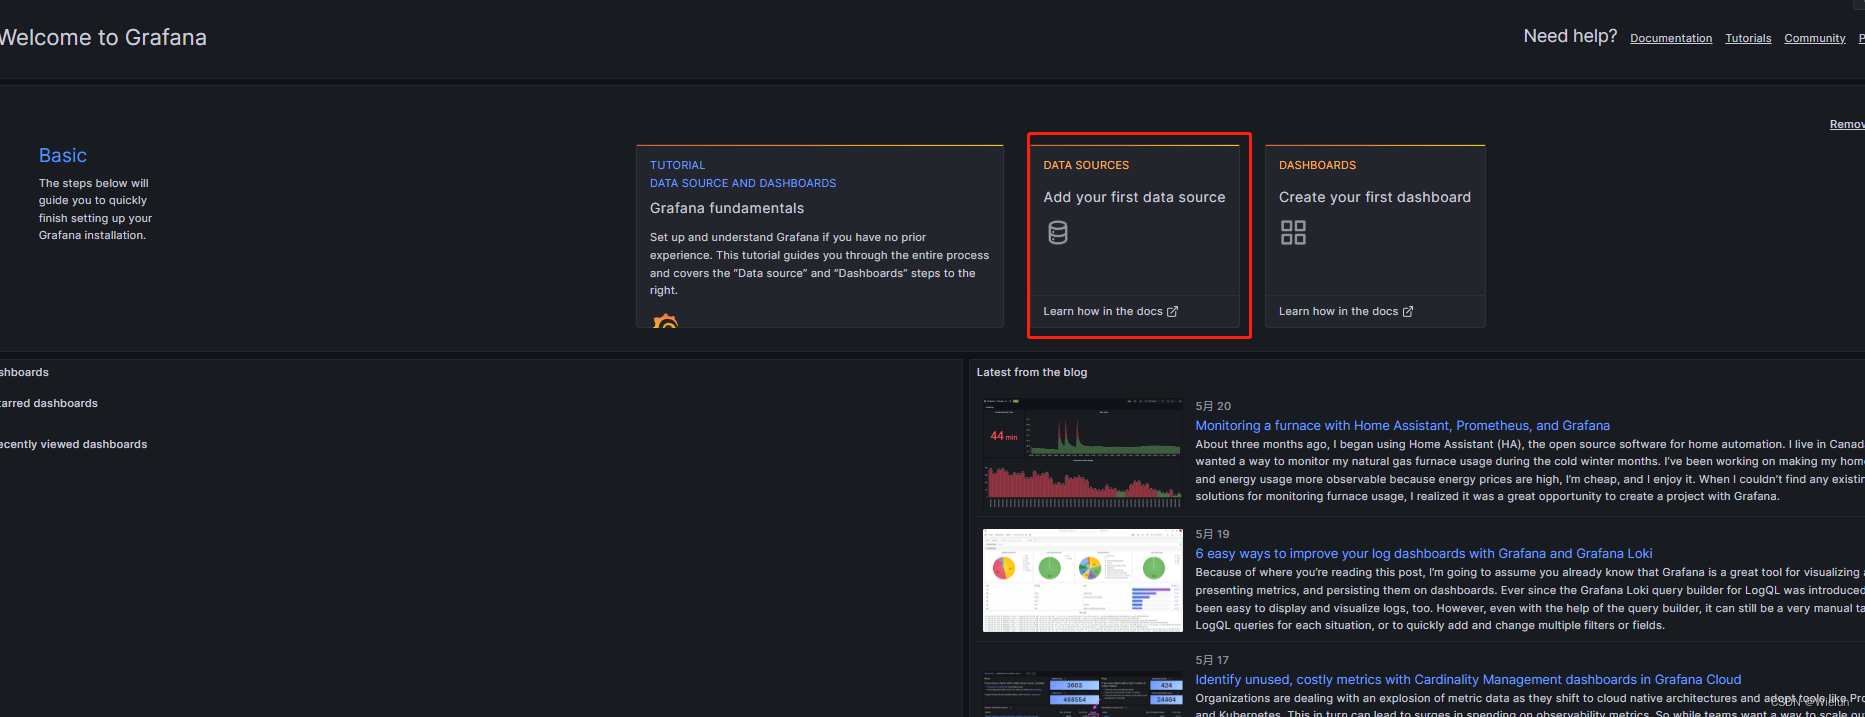
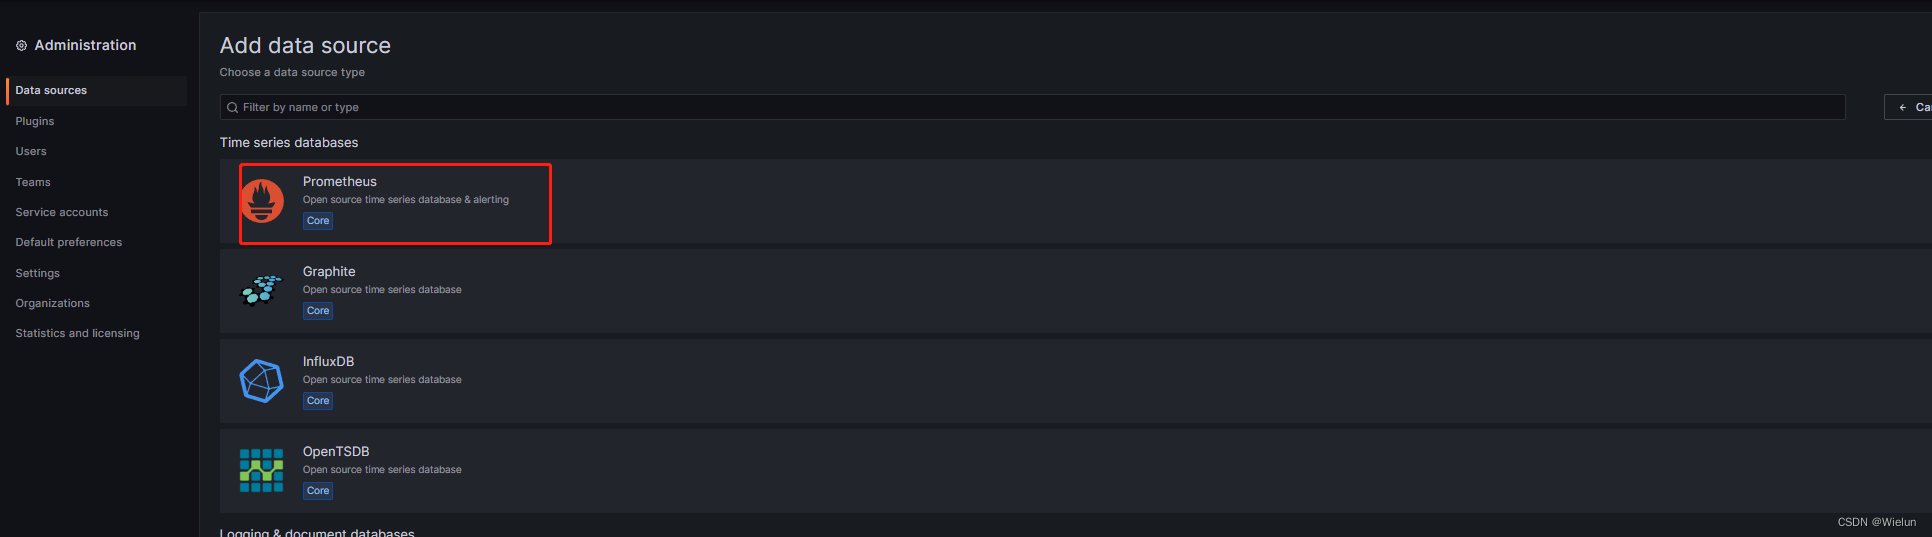
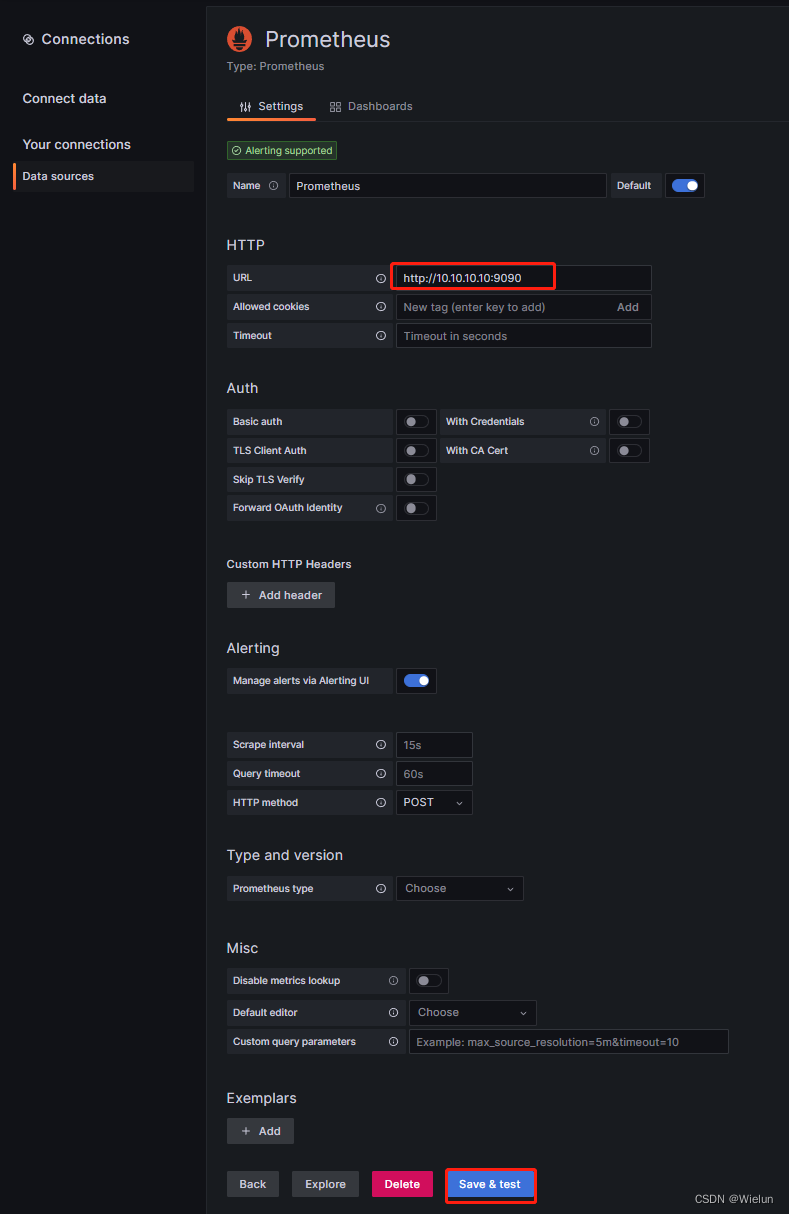
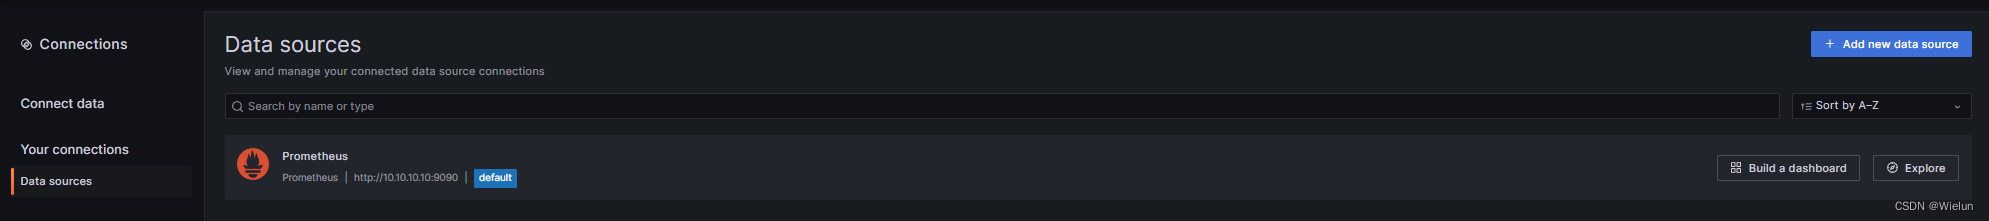
4、添加数据源
五、监控Linux服务器
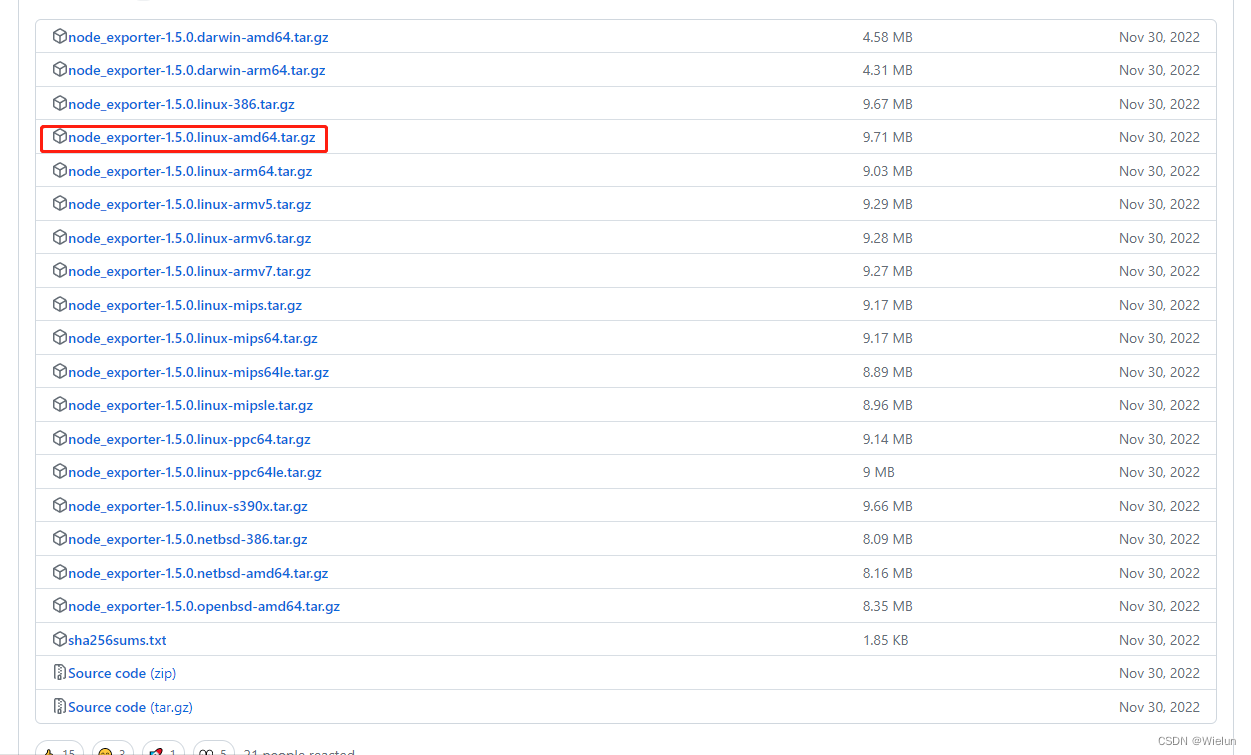
1、安装node_exporter
node_exporter:用于监控Linux系统的指标采集器。
使用文档:https://prometheus.io/docs/guides/node-exporter/
项目代码:https://github.com/prometheus/node_exporter
下载地址:https://github.com/prometheus/node_exporter/releases/tag/v1.5.0
[root@server1 ~]# tar xf node_exporter-1.5.0.linux-amd64.tar.gz
[root@server1 ~]# mv node_exporter-1.5.0.linux-amd64 /usr/local/node_exporter
[root@server1 ~]# cat /usr/lib/systemd/system/node_exporter.service
[Unit]
Description=node_exporter

[Service]
ExecStart=/usr/local/node_exporter/node_exporter
ExecReload=/bin/kill -HUP $MAINPID
KillMode=process
Restart=on-failure

[Install]
WantedBy=multi-user.target

[root@server1 ~]# systemctl daemon-reload
[root@server1 ~]# systemctl enable node_exporter && systemctl start node_exporter
[root@server1 ~]# netstat -lntup|grep 9100
tcp6       0      0 :::9100                 :::*                    LISTEN      4136/node_exporter
2、配置prometheus.yml
[root@jenkins ~]# cat Prometheus/prometheus.yml
# my global config
global:
  scrape_interval: 15s # Set the scrape interval to every 15 seconds. Default is every 1 minute.
  evaluation_interval: 15s # Evaluate rules every 15 seconds. The default is every 1 minute.
  # scrape_timeout is set to the global default (10s).

# Alertmanager configuration
alerting:
  alertmanagers:
    - static_configs:
        - targets:
          # - alertmanager:9093

# Load rules once and periodically evaluate them according to the global 'evaluation_interval'.
rule_files:
  # - "first_rules.yml"
  # - "second_rules.yml"

# A scrape configuration containing exactly one endpoint to scrape:
# Here it's Prometheus itself.
scrape_configs:
  # The job name is added as a label `job=<job_name>` to any timeseries scraped from this config.
  - job_name: "prometheus"

    # metrics_path defaults to '/metrics'
    # scheme defaults to 'http'.

    static_configs:
      - targets: ["localhost:9090"]

  - job_name: "Linux Server"
    static_configs:
      - targets: ["10.10.10.11:9100"]

 [root@jenkins ~]# docker restart prometheus
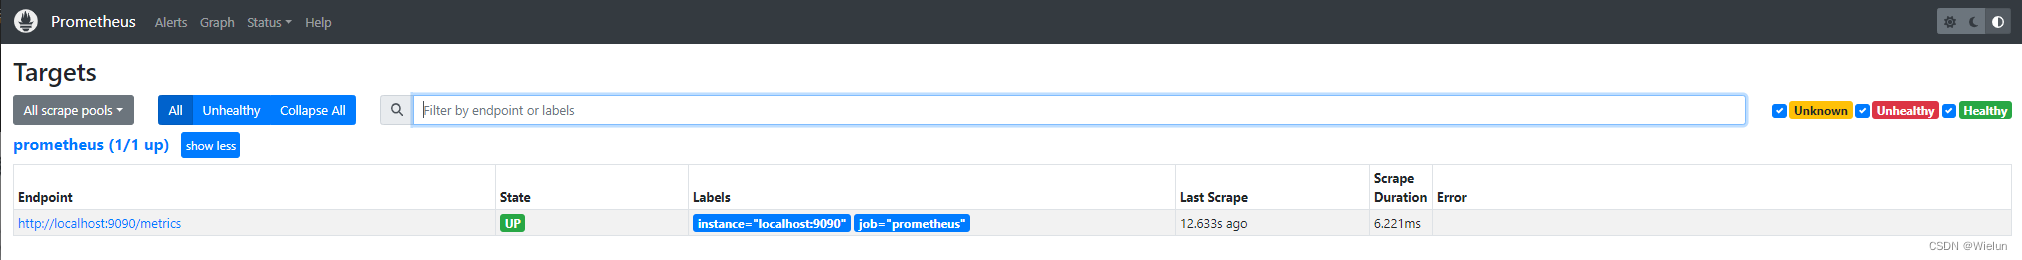
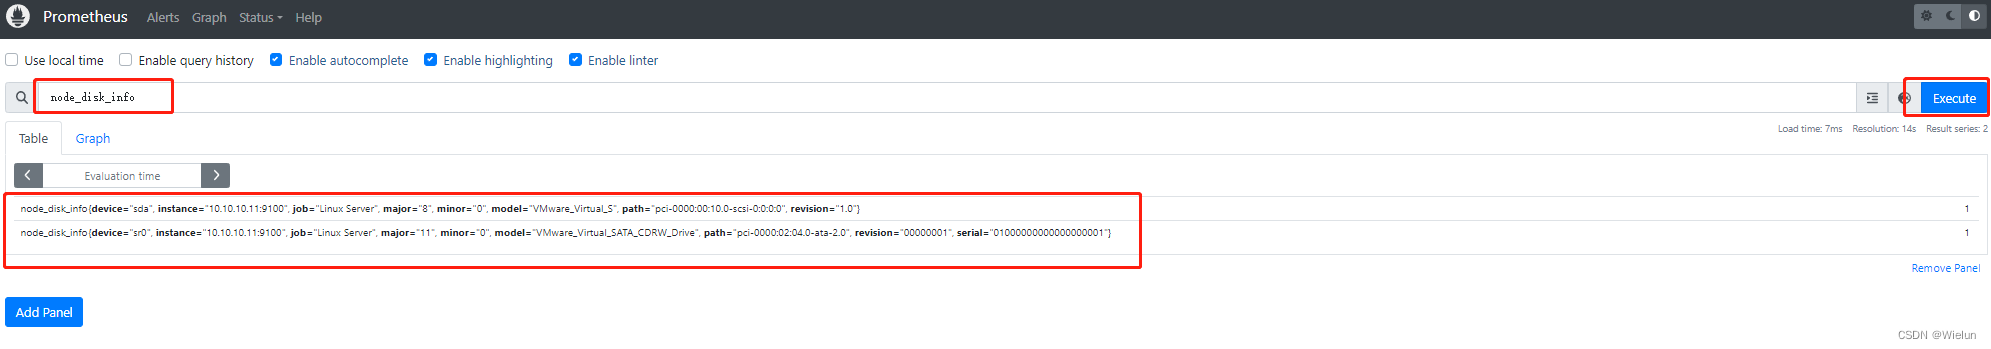
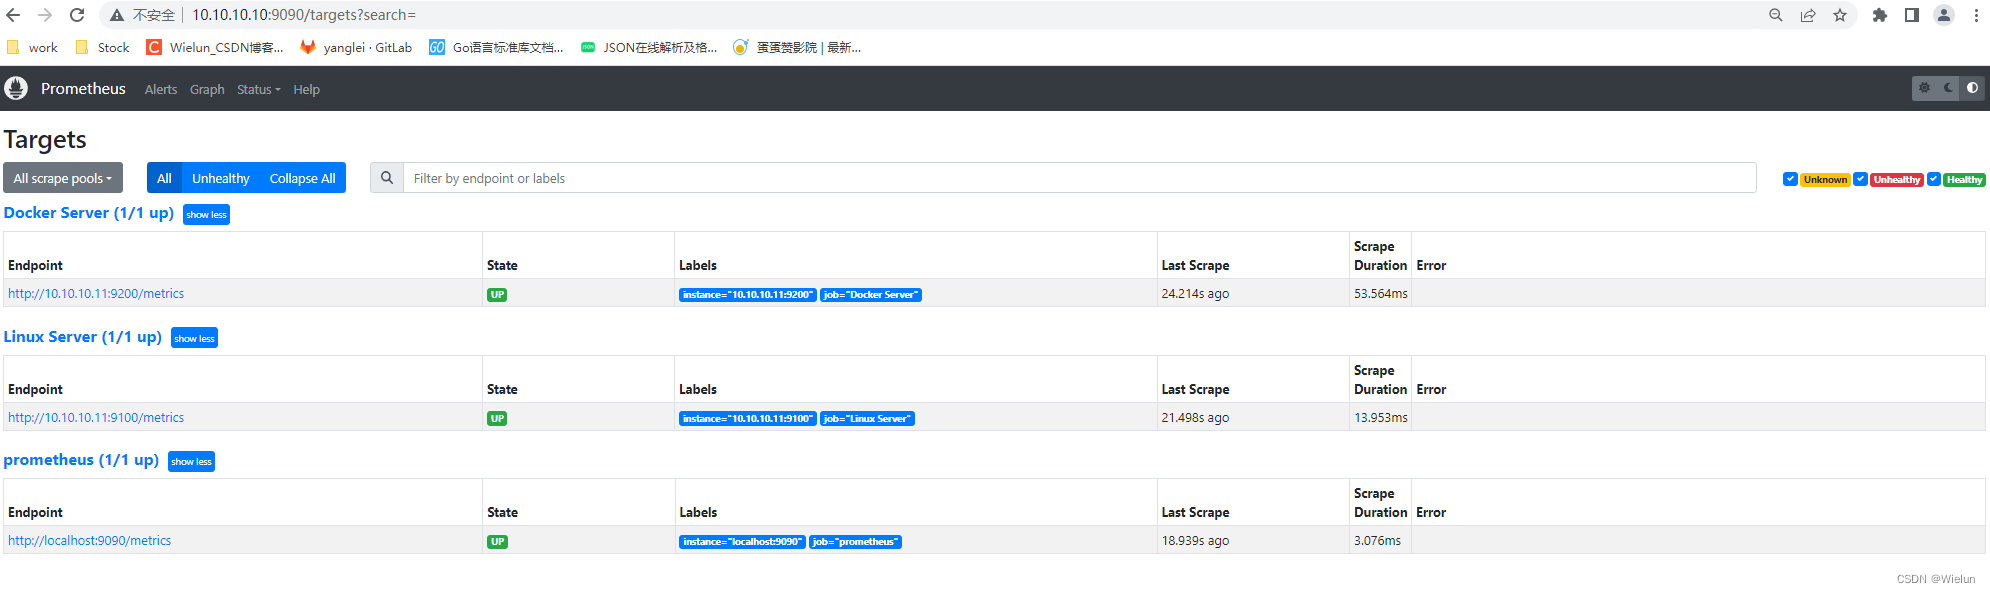
3、Prometheus测试
查看节点是否添加成功
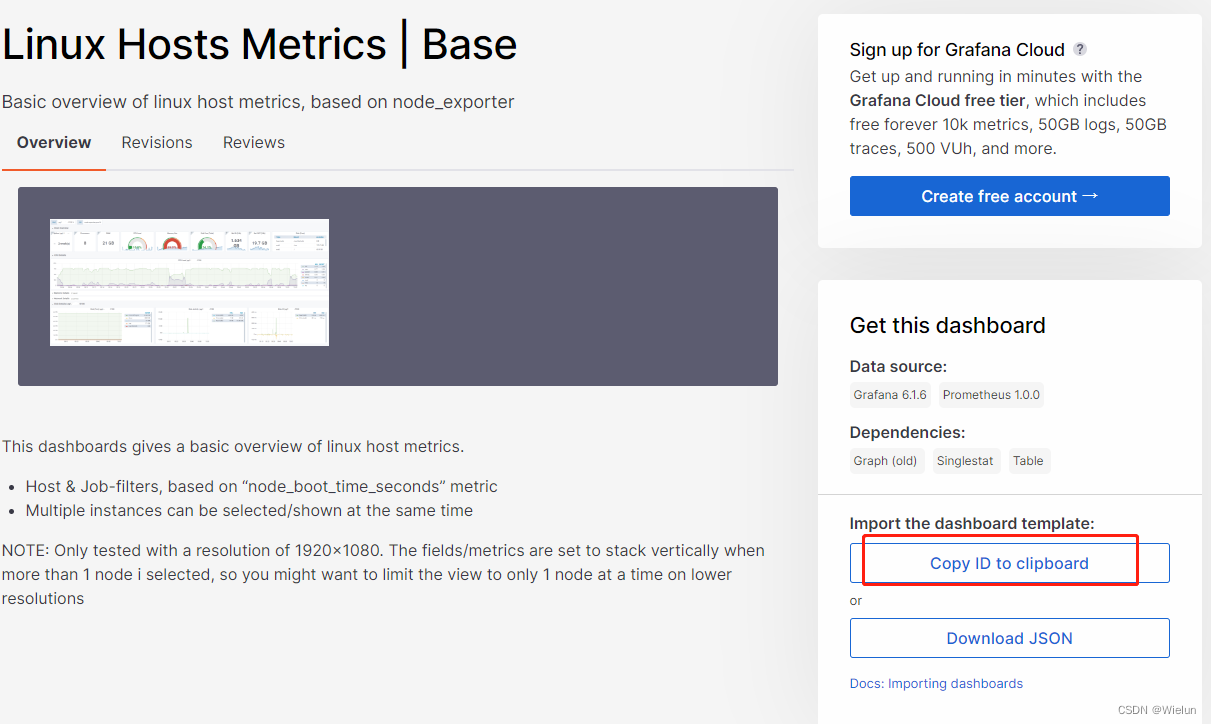
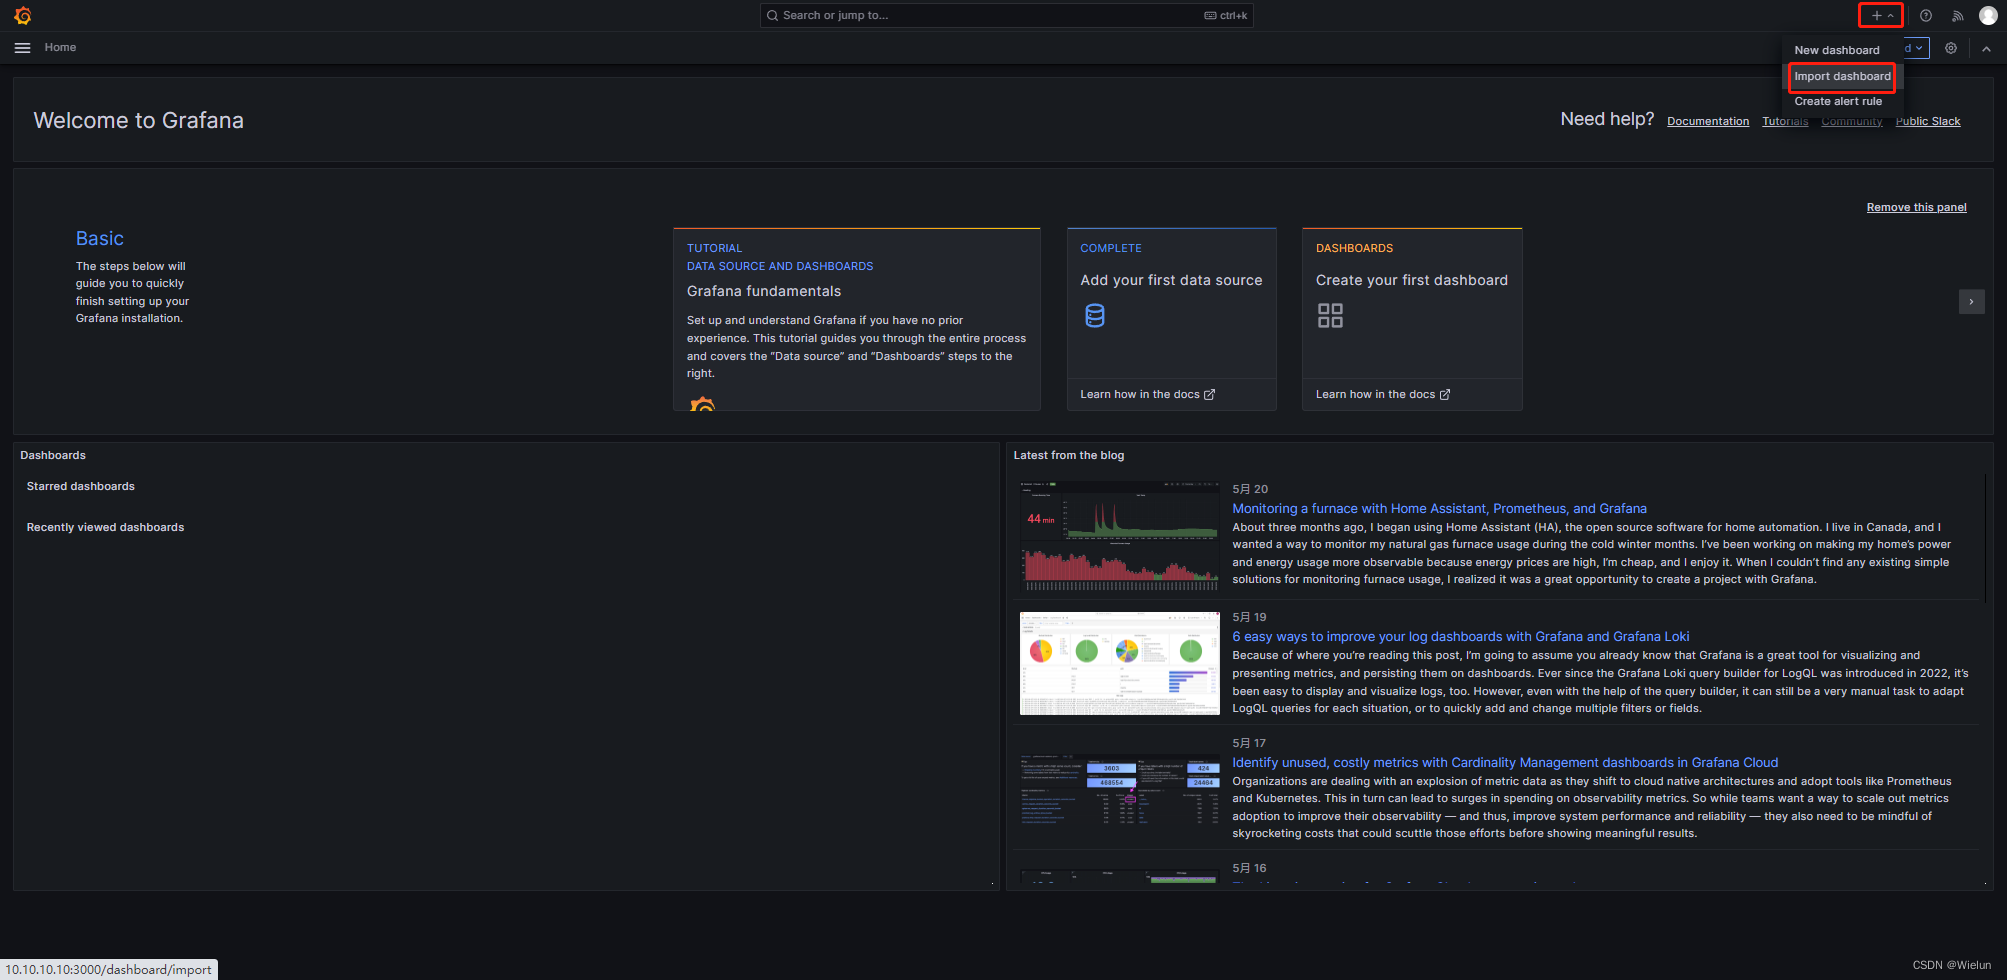
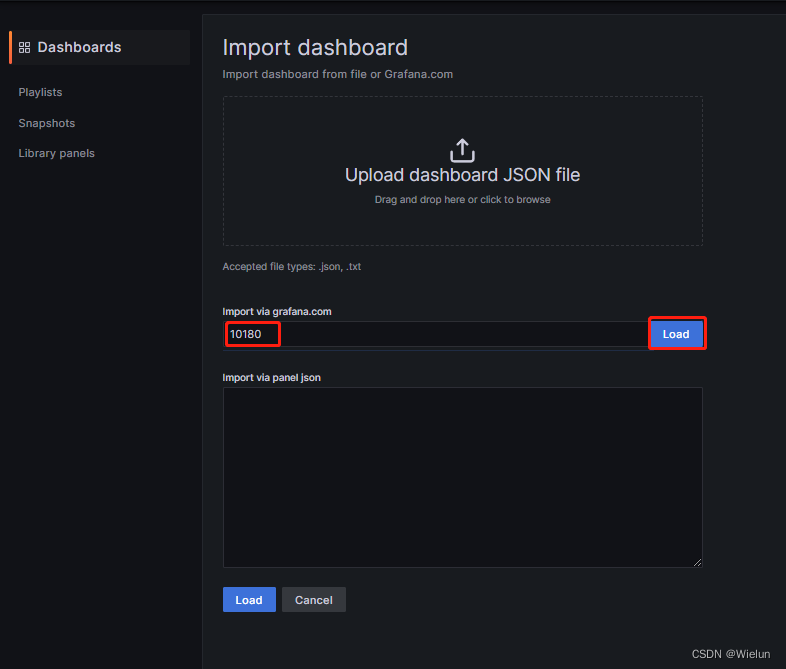
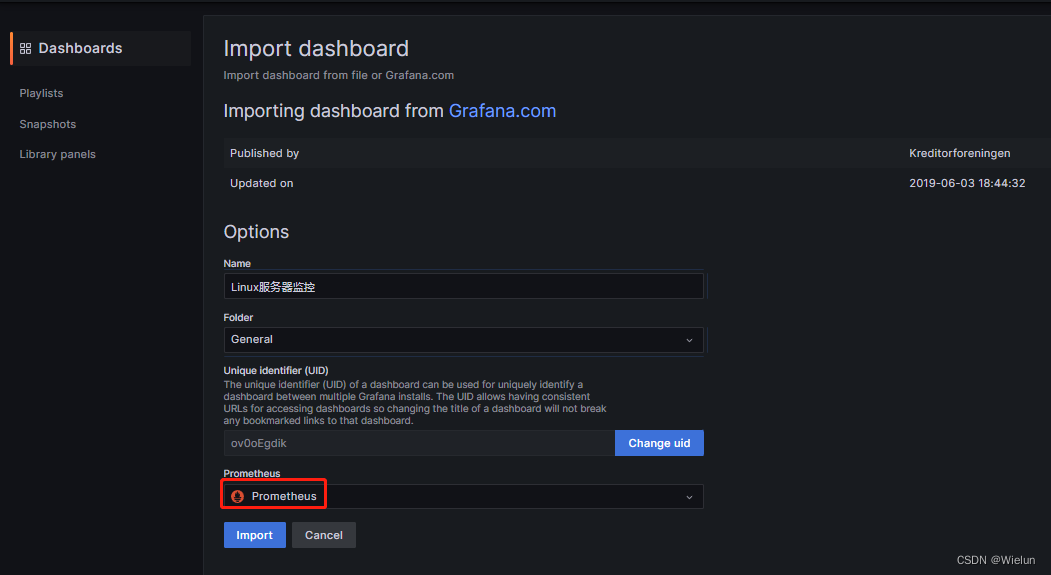
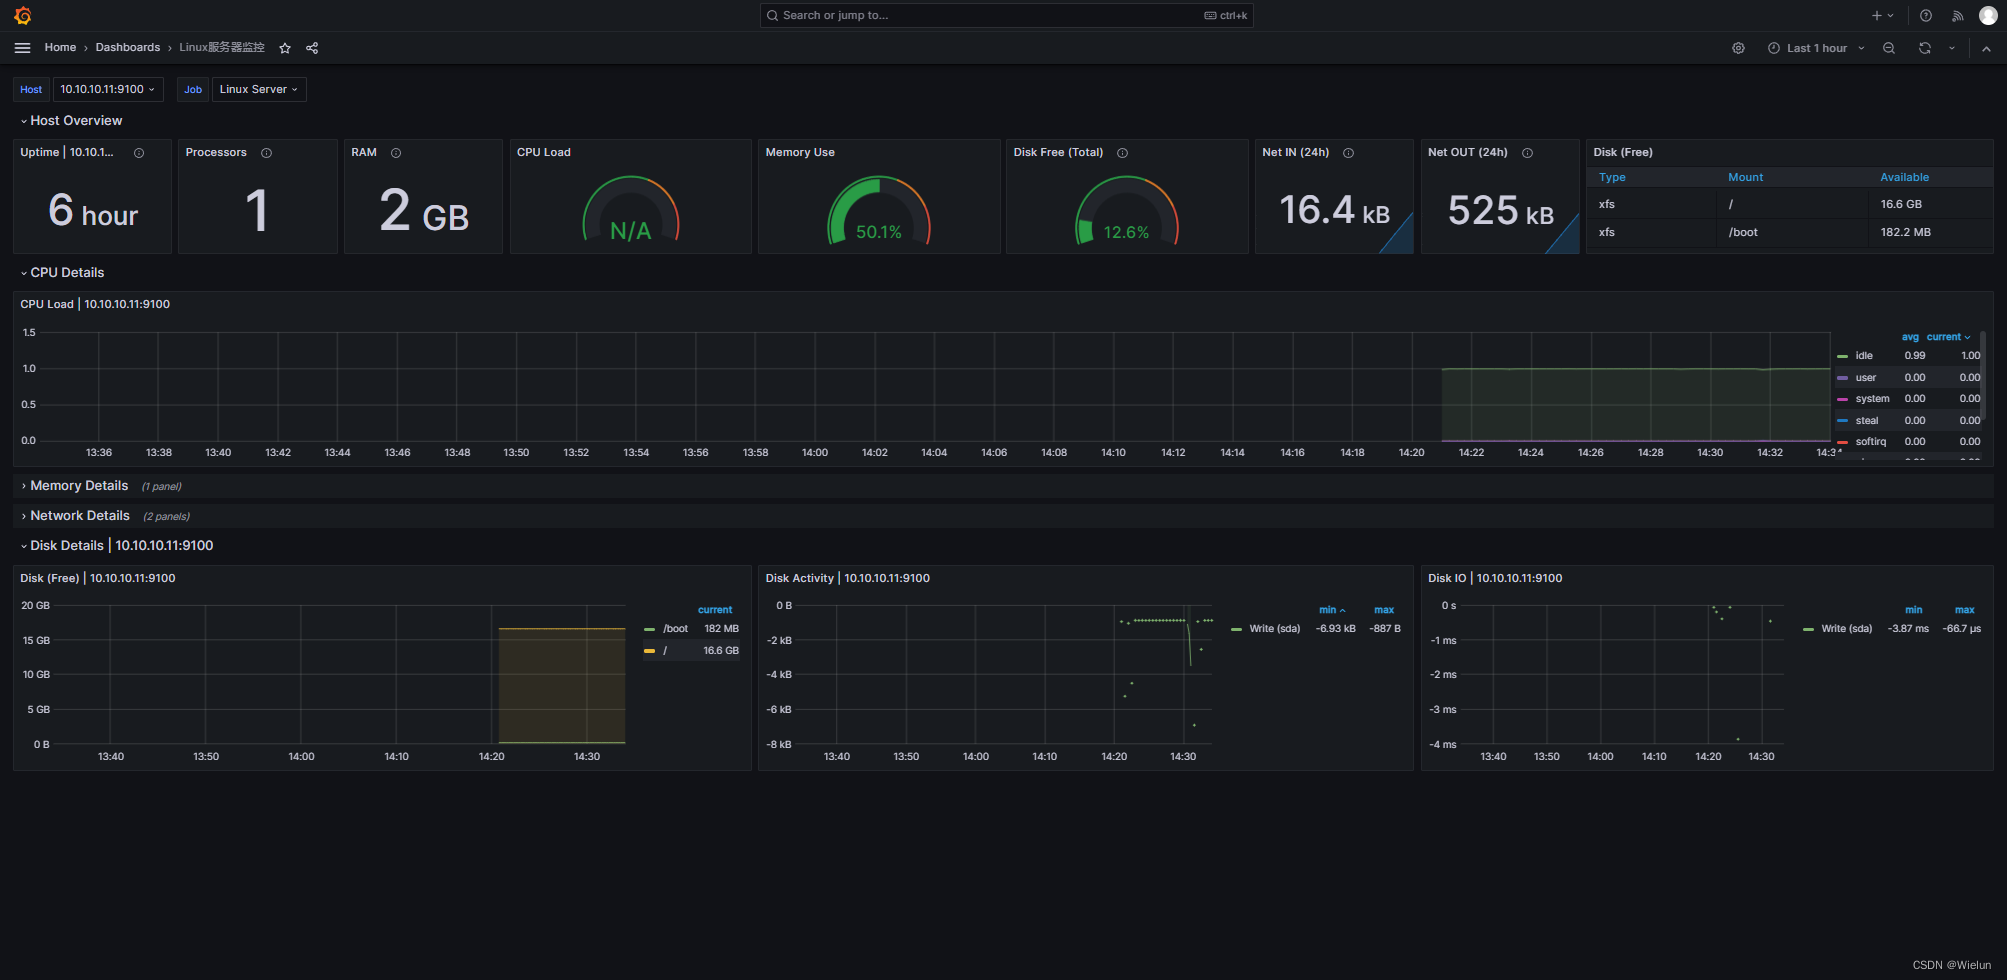
4、Grafana导入dashboard
dashboard模板地址: https://grafana.com/grafana/dashboards/
选择这个模板:https://grafana.com/grafana/dashboards/10180-kds-linux-hosts/
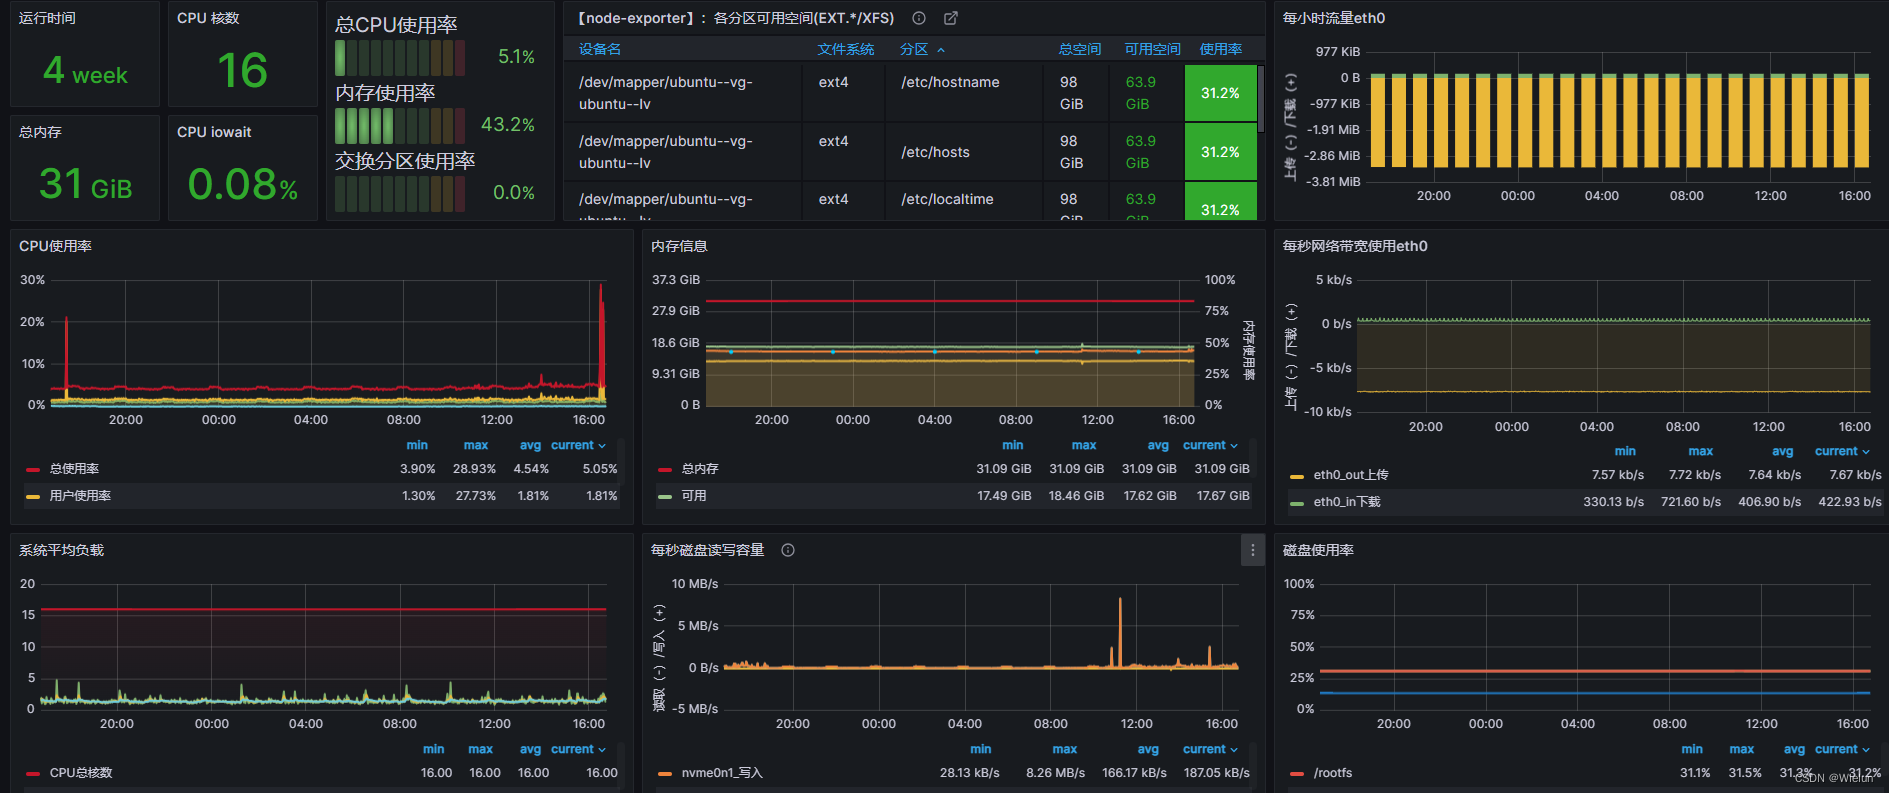
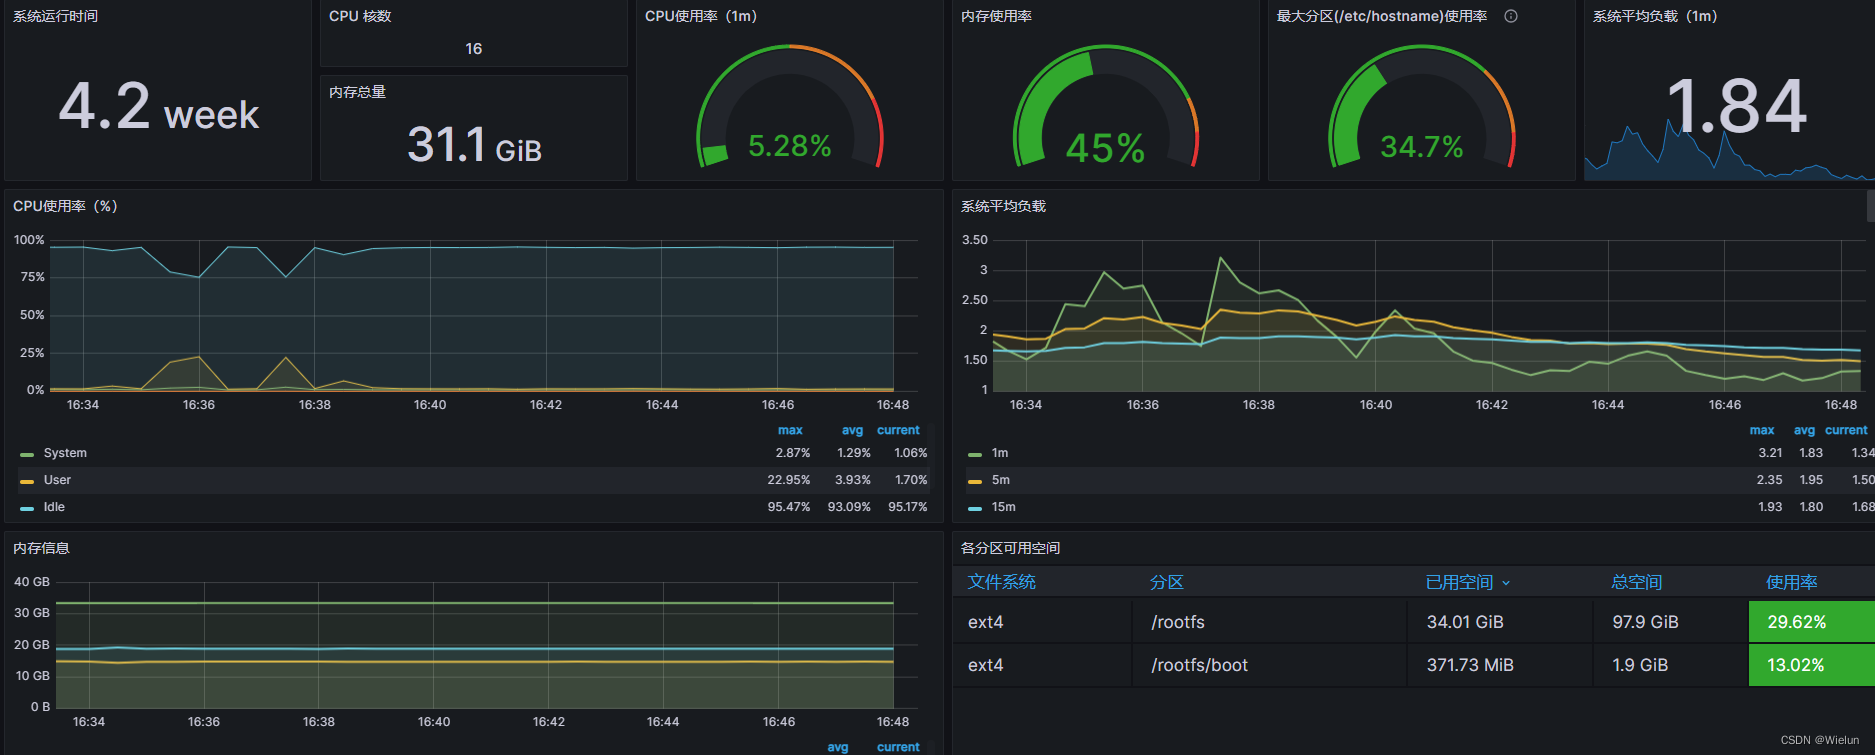
推荐:12633,9276
添加:
12633:
9276:
六、监控Winserver服务器
1、下载
https://github.com/prometheus-community/windows_exporter/releases
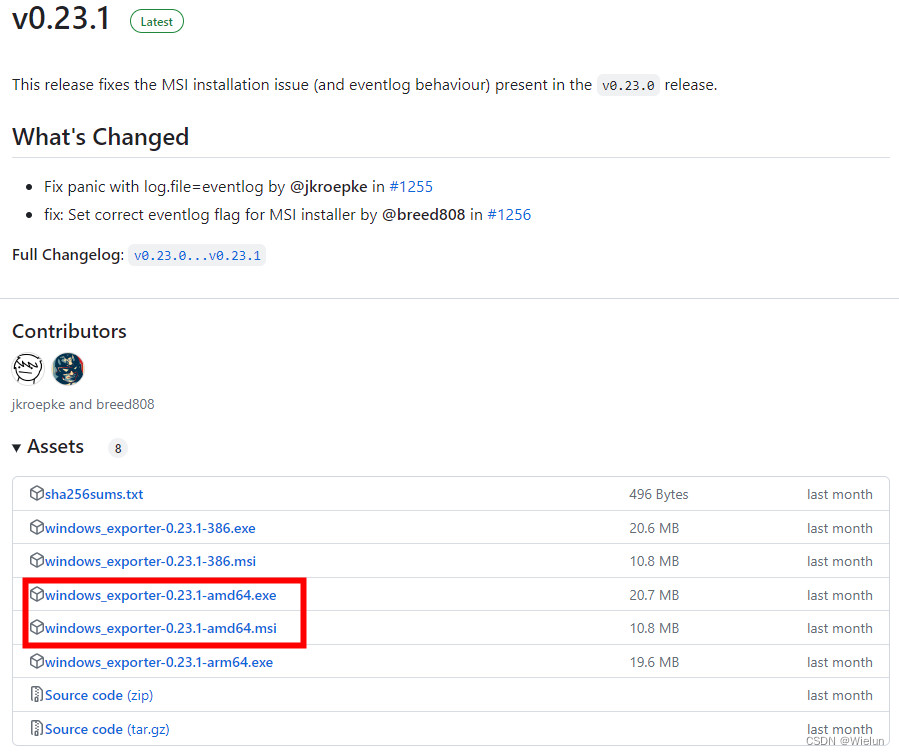
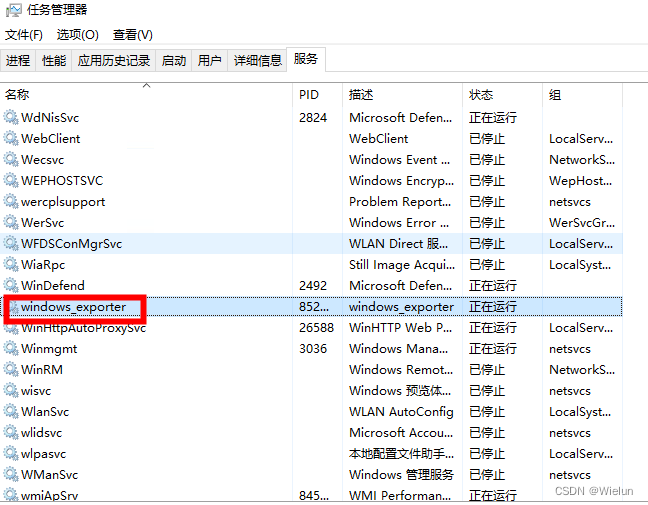
2、安装
这里使用msi方式安装
放入winserver中双击运行即可
3、配置prometheus.yml
末尾添加
  - job_name: "winserver"
    static_configs:
      - targets: ["10.10.10.12:9182"]
[root@jenkins ~]# docker restart prometheus
4、配置grafana
使用模板:10467

七、监控Docker服务器
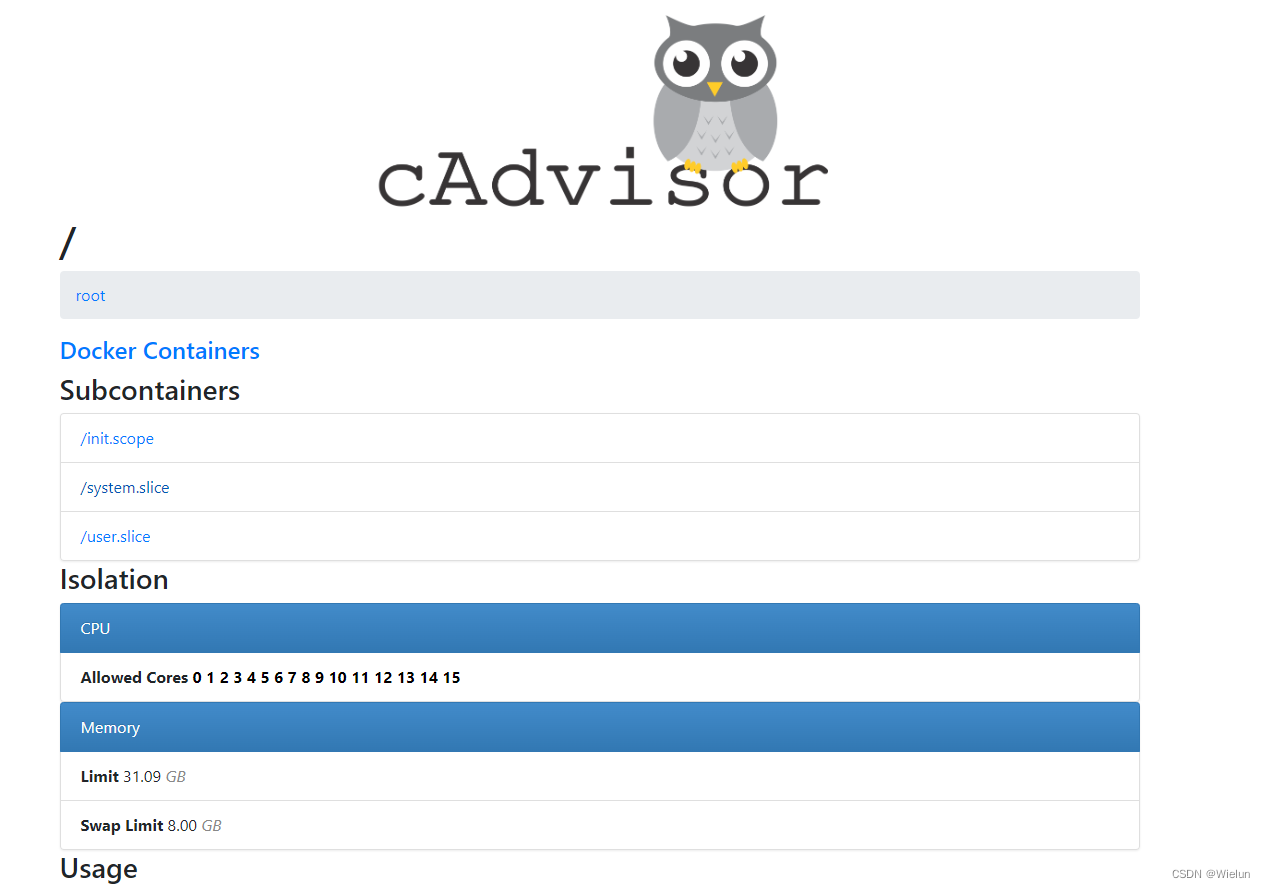
1、安装cAdvisor
cAdvisor(Container Advisor):用于收集正在运行的容器资源使用和性能信息。
项目代码:https://github.com/google/cadvisor
(1)直接下载
或者直接用google/cadvisor
docker run -d \
  --volume=/:/rootfs:ro \
  --volume=/var/run:/var/run:ro \
  --volume=/sys:/sys:ro \
  --volume=/var/lib/docker/:/var/lib/docker:ro \
  --volume=/dev/disk/:/dev/disk:ro \
  --publish=9200:8080 \
  --detach=true \
  --name=cadvisor \
  --privileged \
  --device=/dev/kmsg \
  gcr.io/cadvisor/cadvisor
(2)下载失败
<1>下载
# mkdir cadvisor && cd cadvisor
# wget  https://github.com/google/cadvisor/releases/download/v0.47.2/cadvisor-v0.47.2-linux-amd64
<2> 封装镜像
# cat Dockerfile
FROM alpine:latest
LABEL cadvisor 0.47.2
COPY ./cadvisor-v0.47.2-linux-amd64 /usr/bin/cadvisor
RUN chmod +x /usr/bin/cadvisor
ENTRYPOINT ["/usr/bin/cadvisor"]

# ls
Dockerfile  cadvisor-v0.47.2-linux-amd64

# docker build -t cadvisor:0.47.2 .
(3)浏览器访问
http://10.10.10.11:9200
2、配置prometheus.yml
[root@jenkins ~]# cat Prometheus/prometheus.yml
# my global config
global:
  scrape_interval: 15s # Set the scrape interval to every 15 seconds. Default is every 1 minute.
  evaluation_interval: 15s # Evaluate rules every 15 seconds. The default is every 1 minute.
  # scrape_timeout is set to the global default (10s).

# Alertmanager configuration
alerting:
  alertmanagers:
    - static_configs:
        - targets:
          # - alertmanager:9093

# Load rules once and periodically evaluate them according to the global 'evaluation_interval'.
rule_files:
  # - "first_rules.yml"
  # - "second_rules.yml"

# A scrape configuration containing exactly one endpoint to scrape:
# Here it's Prometheus itself.
scrape_configs:
  # The job name is added as a label `job=<job_name>` to any timeseries scraped from this config.
  - job_name: "prometheus"

    # metrics_path defaults to '/metrics'
    # scheme defaults to 'http'.

    static_configs:
      - targets: ["localhost:9090"]

  - job_name: "Linux Server"
    static_configs:
      - targets: ["10.10.10.11:9100"]

  - job_name: "Docker Server"
    static_configs:
      - targets: ["10.10.10.11:9200"]

[root@jenkins ~]# docker restart prometheus
3、Prometheus测试
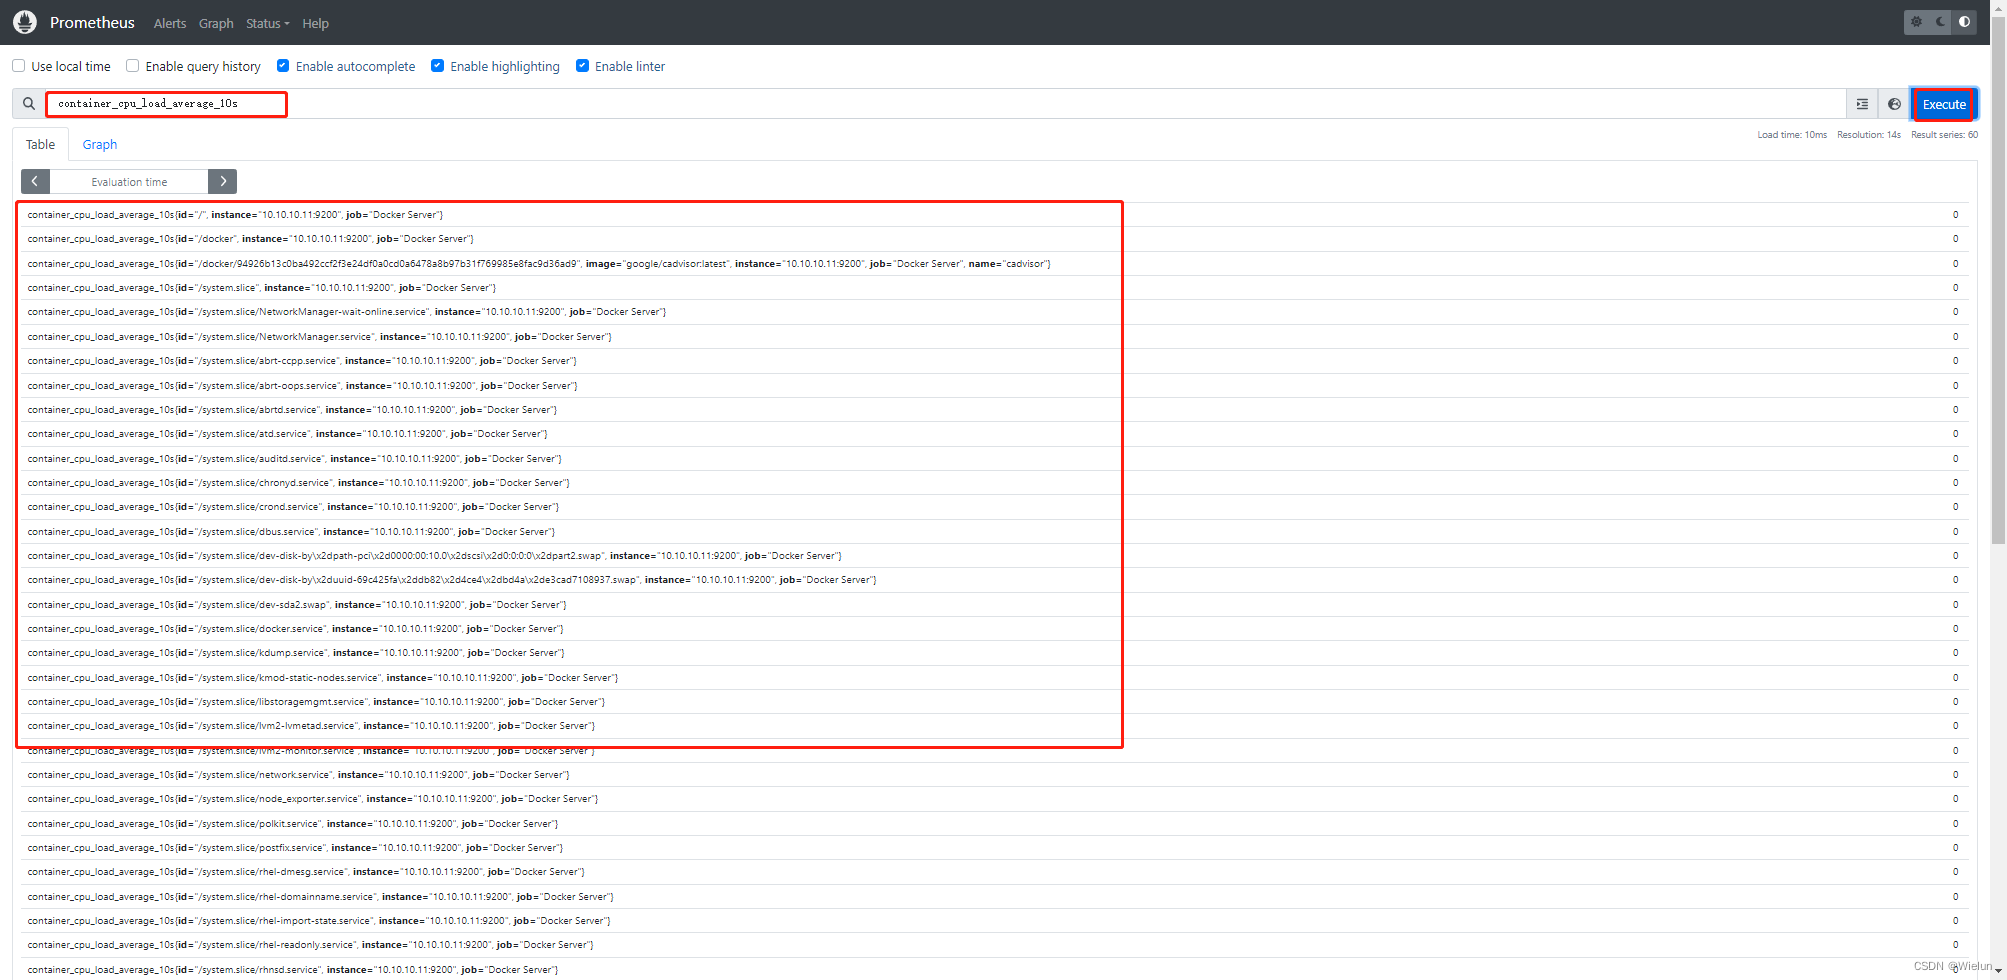
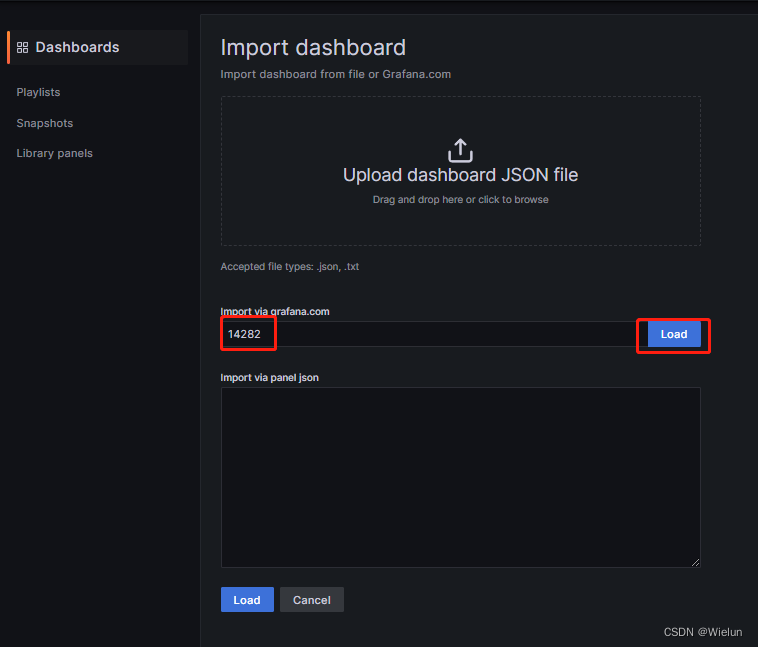
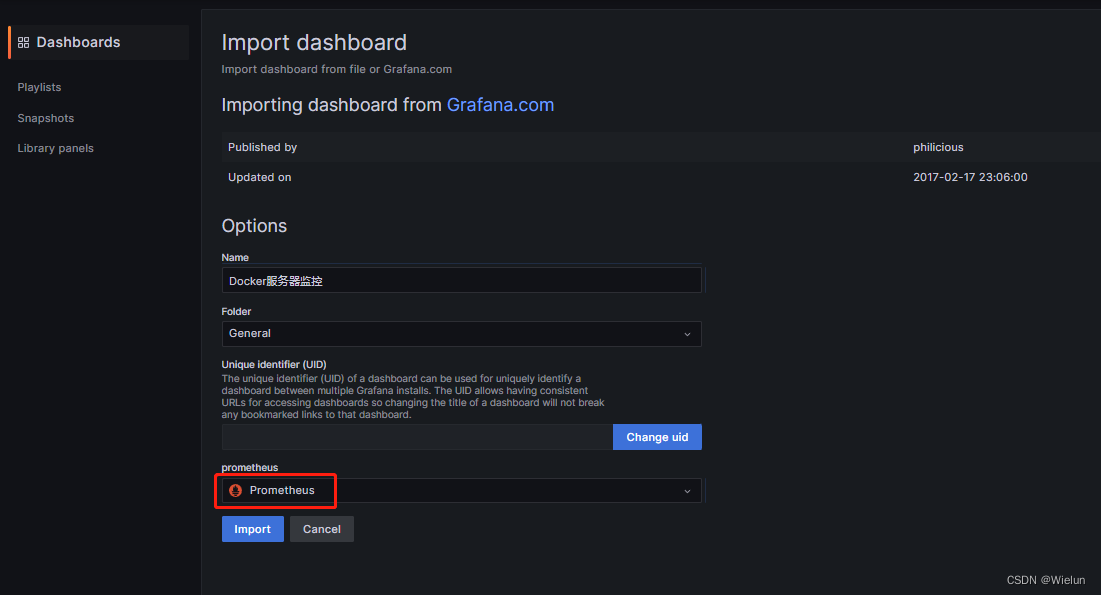
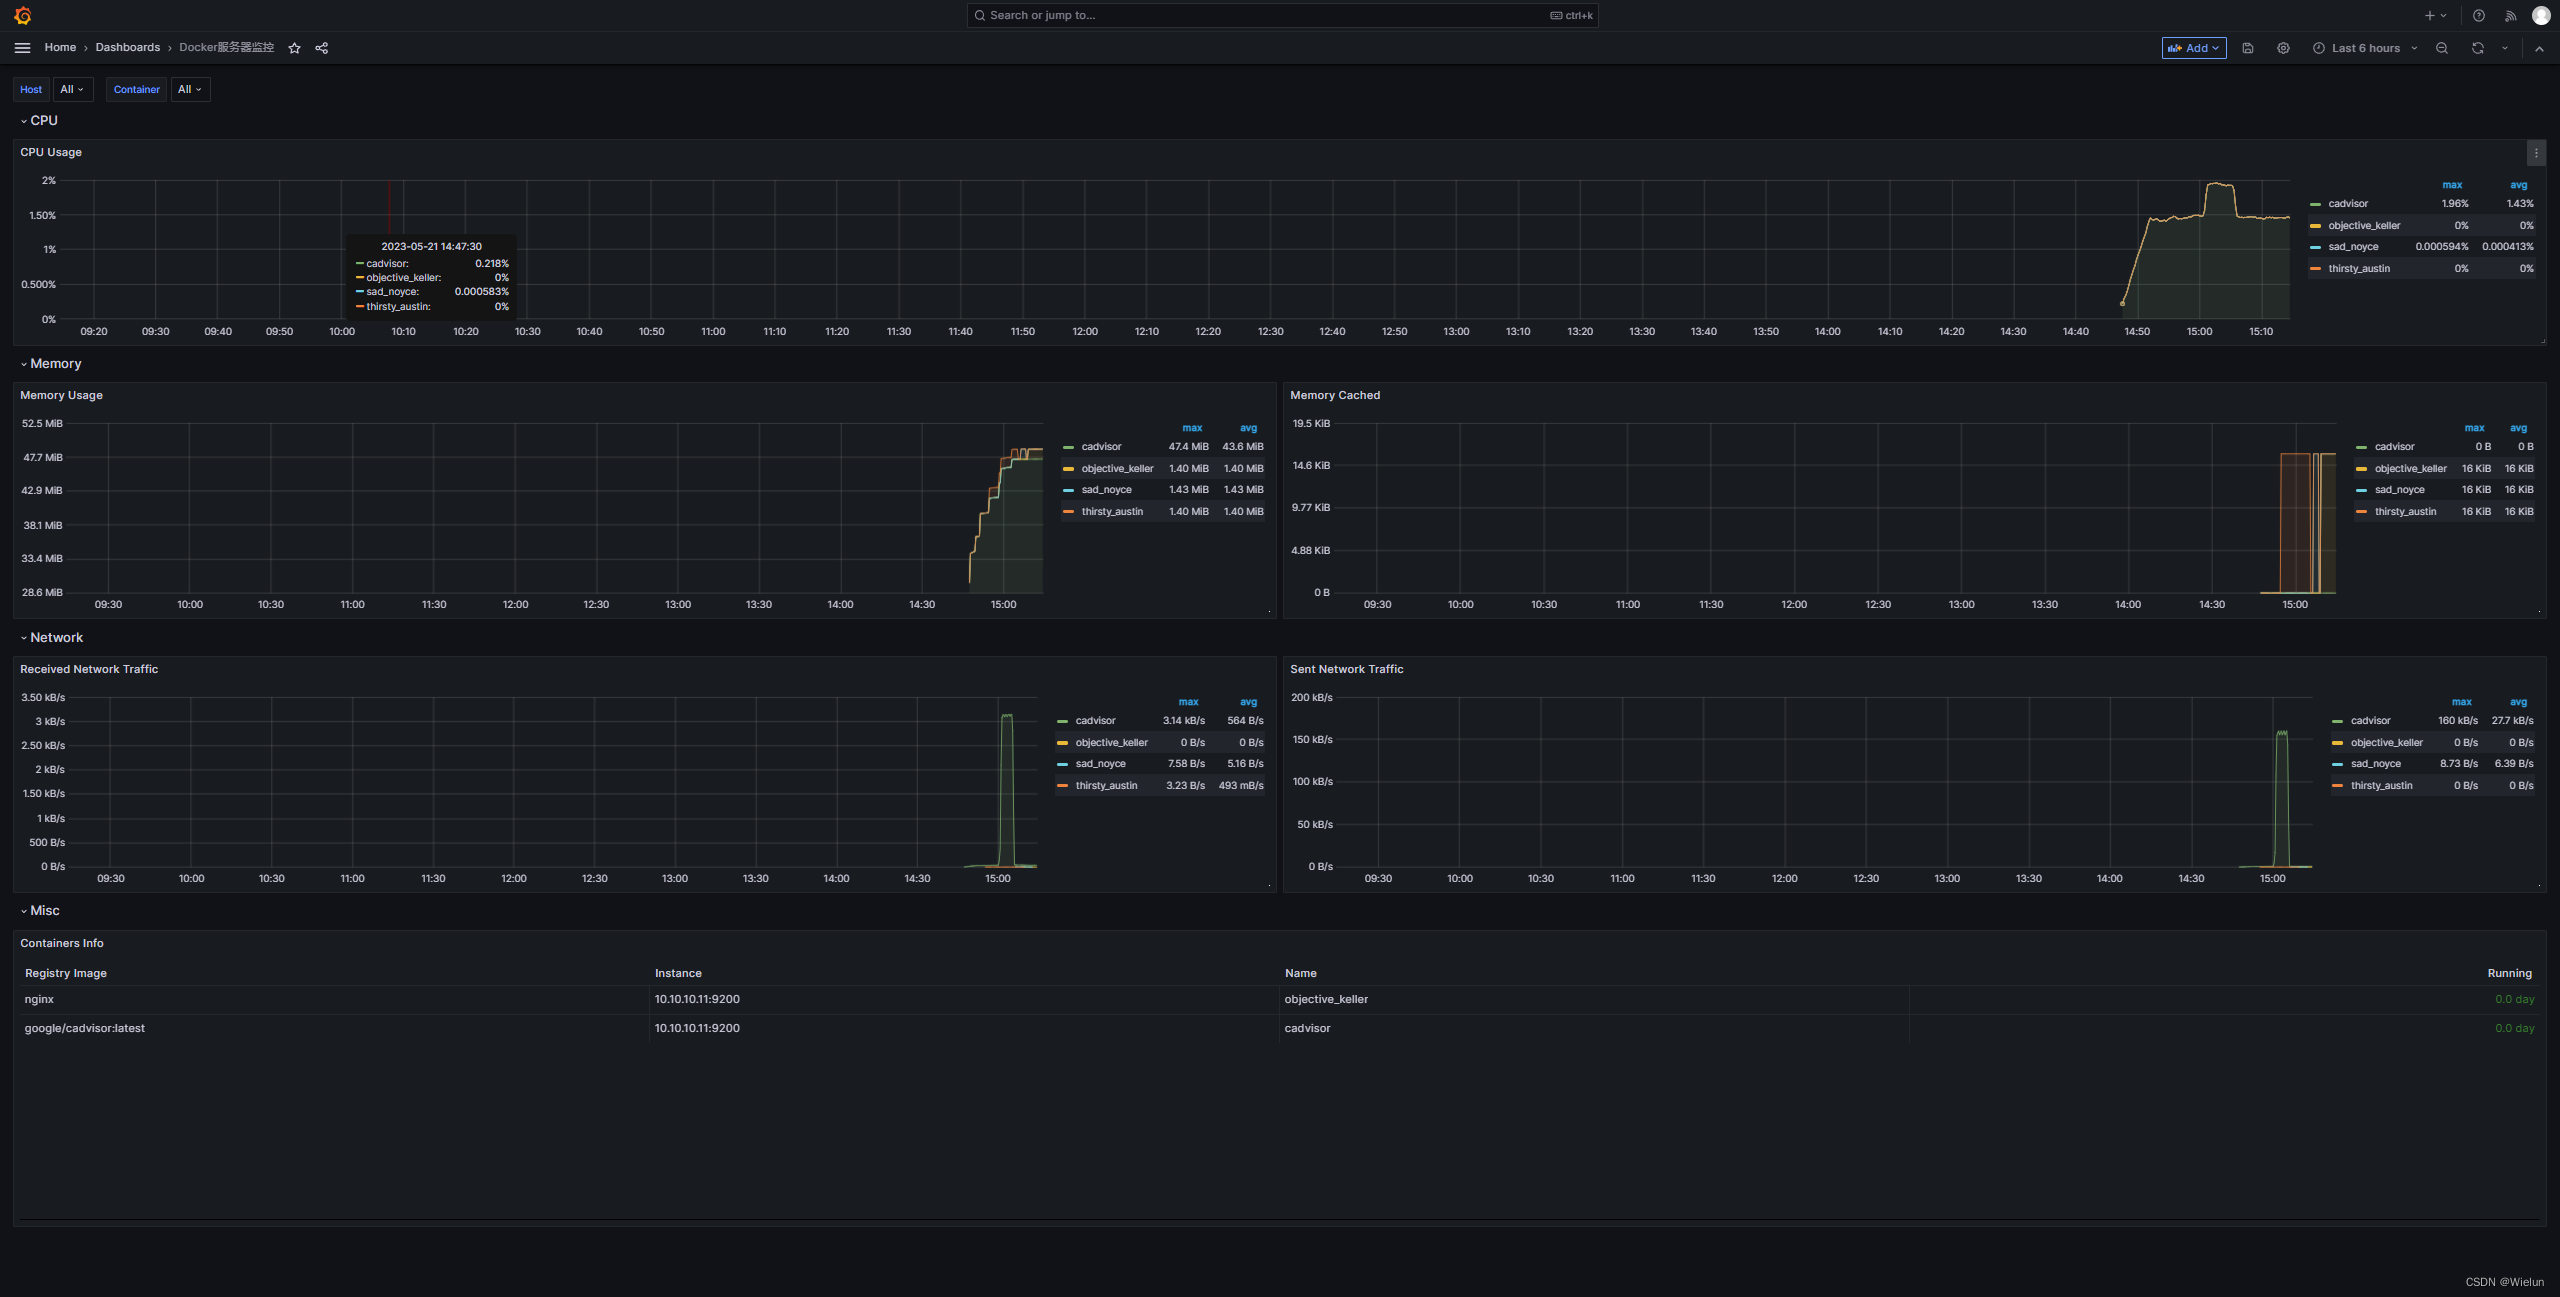
4、Grafana导入dashboard
推荐模板:11600,14282
5、docker nginx测试
[root@server1 ~]# docker run -d nginx
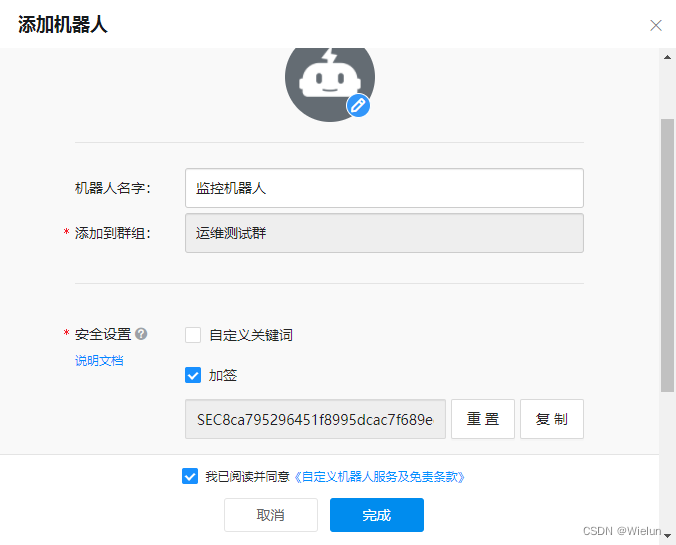
八、Alertmanager安装与使用
1、添加机器人
设置 --> 机器人 -->添加机器人

2、安装与配置
官网:https://github.com/timonwong/prometheus-webhook-dingtalk/releases
(1)配置docker-compose.yml
# cat docker-compose.yml
version : '3'
services:
  alertmanager:
    image: prom/alertmanager
    container_name: alertmanager
    hostname: alertmanager
    restart: always
    environment:
      TZ: Asia/Shanghai
    ports:
      - 9093:9093
    volumes:
      - /etc/localtime:/etc/localtime:ro
      - ./prometheus/conf/alertmanager.yml:/etc/alertmanager/alertmanager.yml
  webhook-dingtalk:
    image: timonwong/prometheus-webhook-dingtalk:v2.1.0
    container_name: webhook-dingtalk
    hostname: webhook-dingtalk
    restart: always
    environment:
      TZ: Asia/Shanghai
    ports:
      - 8060:8060
    volumes:
      - /etc/localtime:/etc/localtime:ro
      - ./prometheus/conf/dingtalk.yml:/etc/prometheus-webhook-dingtalk/config.yml
      - ./prometheus/tmpl/:/etc/prometheus-webhook-dingtalk/tmpl
(2)配置alertmanager.yml
# cat prometheus/conf/alertmanager.yml
global:
  resolve_timeout: 1m

route:
  group_by: ['alertname']
  group_wait: 30s
  group_interval: 5m
  repeat_interval: 1h
  receiver: 'webhook-dingtalk'
receivers:
  - name: 'webhook-dingtalk'
    webhook_configs:
      - url: 'http://10.10.10.10:8060/dingtalk/webhook1/send'
        send_resolved: true # 是否发送已解决的告警。如果设置为 true,则在告警解决时发送通知
inhibit_rules:
  - source_match:
      severity: 'critical'
    target_match:
      severity: 'warning'
    equal: ['alertname', 'dev', 'instance']
(3)配置dingtalk.yml
# cat prometheus/conf/dingtalk.yml   #主要修改webhook1的url和secret
## Request timeout
# timeout: 5s

## Uncomment following line in order to write template from scratch (be careful!)
#no_builtin_template: true

## Customizable templates path
templates:
  - /etc/prometheus-webhook-dingtalk/tmpl/dingtalk.tmpl

## You can also override default template using `default_message`
## The following example to use the 'legacy' template from v0.3.0
#default_message:
#  title: '{

   { template "legacy.title" . }}'
#  text: '{

   { template "legacy.content" . }}'

## Targets, previously was known as "profiles"
targets:
  webhook1:
    url: https://oapi.dingtalk.com/robot/send?access_token=f8exxxxxxxxxxxxxxxxxxxxxxxxxxxxxxxb3
    # secret for signature
    secret: SEC8xxxxxxxxxxxxxxxxxxxxxxxxxxxxxxxxxxxxxxxx5e40
  webhook2:
    url: https://oapi.dingtalk.com/robot/send?access_token=xxxxxxxxxxxx
  webhook_legacy:
    url: https://oapi.dingtalk.com/robot/send?access_token=xxxxxxxxxxxx
    # Customize template content
    message:
      # Use legacy template
      title: '{

   { template "legacy.title" . }}'
      text: '{

   { template "legacy.content" . }}'
  webhook_mention_all:
    url: https://oapi.dingtalk.com/robot/send?access_token=xxxxxxxxxxxx
    mention:
      all: true
  webhook_mention_users:
    url: https://oapi.dingtalk.com/robot/send?access_token=xxxxxxxxxxxx
    mention:
      mobiles: ['156xxxx8827', '189xxxx8325']
(4)配置告警模板
换行就是留空行就可以了
# cat prometheus/tmpl/dingtalk.tmpl
{

   { define "__subject" }}
[{

   { .Status | toUpper }}{

   { if eq .Status "firing" }}:{

   { .Alerts.Firing | len }}{

   { end }}]
{

   { end }}

{

   { define "__alert_list" }}{

   { range . }}
---
{

   { if .Labels.owner }}@{

   { .Labels.owner }}{

   { end }}
**告警状态**:{

   { .Status }}

**告警级别**:{

   { .Labels.severity }}

**告警类型**:{

   { .Labels.alertname }}

**告警主机**:{

   { .Labels.instance }}

**告警详情**:{

   { .Annotations.description }}

**告警时间**:{

   { (.StartsAt.Add 28800e9).Format "2006-01-02 15:04:05" }}
{

   { end }}{

   { end }}

{

   { define "__resolved_list" }}{

   { range . }}
---
{

   { if .Labels.owner }}@{

   { .Labels.owner }}{

   { end }}
**告警状态**:{

   { .Status }}

**告警级别**:{

   { .Labels.severity }}

**告警类型**:{

   { .Labels.alertname }}

**告警主机**:{

   { .Labels.instance }}

**告警详情**:{

   { .Annotations.description }}

**告警时间**:{

   { (.StartsAt.Add 28800e9).Format "2006-01-02 15:04:05" }}

**恢复时间**:{

   { (.EndsAt.Add 28800e9).Format "2006-01-02 15:04:05" }}
{

   { end }}{

   { end }}

{

   { define "default.title" }}
{

   { template "__subject" . }}
{

   { end }}

{

   { define "default.content" }}
{

   { if gt (len .Alerts.Firing) 0 }}
**Prometheus故障告警**
{

   { template "__alert_list" .Alerts.Firing }}
---
{

   { end }}

{

   { if gt (len .Alerts.Resolved) 0 }}
**Prometheus故障恢复**
{

   { template "__resolved_list" .Alerts.Resolved }}
{

   { end }}
{

   { end }}

{

   { define "ding.link.title" }}{

   { template "default.title" . }}{

   { end }}
{

   { define "ding.link.content" }}{

   { template "default.content" . }}{

   { end }}
{

   { template "default.title" . }}
{

   { template "default.content" . }}
(5)启动
# docker-compose up -d
(6)检查配置文件
# docker exec -it alertmanager amtool check-config /etc/alertmanager/alertmanager.yml
Checking '/etc/alertmanager/alertmanager.yml'  SUCCESS
Found:
 - global config
 - route
 - 1 inhibit rules
 - 1 receivers
 - 0 templates
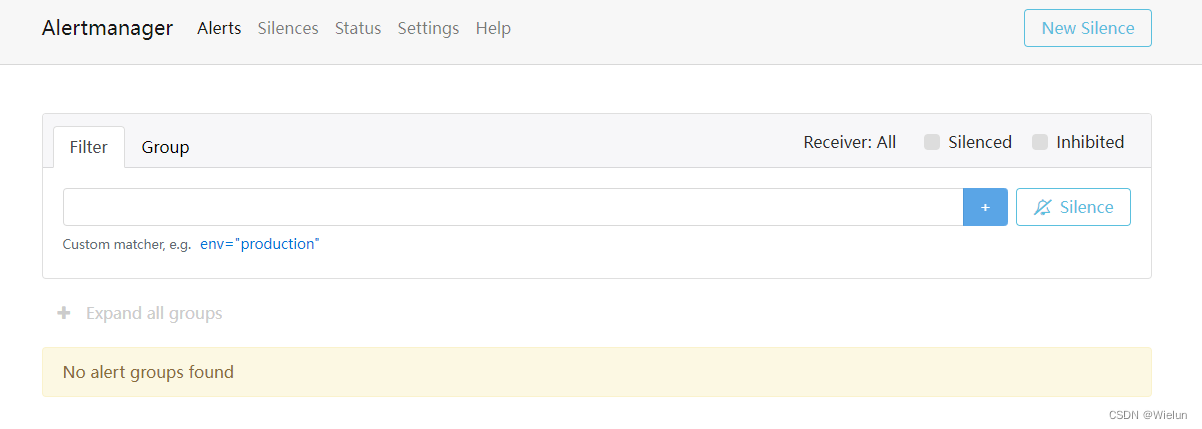
(7)浏览器访问
http://10.10.10.10:9093/
3、配置Prometheus
(1)配置prometheus.yml
[root@jenkins ~]# cat Prometheus/prometheus.yml
# my global config
global:
  scrape_interval: 15s # Set the scrape interval to every 15 seconds. Default is every 1 minute.
  evaluation_interval: 15s # Evaluate rules every 15 seconds. The default is every 1 minute.
  # scrape_timeout is set to the global default (10s).

# Alertmanager configuration
alerting:
  alertmanagers:
    - static_configs:
        - targets:
          - 10.10.10.10:9093

# Load rules once and periodically evaluate them according to the global 'evaluation_interval'.
rule_files:
  - "rules/*.yml"
  # - "first_rules.yml"
  # - "second_rules.yml"

# A scrape configuration containing exactly one endpoint to scrape:
# Here it's Prometheus itself.
scrape_configs:
  # The job name is added as a label `job=<job_name>` to any timeseries scraped from this config.
  - job_name: "prometheus"

    # metrics_path defaults to '/metrics'
    # scheme defaults to 'http'.

    static_configs:
      - targets: ["localhost:9090"]
(2)配置告警规则
告警规则:https://prometheus.io/docs/prometheus/latest/configuration/alerting_rules/
# mkdir -p /root/Prometheus/rules
# cat /root/Prometheus/rules/node_exporter_rules.yml
# Linux服务器资源告警策略
groups:
- name: Linux服务器资源监控
  rules:
  - alert: 内存使用率过高
    expr: (node_memory_Buffers_bytes+node_memory_Cached_bytes+node_memory_MemFree_bytes)/node_memory_MemTotal_bytes*100 > 90
    for: 5m  # 告警持续时间,超过这个时间才会发送给alertmanager
    labels:
      severity: 严重告警
    annotations:
      summary: "{

   { $labels.instance }} 内存使用率过高,请尽快处理!"
      description: "{

   { $labels.instance }}内存使用率超过90%,当前使用率{

   { $value }}%."

  - alert: 服务宕机
    expr: up == 0
    for: 3m
    labels:
      severity: 严重告警
    annotations:
      summary: "{

   {$labels.instance}} 服务宕机,请尽快处理!"
      description: "{

   {$labels.instance}} 服务延时超过3分钟,当前状态{

   { $value }}. "

  - alert: CPU高负荷
    expr: 100 - (avg by (instance,job)(irate(node_cpu_seconds_total{mode="idle"}[5m])) * 100) > 90
    for: 5m
    labels:
      severity: 严重告警
    annotations:
      summary: "{

   {$labels.instance}} CPU使用率过高,请尽快处理!"
      description: "{

   {$labels.instance}} CPU使用大于90%,当前使用率{

   { $value }}%. "

  - alert: 磁盘IO性能
    expr: avg(irate(node_disk_io_time_seconds_total[1m])) by(instance,job)* 100 > 90
    for: 5m
    labels:
      severity: 严重告警
    annotations:
      summary: "{

   {$labels.instance}} 流入磁盘IO使用率过高,请尽快处理!"
      description: "{

   {$labels.instance}} 流入磁盘IO大于90%,当前使用率{

   { $value }}%."


  - alert: 网络流入
    expr: ((sum(rate (node_network_receive_bytes_total{device!~'tap.*|veth.*|br.*|docker.*|virbr*|lo*'}[5m])) by (instance,job)) / 100) > 102400
    for: 5m
    labels:
      severity: 严重告警
    annotations:
      summary: "{

   {$labels.instance}} 流入网络带宽过高,请尽快处理!"
      description: "{

   {$labels.instance}} 流入网络带宽持续5分钟高于100M. RX带宽使用量{

   {$value}}."

  - alert: 网络流出
    expr: ((sum(rate (node_network_transmit_bytes_total{device!~'tap.*|veth.*|br.*|docker.*|virbr*|lo*'}[5m])) by (instance,job)) / 100) > 102400
    for: 5m
    labels:
      severity: 严重告警
    annotations:
      summary: "{

   {$labels.instance}} 流出网络带宽过高,请尽快处理!"
      description: "{

   {$labels.instance}} 流出网络带宽持续5分钟高于100M. RX带宽使用量{$value}}."

  - alert: TCP连接数
    expr: node_netstat_Tcp_CurrEstab > 10000
    for: 2m
    labels:
      severity: 严重告警
    annotations:
      summary: " TCP_ESTABLISHED过高!"
      description: "{

   {$labels.instance}} TCP_ESTABLISHED大于100%,当前使用率{

   { $value }}%."

  - alert: 磁盘容量
    expr: 100-(node_filesystem_free_bytes{fstype=~"ext4|xfs"}/node_filesystem_size_bytes {fstype=~"ext4|xfs"}*100) > 90
    for: 1m
    labels:
      severity: 严重告警
    annotations:
      summary: "{

   {$labels.mountpoint}} 磁盘分区使用率过高,请尽快处理!"
      description: "{

   {$labels.instance}} 磁盘分区使用大于90%,当前使用率{

   { $value }}%."
# cat /root/Prometheus/rules/windows_exporter_rules.yml
groups:
- name: Windows服务器资源监控
  rules:
      - alert: 内存使用率过高
        expr: 100-(windows_os_physical_memory_free_bytes/windows_cs_physical_memory_bytes)*100 > 90
        for: 5m
        labels:
          severity: 严重告警
        annotations:
          summary: "{

   { $labels.instance }} 内存使用率过高,请尽快处理!"
          description: "{

   { $labels.instance }}内存使用率超过90%,当前使用率{

   { $value }}%."
      - alert: CPU高负荷
        expr: 100 - (avg by (instance,region) (irate(windows_cpu_time_total{mode="idle"}[2m])) * 100) > 90
        for: 5m
        labels:
          severity: 严重告警
        annotations:
          summary: "{

   {$labels.instance}} CPU使用率过高,请尽快处理!"
          description: "{

   {$labels.instance}} CPU使用大于90%,当前使用率{

   { $value }}%."
      - alert: 磁盘容量
        expr: 100-(windows_logical_disk_free_bytes/windows_logical_disk_size_bytes)*100 > 90
        for: 1m
        labels:
          severity: 严重告警
        annotations:
          summary: "{

   {$labels.volume}} 磁盘分区使用率过高,请尽快处理!"
          description: "{

   {$labels.instance}} 磁盘分区使用大于90%,当前使用率{

   { $value }}%."
(3)重启prometheus
# docker rm -f prometheus
# docker run -d \
--name=prometheus \
-v /root/Prometheus/prometheus.yml:/etc/prometheus/prometheus.yml \
-v /root/Prometheus/data:/prometheus \
-v /root/Prometheus/rules:/etc/prometheus/rules
-p 9090:9090 \
prom/prometheus
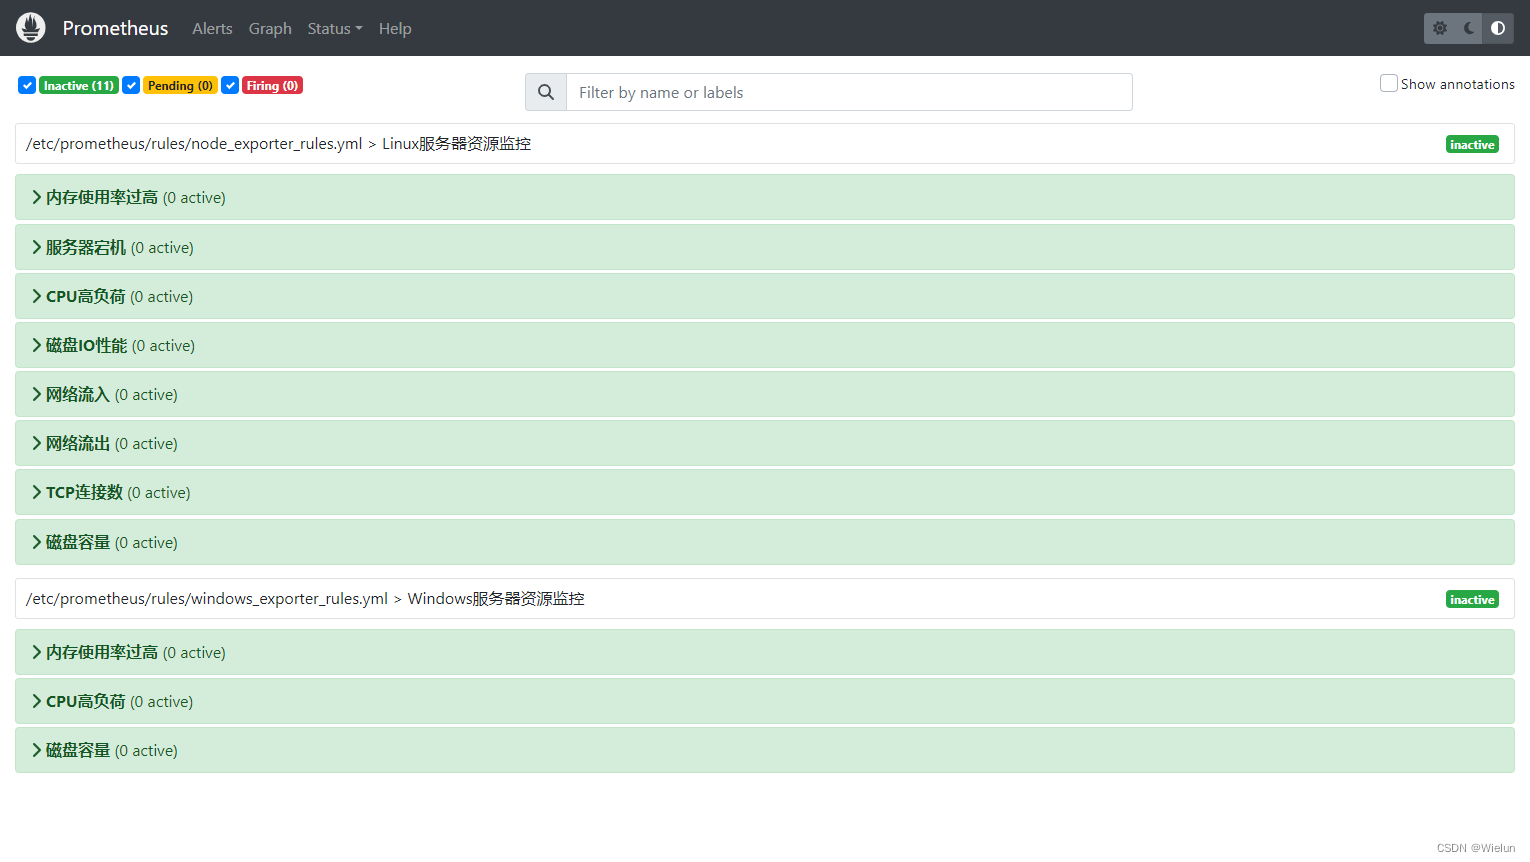
4、查看结果
(1)Prometheus
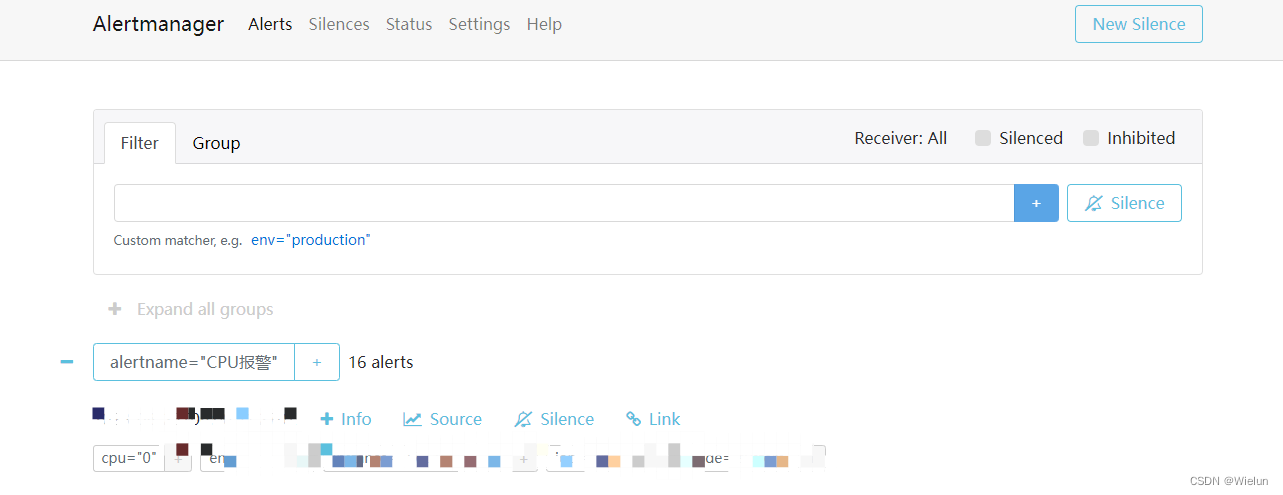
(2)Alertmanager
(3)钉钉告警

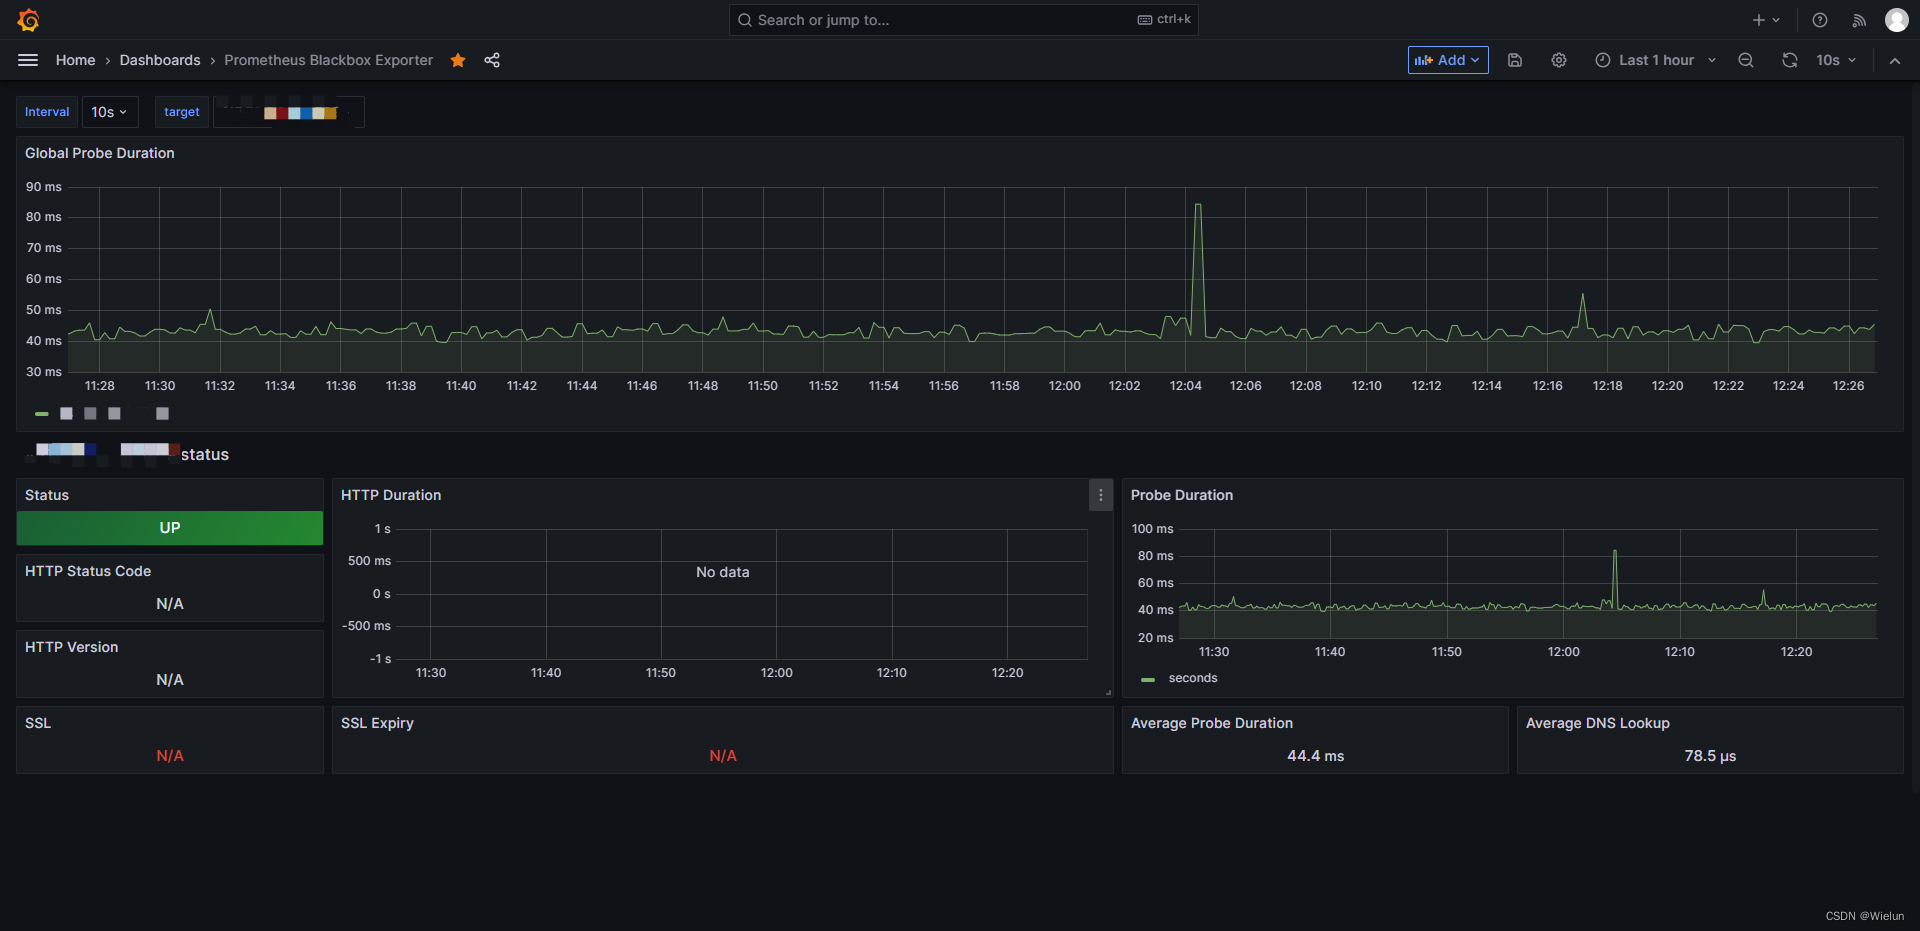
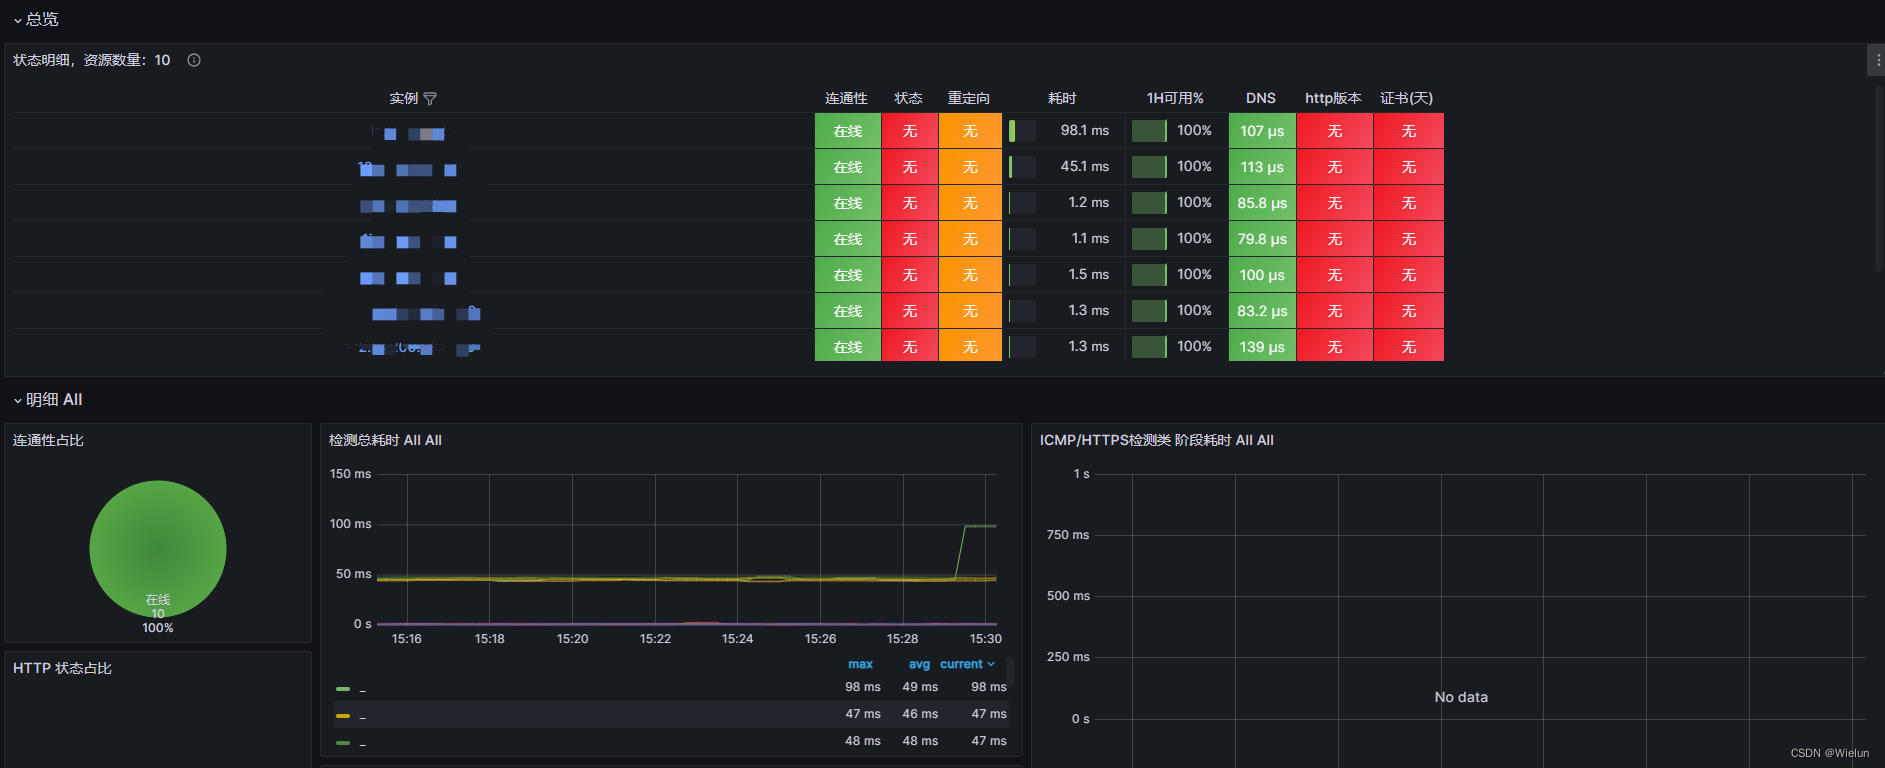
九、Blackbox-Exporter使用
1、简介
blackbox_exporter是Prometheus拿来对 http/https、tcp、icmp、dns进行的黑盒监控工具
2、安装blackbox-exporter
https://github.com/prometheus/blackbox_exporter
https://quay.io/repository/prometheus/blackbox-exporter
(1)配置blackbox.yml:
# cat prometheus/conf/blackbox.yml
modules:
  http_2xx:
    prober: http
    timeout: 20s
    http:
      preferred_ip_protocol: "ip4"
  http_post_2xx_query:
    prober: http
    timeout: 20s
    http:
      preferred_ip_protocol: "ip4" ##使用ipv4
      method: POST
      headers:
        Content-Type: application/json ##header头
      body: '{"hmac":"","params":{"publicFundsKeyWords":"xxx"}}' ##传参
  tls_connect_tls:
    prober: tcp
    timeout: 5s
    tcp:
      tls: true
  tcp_connect:
    prober: tcp
    timeout: 5s

  pop3s_banner:
    prober: tcp
    tcp:
      query_response:
      - expect: "^+OK"
      tls: true
      tls_config:
        insecure_skip_verify: false
  ssh_banner:
    prober: tcp
    tcp:
      query_response:
      - expect: "^SSH-2.0-"
  irc_banner:
    prober: tcp
    tcp:
      query_response:
      - send: "NICK prober"
      - send: "USER prober prober prober :prober"
      - expect: "PING :([^ ]+)"
        send: "PONG ${1}"
      - expect: "^:[^ ]+ 001"
  icmp:
    prober: icmp
    timeout: 20s
(2)配置docker-compose.yml:
# cat docker-compose.yml
version : '3'
services:
  blackbox-exporter:
    image: prom/blackbox-exporter
    container_name: blackbox-exporter
    hostname: blackbox-exporter
    restart: always
    environment:
      TZ: Asia/Shanghai
    ports:
      - 9115:9115
    volumes:
      - /etc/localtime:/etc/localtime:ro
      - ./prometheus/conf/blackbox.yml:/etc/blackbox_exporter/config.yml
(3)启动
# docker-compose up -d
3、配置Prometheus
(1)配置prometheus.yml
  - job_name: blackbox # To get metrics about the exporter itself
    metrics_path: /metrics
    static_configs:
      - targets:
        - 10.10.10.10:9115

  - job_name: "node_status"
    scrape_interval: 1m
    metrics_path: '/probe'
    params:
      module: [icmp]
    static_configs:
      - targets: ["10.10.10.11", "10.10.10.12"]
    relabel_configs:
      - source_labels: [__address__]
        target_label: __param_target
      - source_labels: [__param_target]
        target_label: instance
      - target_label: __address__
        replacement: 10.10.10.10:9115

  - job_name: "port_status"
    metrics_path: '/probe'
    params:
      module: [tcp_connect]
    static_configs:
      - targets: [10.10.10.11:8080]
    relabel_configs:
      - source_labels: [ __address__ ]
        target_label: __param_target
      - source_labels: [__param_target]
        target_label: instance
      - target_label: __address__
        replacement: 10.10.10.10:9115

  - job_name: "web_status"
    metrics_path: '/probe'
    params:
      module: [http_2xx]
    static_configs:
      - targets: [http://10.10.10.11:8080]
    relabel_configs:
      - source_labels: [ __address__ ]
        target_label: __param_target
      - source_labels: [__param_target]
        target_label: instance
      - target_label: __address__
        replacement: 10.10.10.10:9115
其中最后的relabel_configs的含义是,把 “10.10.10.11/probe?module=icmp” 转化为 “http://10.10.10.10:9115/probe?target=10.10.10.11&module=icmp”。同时为每个指标新增一个instance的label,值为10.10.10.11
(2)配置rules
# cat blackbox_exporter_rules.yml
groups:
- name: blackbox_network_stats
  rules:
  - alert: 'url服务探测失败'
    expr: probe_success == 0
    for: 60s
    labels:
      severity: 严重告警
    annotations:
      summary: "{

   { $labels.instance }}探测失败"
      description: "url探测失败,请检查业务是否正常!!!"
(3)重启Prometheus测试
# curl http://10.10.10.10:9115/probe?target=www.baidu.com&module=http_2xx
...
# HELP probe_dns_lookup_time_seconds Returns the time taken for probe dns lookup in seconds
# TYPE probe_dns_lookup_time_seconds gauge
probe_dns_lookup_time_seconds 0.009497839
# HELP probe_duration_seconds Returns how long the probe took to complete in seconds
# TYPE probe_duration_seconds gauge
probe_duration_seconds 0.173056361
# HELP probe_failed_due_to_regex Indicates if probe failed due to regex
# TYPE probe_failed_due_to_regex gauge
probe_failed_due_to_regex 0
# HELP probe_http_content_length Length of http content response
# TYPE probe_http_content_length gauge
probe_http_content_length 386594
# HELP probe_http_duration_seconds Duration of http request by phase, summed over all redirects
# TYPE probe_http_duration_seconds gauge
probe_http_duration_seconds{phase="connect"} 0.029809217
probe_http_duration_seconds{phase="processing"} 0.032080808
probe_http_duration_seconds{phase="resolve"} 0.009497839
probe_http_duration_seconds{phase="tls"} 0
probe_http_duration_seconds{phase="transfer"} 0.101232446
# HELP probe_http_redirects The number of redirects
# TYPE probe_http_redirects gauge
probe_http_redirects 0
# HELP probe_http_ssl Indicates if SSL was used for the final redirect
# TYPE probe_http_ssl gauge
probe_http_ssl 0
# HELP probe_http_status_code Response HTTP status code
# TYPE probe_http_status_code gauge
probe_http_status_code 200
# HELP probe_http_uncompressed_body_length Length of uncompressed response body
# TYPE probe_http_uncompressed_body_length gauge
probe_http_uncompressed_body_length 386594
# HELP probe_http_version Returns the version of HTTP of the probe response
# TYPE probe_http_version gauge
probe_http_version 1.1
# HELP probe_ip_addr_hash Specifies the hash of IP address. It's useful to detect if the IP address changes.
# TYPE probe_ip_addr_hash gauge
probe_ip_addr_hash 1.648104912e+09
# HELP probe_ip_protocol Specifies whether probe ip protocol is IP4 or IP6
# TYPE probe_ip_protocol gauge
probe_ip_protocol 4
# HELP probe_success Displays whether or not the probe was a success
# TYPE probe_success gauge
probe_success 1
4、配置Grafana
推荐:7587,9965