基于高德地图实现vue3的移动端物流路线相关功能
自我记录
一.参考文档
高德地图开放平台: https://lbs.amap.com/
Web开发-JSAPI文档: https://lbs.amap.com/api/javascript-api-v2/summary/
参考手册: https://lbs.amap.com/api/javascript-api-v2/documentation
步骤:
准备工作: https://lbs.amap.com/api/javascript-api-v2/prerequisites
vue中使用: https://lbs.amap.com/api/javascript-api-v2/guide/abc/amap-vue
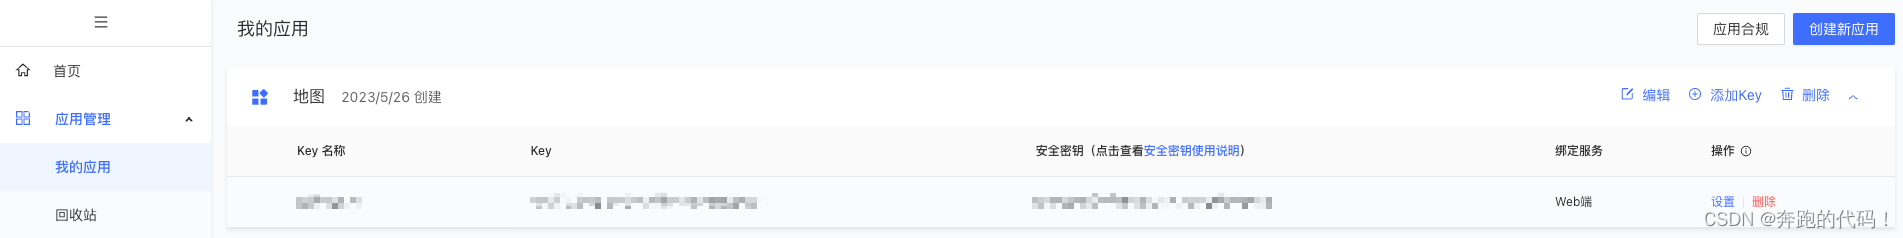
key 和 安全密钥jscode 已经有了 开始下一步
二. 安装&简单使用
1.安装
pnpm add @amap/amap-jsapi-loader
2.配置
<script setup lang="ts">
// 高德 v2.0需要配置安全密钥jscode
//(自2021年12月02日升级,升级之后所申请的 key 必须配备安全密钥 jscode 一起使用)
window._AMapSecurityConfig = {


  securityJsCode: '5fxxxxxxxxxxxxxxx3' // 安全密钥jscode
}
</script>
TS项目汇报错 window :类型“Window & typeof globalThis”上不存在属性“_AMapSecurityConfig”。
解决方案:
在src/types/global.d.ts文件添加扩展属性代码
// 给全局对象 Window 扩展一个属性 _AMapSecurityConfig
interface Window {


  _AMapSecurityConfig: {


    securityJsCode: string
  }
}
3.导入刚刚安装的包AMapLoader 并使用
<script setup lang="ts">
// 导入包
import AMapLoader from '@amap/amap-jsapi-loader'
// 高德 v2.0需要配置安全密钥jscode
//(自2021年12月02日升级,升级之后所申请的 key 必须配备安全密钥 jscode 一起使用)
window._AMapSecurityConfig = {
securityJsCode: '5fxxxxxxxxxxxxxxx3' // 安全密钥jscode
}
onMounted(() => {
// 调用地图
initMap()
})
const initMap = () => {
AMapLoader.load({
key: '79xxxxxxxxxxxx0',// 申请好的Web端开发者Key,首次调用 load 时必填
version: '2.0',// 指定要加载的 JSAPI 的版本,缺省时默认为 1.4.15
// plugins: [''] // 需要使用的的插件列表,如比例尺'AMap.Scale'等
}).then((AMap) => {
// 使用 Amap 初始化地图 .then 异步了 所以直接就能拿到 #map容器了
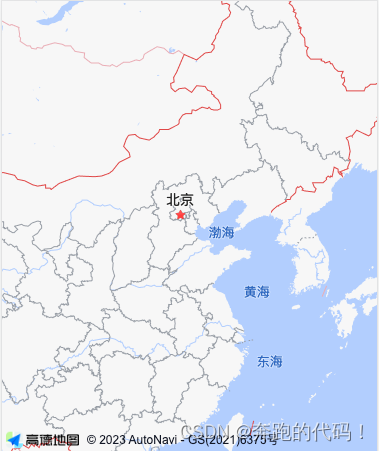
const map = new AMap.Map('map', {
// 设置地图容器id
// viewMode: '3D', //是否为3D地图模式
zoom: 4 //初始化地图级别 一般12
// center: [105.602725, 37.076636] //初始化地图中心点位置 不设置默认是北京
// mapStyle: 'amap://styles/whitesmoke' // 设置地图样式 远山黛
})
**在这预留下面的配置代码**
})
}
</script>
<template>
<div id="map">
</div>
</template>
<style lang="scss" scoped>
#map {
height: 450px;
background-color: #F6F7F9;
overflow: hidden;
}
三.我使用的一些插件配置
1.加载路线规划插件
路线规划: https://lbs.amap.com/api/javascript-api-v2/guide/services/navigation
Driving配置项参考地址: Driving配置项参考地址
// 加载路线规划插件
AMap.plugin('AMap.Driving', function() {


  // 初始化路线规划对象
  var driving = new AMap.Driving({


    // 驾车路线规划策略,AMap.DrivingPolicy.LEAST_TIME是最快捷模式
 	// policy: AMap.DrivingPolicy.LEAST_TIME,
    map: map, //AMap.Map对象, 展现结果的地图实例。当指定此参数后,搜索结果的标注、线路等均会自动添加到此地图上。可选 ps:此处必须有 不然不知道在哪个地图上
    showTraffic: false, //设置是否显示实时路况信息,默认设置为true。 显示绿色代表畅通,黄色代表轻微拥堵,红色代表比较拥堵,灰色表示无路况信息。
    hideMarkers: true //设置隐藏路径规划的起始点图标 设置为true
  })

   let startLngLat = [117.2147, 39.11712] // 起始的经纬度
   let endLngLat = [126.95717, 45.54774] // 结束的经纬度

  // startLngLat:起始坐标
  // endLngLat:终点坐标
  // {waypoints:[]}: 路途中的经纬度坐标
  // function (status, result){} 规划好的回调函数
  driving.search(startLngLat, endLngLat,{


            waypoints: [
              [116.23128, 40.22077], // 北京
              [119.48458, 39.83507], // 秦皇岛
              [121.5255, 38.95223], // 大连
              [123.46987, 41.80515], // 沈阳
              [125.28845, 43.83327] //长春
            ]
          }, function (status: string, result: object) {


    // 未出错时,result即是对应的路线规划方案
  })
})
waypoints 为空的时候 默认走的最便捷路线
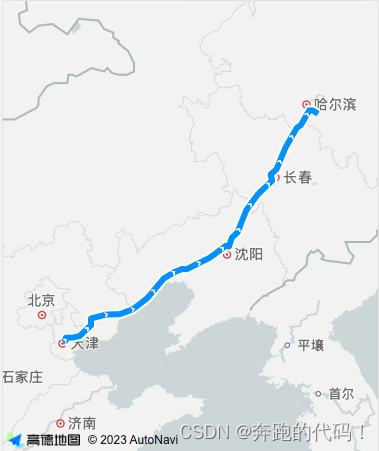
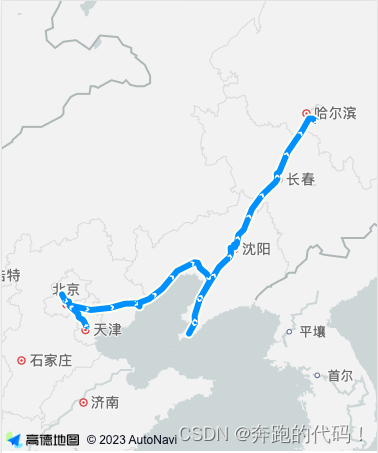
waypoints 自定义坐标之后 按照定一个路线显示
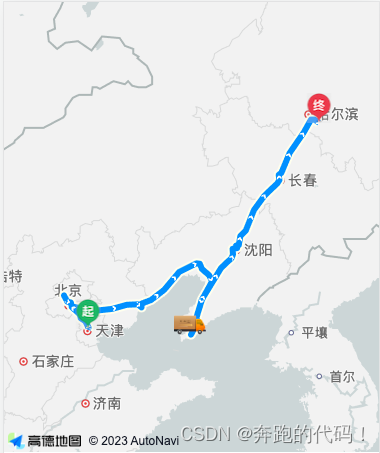
2.标点规划
创建点覆盖物 marker https://lbs.amap.com/demo/jsapi-v2/example/common/add-several-overlay
或者旧版本marker: https://developer.amap.com/api/jsapi-v2/guide/map/map-layer
自定义图标Icon: https://lbs.amap.com/demo/jsapi-v2/example/marker/custom-icon
// 加载路线规划插件
AMap.plugin('AMap.Driving', function () {
// 初始化路线规划对象
// https://lbs.amap.com/api/javascript-api-v2/documentation#driving
const driving = new AMap.Driving({
// 驾车路线规划策略,AMap.DrivingPolicy.LEAST_TIME是最快捷模式
// policy: AMap.DrivingPolicy.LEAST_TIME,
map: map, //AMap.Map对象, 展现结果的地图实例。当指定此参数后,搜索结果的标注、线路等均会自动添加到此地图上。可选 ps:此处必须有 不然不知道在哪个地图上
showTraffic: false, // 设置是否显示实时路况信息,默认设置为true。 显示绿色代表畅通,黄色代表轻微拥堵,红色代表比较拥堵,灰色表示无路况信息。
hideMarkers: true //设置隐藏路径规划的起始点图标 设置为true
})
// 创建标记函数
const getMarker = (
point: number[],
image: string,
width = 25,
height = 30
) => {
const icon = new AMap.Icon({
size: new AMap.Size(width, height),
image,
imageSize: new AMap.Size(width, height)
})
const marker = new AMap.Marker({
position: point,
icon: icon,
offset: new AMap.Pixel(-width / 2, -height) // AMap.Pixel 像素坐标,确定地图上的一个像素点。
})
return marker
}
let startLngLat = [117.2147, 39.11712] // 起始的经纬度
// 使用标点
const startMarker = getMarker(startLngLat, startImg)
map.add(startMarker)
let endLngLat = [126.95717, 45.54774] // 结束的经纬度
// 使用标点
const endMarker = getMarker(endLngLat, endImg)
map.add(endMarker)
// startLngLat:起始坐标
// endLngLat:终点坐标
// {waypoints:[]}: 路途中的经纬度坐标
// function (status, result){} 规划好的回调函数
driving.search(
startLngLat,
endLngLat,
{
waypoints: [
[116.23128, 40.22077], // 北京
[119.48458, 39.83507], // 秦皇岛
[121.5255, 38.95223], // 大连
[123.46987, 41.80515], // 沈阳
[125.28845, 43.83327] //长春
]
},
function (status: string, result: object) {
// 未出错时,result即是对应的路线规划方案
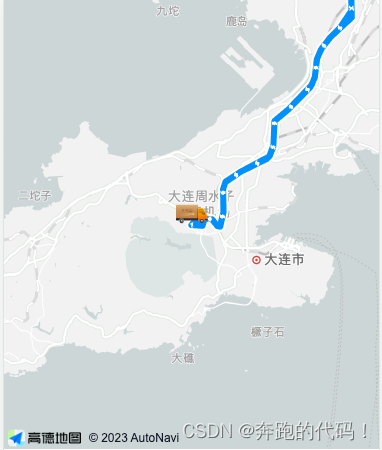
// 运输位置 使用标点
const curr = [121.5255, 38.95223]
const currMarker = getMarker(curr, carImg, 33, 20)
map.add(currMarker)
// 3s后定位当中间进行缩放
setTimeout(() => {
map.setFitView(
[currMarker] // 覆盖物数组
// false, // 动画过渡到制定位置
// [60, 60, 60, 60], // 周围边距,上、下、左、右
// 10 // 最大 zoom 级别
)
map.setZoom(10)
}, 3000)
}
)
})
全部代码
<script setup lang="ts">
import AMapLoader from '@amap/amap-jsapi-loader'
import startImg from '@/assets/start.png'
import endImg from '@/assets/end.png'
import carImg from '@/assets/car.png'
onMounted(() => {
// 调用地图
initMap()
})
// 高德 v2.0需要配置安全密钥jscode (自2021年12月02日升级,升级之后所申请的 key 必须配备安全密钥 jscode 一起使用)
window._AMapSecurityConfig = {
securityJsCode: '5fxxxxxxxxxxx03'
}
// 地图
const initMap = () => {
AMapLoader.load({
key: '7xxxxxxxxx0', // 申请好的Web端开发者Key,首次调用 load 时必填
version: '2.0' // 指定要加载的 JSAPI 的版本,缺省时默认为 1.4.15
// plugins: [''] // 需要使用的的插件列表,如比例尺'AMap.Scale'等
})
.then((AMap) => {
// .then 异步了 所以直接就能拿到 #map容器了
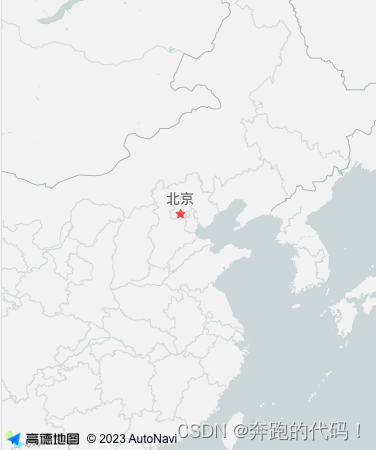
const map = new AMap.Map('map', {
//设置地图容器id
// viewMode: '3D', //是否为3D地图模式
zoom: 12, //初始化地图级别
// center: [105.602725, 37.076636] //初始化地图中心点位置 不设置默认是北京
mapStyle: 'amap://styles/whitesmoke' // 设置地图样式 远山黛
})
// 加载路线规划插件
AMap.plugin('AMap.Driving', function () {
// 初始化路线规划对象
// https://lbs.amap.com/api/javascript-api-v2/documentation#driving
const driving = new AMap.Driving({
// 驾车路线规划策略,AMap.DrivingPolicy.LEAST_TIME是最快捷模式
// policy: AMap.DrivingPolicy.LEAST_TIME,
map: map, //AMap.Map对象, 展现结果的地图实例。当指定此参数后,搜索结果的标注、线路等均会自动添加到此地图上。可选 ps:此处必须有 不然不知道在哪个地图上
showTraffic: false, // 设置是否显示实时路况信息,默认设置为true。 显示绿色代表畅通,黄色代表轻微拥堵,红色代表比较拥堵,灰色表示无路况信息。
hideMarkers: true //设置隐藏路径规划的起始点图标 设置为true
})
// 创建标记函数
const getMarker = (
point: number[],
image: string,
width = 25,
height = 30
) => {
const icon = new AMap.Icon({
size: new AMap.Size(width, height),
image,
imageSize: new AMap.Size(width, height)
})
const marker = new AMap.Marker({
position: point,
icon: icon,
offset: new AMap.Pixel(-width / 2, -height) // AMap.Pixel 像素坐标,确定地图上的一个像素点。
})
return marker
}
let startLngLat = [117.2147, 39.11712] // 起始的经纬度
// 使用标点
const startMarker = getMarker(startLngLat, startImg)
map.add(startMarker)
let endLngLat = [126.95717, 45.54774] // 结束的经纬度
// 使用标点
const endMarker = getMarker(endLngLat, endImg)
map.add(endMarker)
// startLngLat:起始坐标
// endLngLat:终点坐标
// {waypoints:[]}: 路途中的经纬度坐标
// function (status, result){} 规划好的回调函数
driving.search(
startLngLat,
endLngLat,
{
waypoints: [
[116.23128, 40.22077], // 北京
[119.48458, 39.83507], // 秦皇岛
[121.5255, 38.95223], // 大连
[123.46987, 41.80515], // 沈阳
[125.28845, 43.83327] //长春
]
},
function (status: string, result: object) {
// 未出错时,result即是对应的路线规划方案
// 运输位置 使用标点
const curr = [121.5255, 38.95223]
const currMarker = getMarker(curr, carImg, 33, 20)
map.add(currMarker)
// 3s后定位当中间进行缩放
setTimeout(() => {
map.setFitView(
[currMarker] // 覆盖物数组
// false, // 动画过渡到制定位置
// [60, 60, 60, 60], // 周围边距,上、下、左、右
// 10 // 最大 zoom 级别
)
map.setZoom(10)
}, 3000)
}
)
})
})
.catch((e) => {
console.log(e)
})
}
</script>
<template>
<div id="map">
</div>
</template>
<style lang="scss" scoped>
#map {
height: 450px;
background-color: #F6F7F9;
overflow: hidden;
}