在本项目中使用的是这个echart库
在项目中添加了dataZoom配置项但是不生效,突然想到微信小程序代码大小的限制,之前的echarts.js是定制的,有可能没有加dataZoom组件。故重新定制echarts.js。之前用的echarts版本是5.0.0,这次也是定制同样的版本,但是报错,按照之前的经验判断,可能是版本问题,故往上提高了一个版本。然后就生效啦!!!最后生效的版本5.1.0。
如果报错:
报t.addEventListener is not a function,把t.addEventListener(e,n,i) 删掉;
报t.preventDefault is not a function,我这边暂时把t.preventDefault里面的函数执行语句删除了,之后便可以进行拖动,但缩放没有试过。
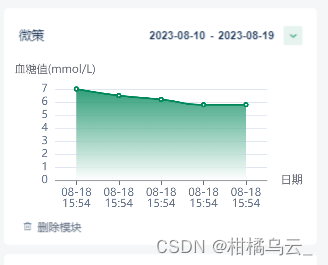
下面是option代码
let option = {
					grid: { //调整图与容器周围的间距
						top: '14%',
						left: '12%', //默认10%
						right: '16%', //默认10%
						// bottom: '8%', //默认60
						containLabel: true
						//grid区域是否包含坐标轴的刻度标签
					},
					xAxis: {
						name: "日期", //x轴的单位
						type: 'category',
						// interval: 2, // 设置间距为2,表示每隔一个刻度显示一个刻度
						// data: ['Mon', 'Tue', 'Wed', 'Thu', 'Fri', 'Sat', 'Sun'],
						data: this.xData,
						axisTick: {
							alignWithLabel: true,
							interval: 0,
						},
						axisLabel: {
							interval: 0,
							rotate: that.totalData.title === '微策' ? 0 : 20,
							textStyle: {
								color: '#667286',
							},
							// formatter: '{M}-{d}\n{HH}-{mm}'
							// 使用函数模板,函数参数分别为刻度数值(类目),刻度的索引
							formatter: function(value, index) {
								let label = value;
								if (that.totalData.title === '硅基') {
									label = `${label.slice(11, 19)}`
								} else if (that.totalData.title === '微策') {
									label = `${label.slice(5, 10)}\n${label.slice(11, 16)}`
								} else {
									label = `${label.slice(5, 10)}`
								}
								return label;
							}
						},

					},
					yAxis: {
						type: 'value',
						name: a[this.totalData.title], //y轴的单位
						axisLabel: {
							textStyle: {
								color: '#667286',
							},
							// 	formatter: '{value} KG',//y轴每一个刻度加单位
						},
					},
					dataZoom: [{
						type: 'inside',
						// show:this.dataZoomEnd===100?false:true,//当标签100%显示时候不显示滑块 type=slider时使用
						start: 0,
						end: this.dataZoomEnd,
					}],
					tooltip: {
						trigger: 'axis',
						axisPointer: {
							type: 'line',
							lineStyle: {
								// type: 'solid',//鼠标移入的基准线实线
								color: '#53cdef',
							},
						},
						// formatter: "日期 :{b0}\<br\/\>{a0} : {c0}KG \<br\/\>",
					},
					series: [{
						// showSymbol: false,//隐藏折线拐点,只有鼠标移入时候显示
						name: b[this.totalData.title],
						data: this.yData,
						// data: [820, 932, 901, 934, 1290, 1330, 1320],
						type: 'line',
						smooth: true,
						itemStyle: { //折线拐点标志的样式
							normal: {
								color: '#00875A',
							}
						},
						// label:{
						//   show: true,
						//   position: 'bottom',
						//   textStyle: {
						//     fontSize: 20
						//   }
						// },
						lineStyle: {
							normal: {
								color: '#00875A',
								width: 2,
							}
						},
						areaStyle: {
							opacity: 0.8,
							color: new echarts.graphic.LinearGradient(0, 0, 0, 1, [{
									offset: 0,
									color: '#00875A'
								},
								{
									offset: 1,
									color: '#FFFFFF'
								}
							])
						},
					}]
				};