一、前言

最近看到其他业务系统使用M/Monit来实现业务侧监控需求,今天我们来一起看下这款软件怎样;首先它能监控以下指标:

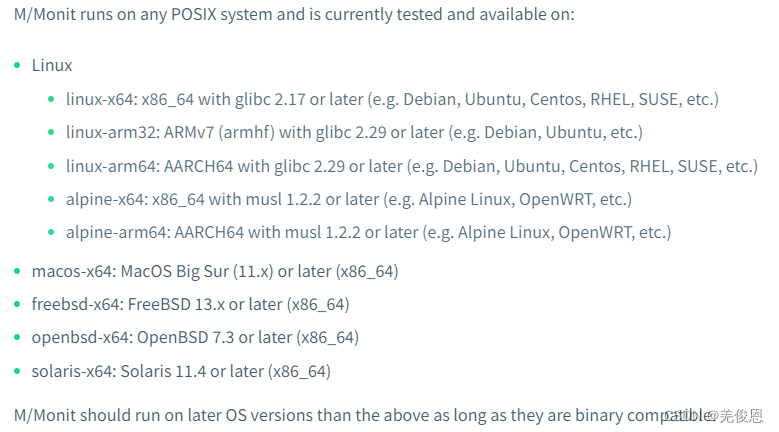
Monit是一个开源的跨平台的用来监控Unix/Linux系统(比如Linux、BSD、OSX、Solaris)。易于安装,轻量级(只有500KB大小),不依赖于任何第三方程序、插件或者库。但服务端MMonit是收费的,可以免费试用30天。

Monit可以监控服务器进程状态、HTTP/TCP状态码、服务器资源变化、文件系统变动等等,根据这些变化,可以设定邮件报警、Monit内嵌web界面,能够看到当前主机上的监控项状态,通过页面就可实现重启进程或服务。

相关链接:官网(国内无法访问)、官方文档、软件下载、wiki、版本发现说明、第三方软件下载
二、部署配置
1)产品组成
该产品跟传统监控产品类似,包括2个组件,M/Monit(集中管理) 和Monit(被监控机);另 M/Monit 需要 Monit 5.2.0以上版本
2)部署配置服务端:M/Monit
#安装M/Monit
cd /opt
wget https://mmonit.com/dist/mmonit-3.7.15-linux-x64.tar.gz
tar xf mmonit-3.7.15-linux-x64.tar.gz
cd mmonit-3.7.15
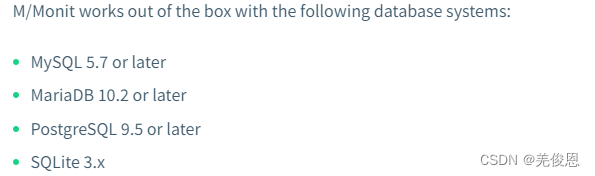
#配置M/Monit,编辑conf/server.xml,或者也可不改动使用,默认配置是8080端口,自带"sqlite
……
<Connector address="*" port="8080" processors="10" />
……
#<Realm url="sqlite:///db/mmonit.db?synchronous=normal&heap_limit=8000&foreign_keys=on&journal_mode=wal"
# minConnections="5"
# maxConnections="25"
# reapConnections="300" />
<Realm url="mysql://mmonit:passwd@mysql_ip/mmonit"
minConnections="5"
maxConnections="25"
reapConnections="300" />
:wq
#导入mysql数据库结构
mysql -ummonit -ppasswd < /opt/mmonit-3.7.15/db/mmonit-schema.mysql
#启动M/Monit
./bin/mmonit -c conf/server.xml
#完成后,就可浏览器登录了,默认账户:
#admin/swordfish
#monit/monit


3)部署代理端:monit

cd /opt
wget https://mmonit.com/monit/dist/binary/5.33.0/monit-5.33.0-linux-x64.tar.gz
tar xf monit-5.33.0-linux-x64.tar.gz
cd monit-5.33.0
#或直接
yum install  -y monit  //注意满足版本要求,安装后默认配置在/etc/monitrc和/etc/monit.d/,monitrc必须具有读写权限不超过0700
#配置
vim conf/monitrc   //如下所示
monit -V  //验证,一般是5.26版本

#检测周期
set daemon  30  #设置monit作为守护进程运行,每30秒监视一次
#进程文件配置
set logfile syslog
set pidfile /var/run/monit.pid
set idfile /var/.monit.id
set statefile /var/.monit.state
#事件队列
set eventqueue basedir /var/monit slots 100
#配置mmonit(即服务端,将监控数据发送至MMonit进行统一展示)
set mmonit http://monit:monit@mm_ip:8080/collector
#邮件服务器地址
set mailserver mail_ip port 25
   username "[email protected]" password "monit"
#自定义发送邮件格式($DATE等都是monit内置变量)
set mail-format {


   from:    [email protected]
   subject: monit alert --  $EVENT $SERVICE
   message: $EVENT Service $SERVICE
                 Date:        $DATE
                 Action:      $ACTION
                 Host:        $HOST
                 Description: $DESCRIPTION
 }
#设置报警收件人,Monit默认情况下如果一个服务失败只发送一个通知
alert [email protected] with reminder on 10 cycles  #在服务保持处于失败状态时每十个周期通知一次
alert [email protected] with reminder on 1 cycle   #在每个失败的周期获得通知
noalert mail-address   #禁止某些用户和服务的警报,可以在服务检查的局部配置里添加语句
set alert [email protected]
set alert [email protected]

#配置https,用于web界面
set httpd port 8443 and
    use address localhost
    allow localhost
    allow admin:monit     #web登录的用户名和密码
    Services allow // 允许连接的主机IP,或网段
    allow username:password  // 设置页面监控访问的用户名和密码## Includes
include /etc/monit.d/*
#配置为监控项
#检查monit配置文件更新
check file monitrc path /opt/monit-5.33.0/conf/monitrc
    if changed sha1 checksum
    then exec "/opt/monit-5.33.0/bin/monit -c /opt/monit-5.33.0/conf/monitrc reload"
#检查系统负载
check system 172.16.10.2    #被监控客户端
    group system
    if loadavg (1min) > 4 then alert
    if loadavg (5min) > 2 then alert
    if cpu usage > 95% for 10 cycles then alert
    if memory usage > 75% then alert
    if swap usage > 25% then alert
#磁盘各目录空间
check filesystem root with path /
    group system
    if space usage > 90% then alert
check filesystem usr with path /usr
    group system
    if space usage > 80% then alert
check filesystem var with path /var
    group system
    if space usage > 90% then alert
#监控ssh服务
check process sshd with pidfile /var/run/sshd.pid
     start program "/etc/init.d/sshd start"
     stop program "/etc/init.d/sshd stop"
     if failed host 127.0.0.1 port 22 protocol ssh then restart
#监控nginx(不仅可以监控进程PID文件的变化,还可以监控80端口)
check process nginx with pidfile /var/run/nginx.pid
    start program = "/etc/init.d/nginx start" with timeout 60 seconds
    stop program  = "/etc/init.d/nginx stop"
    if changed pid for 5 cycles then restart
    if failed port 80 protocol http with timeout 2 seconds then alert
:wq

./bin/monit -c conf/monitrc  //启动monit,这时,就能在MMonit的web界面发现一台主机了

#配置开启启动,注:配置后要停止monit所监视的服务,应该使用monit stop name这样的命令
echo "moni:8443:respawn:/usr/local/monit-5.33/bin/monit -Ic /etc/monitrc" >> /etc/inittab

#其他常用命令
monit -t             #配置文件检测
monit                 #启动monit daemon
monit -c /var/monit/monitrc  # 启动monit daemon 时 指定配置文件
monit reload       # 当更新了配置文件需要重载
monit status       # 查看所有服务状态
monit status nginx  # 查看nginx服务状态
monit stop all          # 停止所有服务
monit stop nginx     # 停止nginx服务
monit start all          # 启动所有服务
monit start nginx     # 启动nginx服务
注:也可使用官网的二进制包,Monit是用OpenSSL 1.1.1t静态链接和PAM支持动态链接构建的。更多参看:https://mmonit.com/monit/documentation/monit.html
三、使用
1)Nginx监控
vi /etc/monit.d/nginx.monit  //参考如下
check process nginx with pidfile /usr/local/nginx/nginx.pid
start program = "/usr/local/nginx/sbin/nginx"
stop program = "/usr/local/nginx/sbin/nginx -s stop"
if failed host 192.168.1.11 port 8011 protocol http then restart

monit -t  //检查配置是否正常
monit start all
monit status
2)服务(service)监控
监控语法:
check <类型> <服务名> [PATH ] [ ADDRESS ]
其中类型时monit支持的监控类型,分为:system、file、process、fifo、filesystem、directory、host、network、program。
服务名必需是英文且唯一,不可以出现重复!
每个服务条目由关键字组成check,后面是服务类型。每个条目需要唯一的描述性名称,可以自由选择。此名称由Monit用于在内部和与用户的所有交互中引用该服务。
目前,支持九种类型的检查语句:
1、进程
CHECK PROCESS <unique name> <PIDFILE <path> | MATCHING <regex>>
2、文件
CHECK FILE <unique name> PATH <path>
3、Fifo
CHECK FIFO <unique name> PATH <path>
4、文件系统
CHECK FILESYSTEM <unique name> PATH <path>
5、目录
CHECK DIRECTORY <unique name> PATH <path>
6、远程主机
CHECK HOST <unique name> ADDRESS <host address>
7、系统
CHECK SYSTEM <unique name>
8、网络
CHECK NETWORK <unique name> <ADDRESS <ipaddress> | INTERFACE <name>>
9、自定义
CHECK PROGRAM <unique name> PATH <executable file> [TIMEOUT <number> SECONDS]
3)host监控
一个完整的HOST监控服务语法:
check host <service> address <address or ip>
if failed
xxx
then alert
alert xx@xxx
配置示例:
## system
check system $HOST
if loadavg (1min) > 4 then alert
if loadavg (5min) > 2 then alert
if cpu usage > 95% for 10 cycles then alert
if memory usage > 75% then alert
if swap usage > 25% then alert## file
check file apache_bin with path /usr/local/apache/bin/httpd
if failed checksum and
expect the sum 8f7f419955cefa0b33a2ba316cba3659 then unmonitor
if failed permission 755 then unmonitor
if failed uid root then unmonitor
if failed gid root then unmonitor
alert [email protected] on {


checksum, permission, uid, gid, unmonitor
} with the mail-format {

     subject: Alarm! }
group server## process
check process apache with pidfile /usr/local/apache/logs/httpd.pid
start program = "/etc/init.d/httpd start" with timeout 60 seconds
stop program = "/etc/init.d/httpd stop"
if cpu > 60% for 2 cycles then alert
if cpu > 80% for 5 cycles then restart
if totalmem > 200.0 MB for 5 cycles then restart
if children > 250 then restart
if loadavg(5min) greater than 10 for 8 cycles then stop
if failed host www.tildeslash.com port 80 protocol http
and request "/somefile.html"
then restart
if failed port 443 protocol https with timeout 15 seconds then restart
if 3 restarts within 5 cycles then unmonitor
depends on apache_bin
group server## filesystem
check filesystem datafs with path /dev/sdb1
start program = "/bin/mount /data"
stop program = "/bin/umount /data"
if failed permission 660 then unmonitor
if failed uid root then unmonitor
if failed gid disk then unmonitor
if space usage > 80% for 5 times within 15 cycles then alert
if space usage > 99% then stop
if inode usage > 30000 then alert
if inode usage > 99% then stop
group server## file's timestamp
check file database with path /data/mydatabase.db
if failed permission 700 then alert
if failed uid data then alert
if failed gid data then alert
if timestamp > 15 minutes then alert
if size > 100 MB then exec "/my/cleanup/script" as uid dba and gid dba
## directory permission
check directory bin with path /bin
if failed permission 755 then unmonitor
if failed uid 0 then unmonitor
if failed gid 0 then unmonitor
## remote host
check host myserver with address 192.168.1.1
if failed ping then alert
if failed port 3306 protocol mysql with timeout 15 seconds then alert
if failed port 80 protocol http
and request /some/path with content = "a string"
then alert
## network link status
check network public with interface eth0
if failed link then alert
if changed link then alert
if saturation > 90% then alert
if download > 10 MB/s then alert
if total upload > 1 GB in last hour then alert
## custom program status output
check program myscript with path /usr/local/bin/myscript.sh
if status != 0 then alert