目录
Prometheus
简介
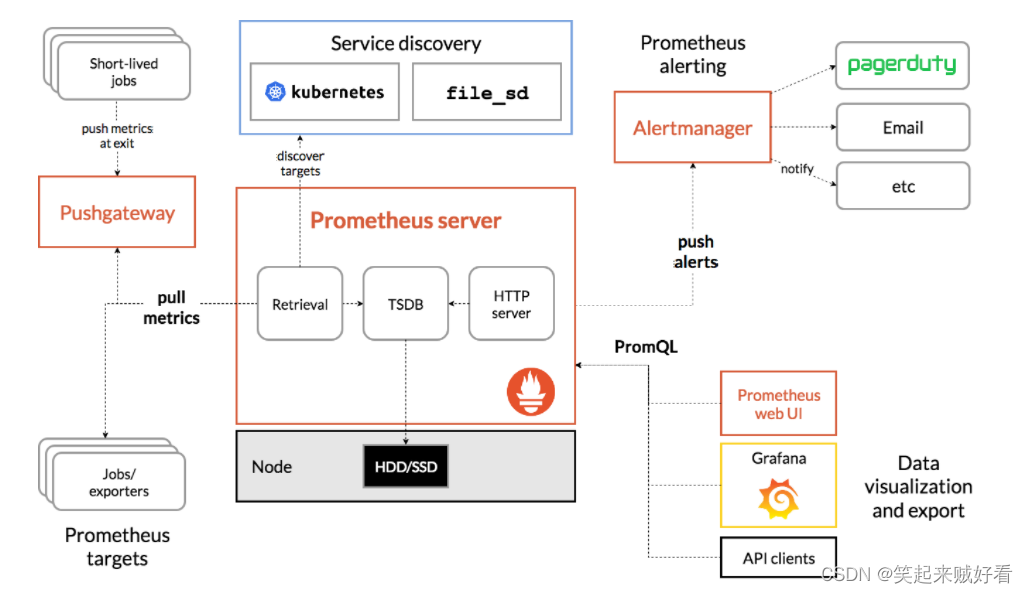
Prometheus是一个开源的系统监控和报警系统,现在已经加入到CNCF基金会,成为继k8s之后第二个在CNCF托管的项目,在kubernetes容器管理系统中,通常会搭配prometheus进行监控,同时也支持多种exporter采集数据,还支持pushgateway进行数据上报,Prometheus性能足够支撑上万台规模的集群。
下载软件包
wget https://github.com/prometheus/prometheus/releases/download/v2.19.2/prometheus-2.19.2.linux-amd64.tar.gz
安装部署
解压
tar zxvf prometheus-2.19.2.linux-amd64.tar.gz
mv prometheus-2.19.2.linux-amd64 /usr/local/prometheus
创建用户
groupadd prometheus
useradd -g prometheus -m -d /var/lib/prometheus -s /sbin/nologin prometheus
chown prometheus.prometheus -R /usr/local/prometheus
创建Systemd服务
cat > /etc/systemd/system/prometheus.service <<EOF
[Unit]
Description=prometheus
After=network.target
[Service]
Type=simple
User=prometheus
ExecStart=/usr/local/prometheus/prometheus --config.file=/usr/local/prometheus/prometheus.yml --storage.tsdb.path=/var/lib/prometheus/data
Restart=on-failure
[Install]
WantedBy=multi-user.target
EOF
修改配置文件prometheus.yml
前面部分基本没改动,沿用默认配置。
| 参数 | 作用 |
|---|---|
| scrape_interval | 默认抓取间隔, 15秒向目标抓取一次数据 |
| scrape_configs | 这个配置是表示在这个配置内的时间序例,每一条都会自动添加上这个{job_name:“prometheus”}的标签 - job_name: ‘prometheus’ |
| job_name | 默认抓取间隔, 15秒向目标抓取一次数据 |
| scrape_interval | 监控名称,相当于分组组名之类 (可手动自定义添加) |
| static_configs | 配置静态获取地址,与targets配合使用 |
| file_sd_configs | 引用外部获取地址,与files配合使用 |
| files | 外部获取地址文件指定,外部IP地址需要以json格式。 此方法优点适合大集群规模,可以根据hosts文件,批量生成json文件。可以直接添加IP地址,不用修改主配置,不用重启prometheus |
最终配置文件如下:
# my global config
global:
scrape_interval: 15s # Set the scrape interval to every 15 seconds. Default is every 1 minute.
evaluation_interval: 15s # Evaluate rules every 15 seconds. The default is every 1 minute.
# scrape_timeout is set to the global default (10s).
# Alertmanager configuration
alerting:
alertmanagers:
- static_configs:
- targets:
# - alertmanager:9093
# Load rules once and periodically evaluate them according to the global 'evaluation_interval'.
rule_files:
# - "first_rules.yml"
# - "second_rules.yml"
# A scrape configuration containing exactly one endpoint to scrape:
# Here it's Prometheus itself.
scrape_configs:
# The job name is added as a label `job=<job_name>` to any timeseries scraped from this config.
- job_name: 'prometheus'
# metrics_path defaults to '/metrics'
# scheme defaults to 'http'.
static_configs:
- targets: ['localhost:9090']
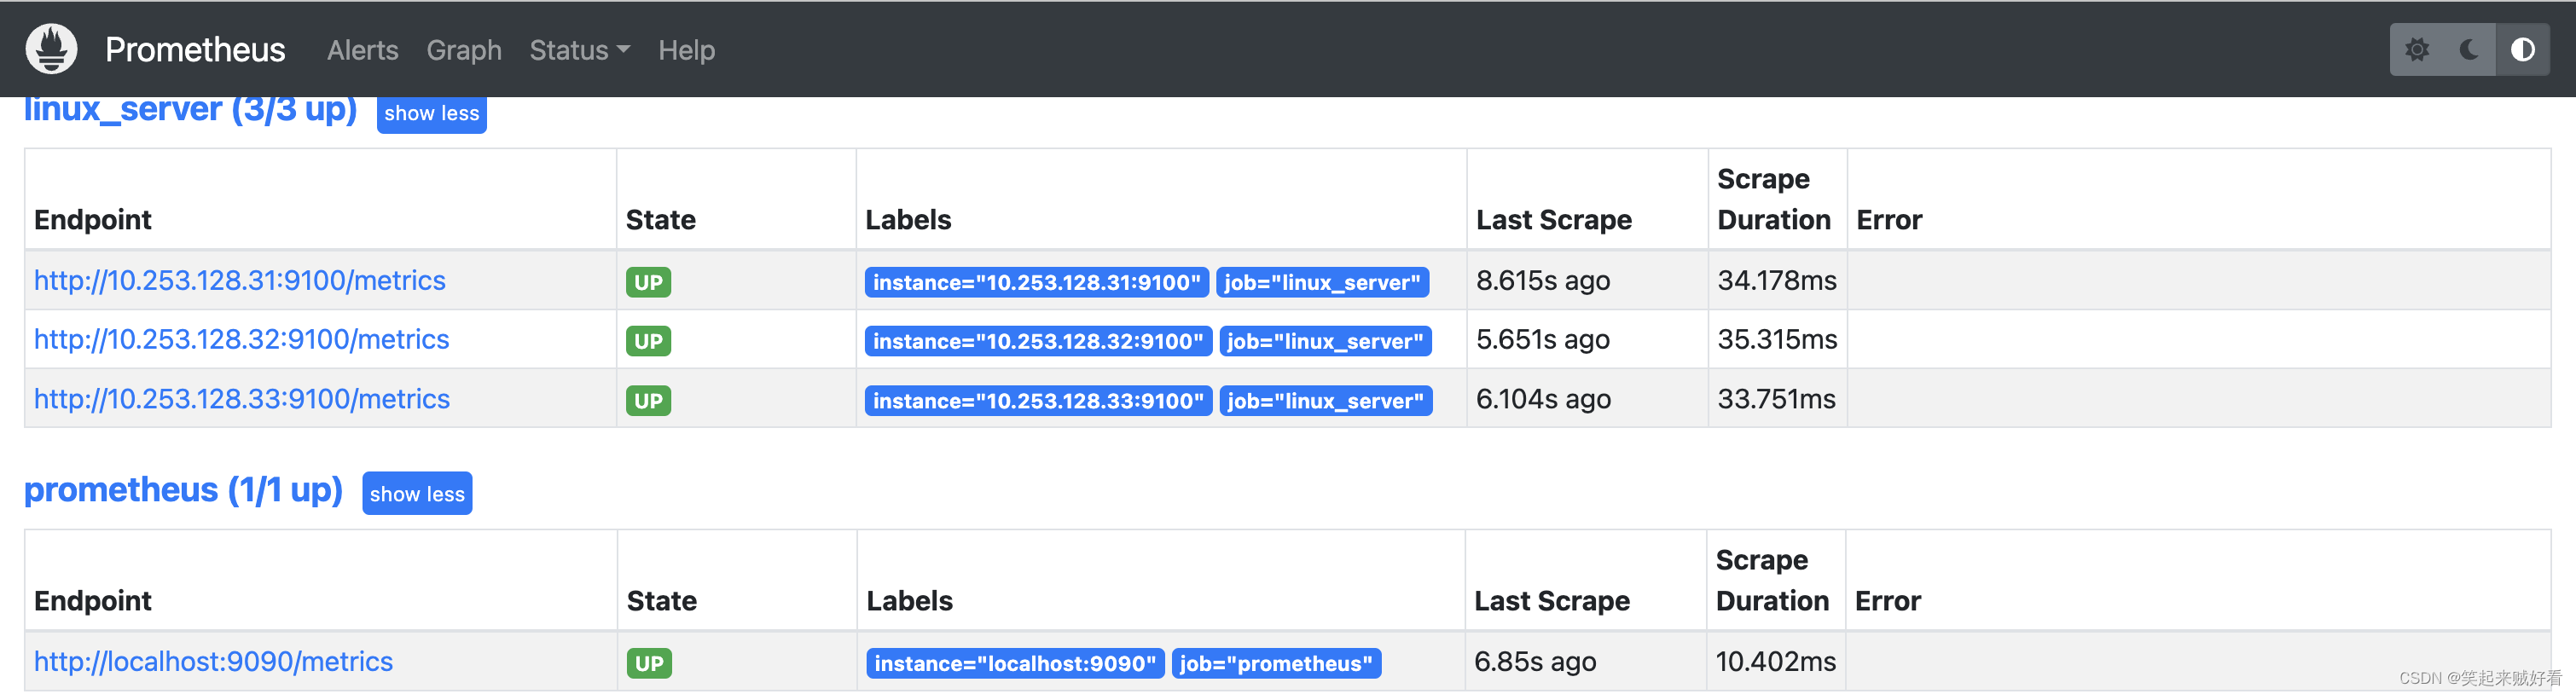
- job_name: 'linux_server' #自定义名称,用于监控linux基础服务
file_sd_configs:
- files:
- configs/linux.json #linux机器IP地址json文件
- job_name: 'hdfs' #用于监控HDFS组件
file_sd_configs:
- files:
- configs/hdfs.json #hdfs参数获取地址
- job_name: 'hbase' #用于监控Hbase组件
file_sd_configs:
- files:
- configs/hbase.json #hbase参数获取地址
- job_name: 'yarn' #用于监控Yarn组件
file_sd_configs:
- files:
- configs/yarn.json #yarn参数获取地址
- job_name: 'zookeeper' #用于监控zk组件
file_sd_configs:
- files:
- configs/zookeeper.json #zk参数获取地址
- job_name: 'hive'
file_sd_configs:
- files:
- configs/hive.json
- job_name: 'kafka'
file_sd_configs:
- files:
- configs/kafka.json
- job_name: 'spark'
file_sd_configs:
- files:
- configs/spark.json
启动Prometheus
systemctl daemon-reload
systemctl start prometheus
systemctl status prometheus
systemctl enable prometheus
node exporter
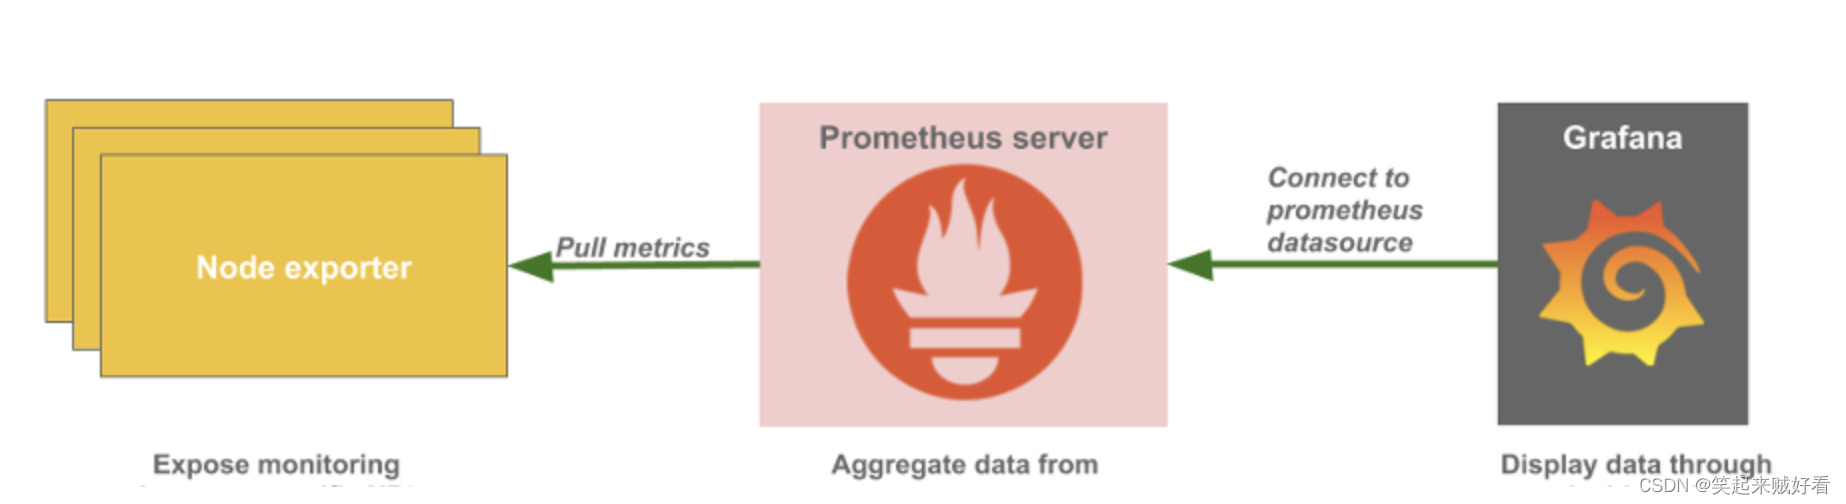
Exporter是Prometheus的指标数据收集组件。它负责从目标Jobs收集数据,并把收集到的数据转换为Prometheus支持的时序数据格式。 和传统的指标数据收集组件不同的是,他只负责收集,并不向Server端发送数据,而是等待Prometheus Server 主动抓取.
node-exporter 默认的抓取url地址:http://ip:9100/metrics
另外,如果因为环境原因,网络不可达的场景,Prometheus可以使用Pushgateway 这个组件推送node-exporter的指标数据到远端Prometheus
node-exporter用于采集node的运行指标,包括node的cpu、load、filesystem、meminfo、network等基础监控指标,类似于zabbix监控系统的的zabbix-agent
node-exporter由Prometheus官方提供、维护,属于监控指标收集类UNIX内核操作系统的必备的exporter。
下载软件包
wget https://github.com/prometheus/node_exporter/releases/download/v1.5.0/node_exporter-1.5.0.linux-amd64.tar.gz
安装部署
解压
tar zxvf node_exporter-1.5.0.linux-amd64.tar.gz
mv node_exporter-1.5.0.linux-amd64 /usr/local/node_exporter
创建systemd服务
vim /etc/systemd/system/node_exporter.service

[Unit]
Description=node_exporter
After=network.target

[Service]
Type=simple
User=prometheus
ExecStart=/usr/local/node_exporter/node_exporter
Restart=on-failure

[Install]
WantedBy=multi-user.target
启动node_exporter
systemctl daemon-reload
systemctl start node_exporter
systemctl status node_exporter
systemctl enable node_exporter
graphite_exporter
Graphite 来收集度量标准,Grafana 则用于构建仪表板,首先,需要配置 Spark 以将 metrics 报告到 Graphite。
prometheus 提供了一个插件(graphite_exporter),可以将 Graphite metrics 进行转化并写入 Prometheus (本文的方式)。
graphite_exporter 接收数据端口为9109
下载软件包
https://github.com/prometheus/graphite_exporter/releases/download/v0.12.4/graphite_exporter-0.12.4.linux-amd64.tar.gz
安装部署
解压
tar -xvzf graphite_exporter-0.12.4.linux-amd64.tar.gz
mv graphite_exporter-0.12.4.linux-amd64 /usr/local/graphite_exporter
创建systemd服务
vim /usr/lib/systemd/system/graphite_exporter.service

[Unit]
Description=prometheus graphite_exporter

[Service]
Type=simple
ExecStart=/usr/local/graphite_exporter/graphite_exporter --graphite.mapping-config=/usr/local/graphite_exporter/graphite_exporter_mapping
ExecReload=/bin/kill -HUP $MAINPID
KillMode=process
Restart=on-failure
RestartSec=42s

[Install]
WantedBy=multi-user.target
启动 graphite_exporter
systemctl daemon-reload
systemctl restart graphite_exporter.service
systemctl enable graphite_exporter.service
systemctl status graphite_exporter
希望对正在查看文章的您有所帮助,记得关注、评论、收藏,谢谢您