1. 前言
前面我不是说了要做一个图床吗,现在在做ui。
我vue水平不够高,大部分参考b站项目照猫画虎。
我使用ts,vite,vue3进行了重构。
当然,我对这些理解并不深刻,许多代码都是游离于表面,仅仅给大家参考
2. 过程
2.1. 使用elemen ui进行导航制作。
这里直接用element ui菜单直接粘上去就可以,几乎没有任何其他处理
<template>
  <el-menu
      default-active="2"
      class="el-menu-vertical-demo"
      :collapse="useHeaderStore().tab.isCollapse"

      @open="handleOpen"
      @close="handleClose"
  >
    <img class="logo" src="../..//src/assets/云盘上传.png">
    <h1 class="title">{

   {useHeaderStore().tab.isCollapse? "图床":"好玩图床"}}</h1>
    <el-sub-menu v-for="item of currentMenu.items" :index="item.title">
      <template #title>
        <el-icon >
          <component :is=item.icon></component>
          </el-icon>
        <span>{

   {item.title}}</span>
      </template>

      <el-menu-item @click="clickMenu(cItem.path,cItem.title)" v-for="cItem of item.children" :index="cItem.title "><el-icon><component :is = cItem.icon></component></el-icon>{

   {cItem.title}}</el-menu-item>
    </el-sub-menu>

  </el-menu>
</template>
值得注意的是icon动态绑定的展示和vue2略有不同
     <el-icon >
      <component :is=item.icon></component>
      //使用component :is=item.icon展示
      </el-icon>
2.2.head制作

header部分主要有一个折叠开关,由于和左侧栏不是一个组件里,我使用pinia进行数据传递。
<template>
  <div class="header-container">

    <div class="l-content">
      <el-button @click="handleMenu" :icon="Menu" size="mini" />
      <!-- 面包屑 -->
      <el-breadcrumb separator="/" style="margin-left: 20px">
        <el-breadcrumb-item v-for="item in tags" :key="item.path" :to="{ path: item.path }">{

   { item.title }}</el-breadcrumb-item>
      </el-breadcrumb>

    </div>
    <div class="r-content">
      <el-dropdown>
        <span class="el-dropdown-link">
          <img class="user" src="../assets/meiyangyang.jpg">
        </span>
        <template #dropdown>
          <el-dropdown-menu>
            <el-dropdown-item>退出</el-dropdown-item>
          </el-dropdown-menu>
        </template>
      </el-dropdown>
    </div>
  </div>
</template>
<script lang="ts" setup>
import {

     Menu } from '@element-plus/icons-vue';
import useHeaderStore from "@/store/moudle/header";
import {

    computed} from "vue";

const handleMenu = () => {


  const headerStore   = useHeaderStore();
  headerStore.tab.isCollapse = !headerStore.tab.isCollapse;

};
const tags = computed(() => {


  const headerStore = useHeaderStore();
  return headerStore.tab.tabList;
});
</script>
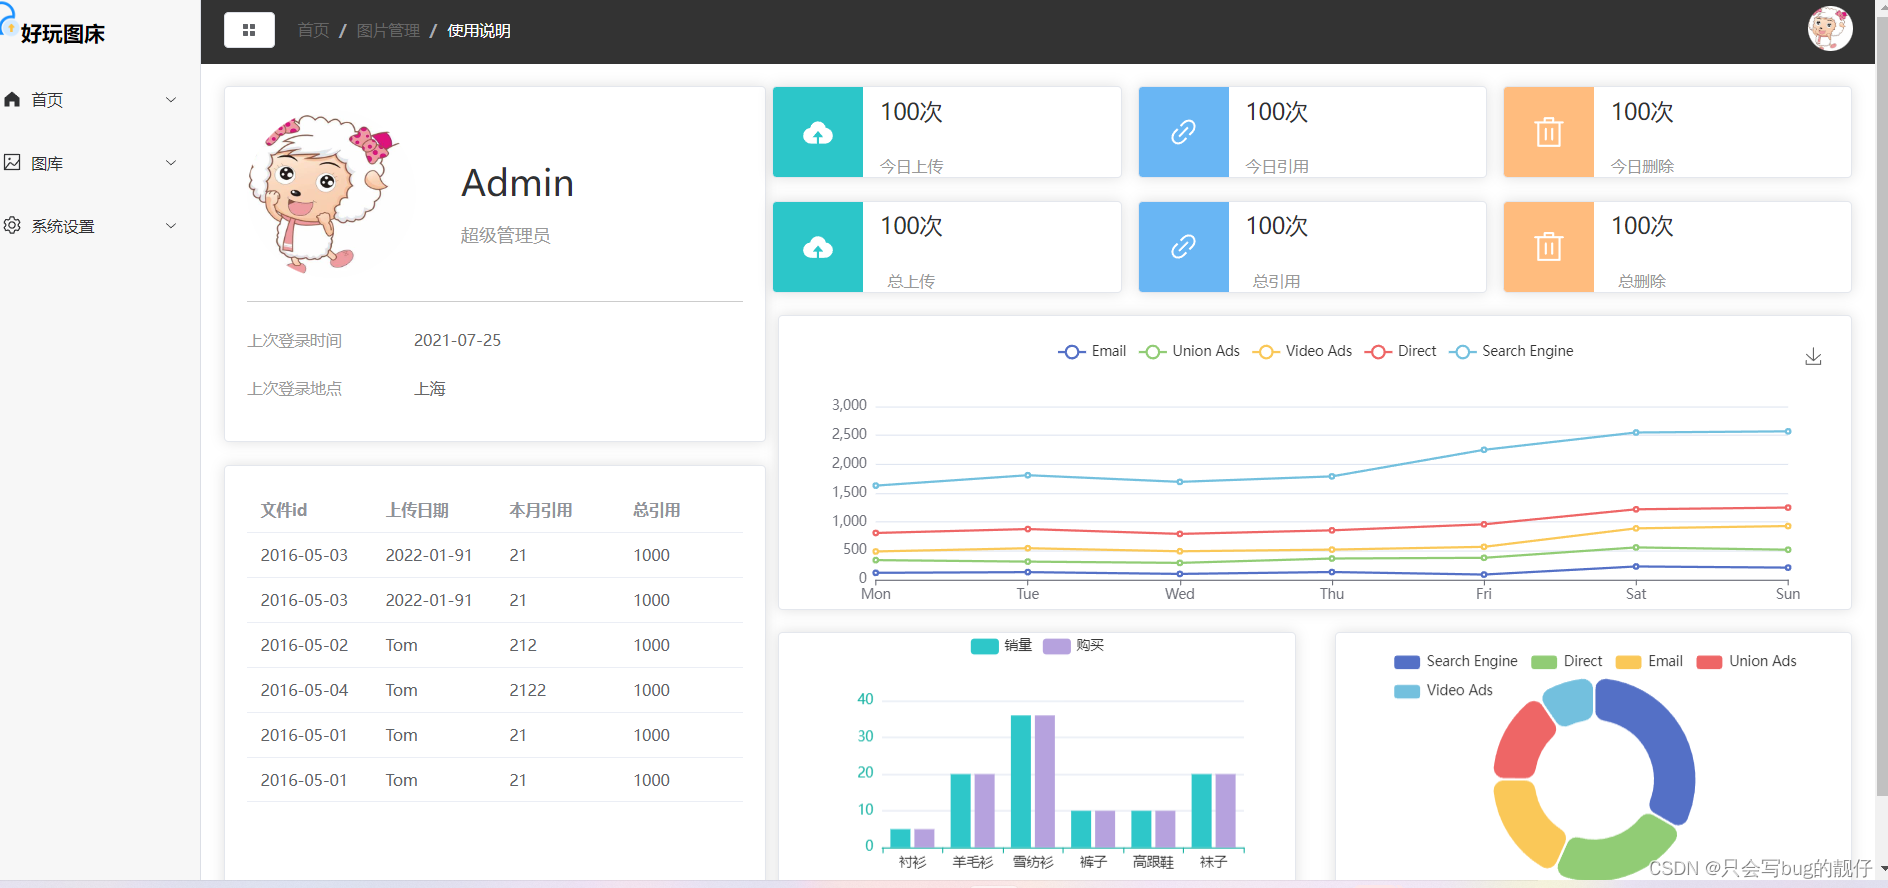
2.3.首页制作
- 两个表格
<el-card class="box-card">
   <div class="user">
     <img src="../assets/meiyangyang.jpg">
     <div class="user-info">
       <p class="name">Admin</p>
       <p class="access">超级管理员</p>
     </div>
   </div>
   <div class="login-info">
     <p>上次登录时间 <span>2021-07-25</span></p>
     <p>上次登录地点 <span>上海</span></p>
   </div>
  </el-card>
  <el-card style="margin-top: 20px; height: 410px">
    <el-table :data="tableData" style="width: 100%">
      <el-table-column prop="date" label="文件id"  />
      <el-table-column prop="name" label="上传日期"  />
      <el-table-column prop="address" label="本月引用" />
      <el-table-column prop="allLinks" label="总引用" />
    </el-table>
  </el-card>
这个直接element ui贴贴就完了。
- 6个颜色卡
6个盒子,这个可能css难写点,我基本都是抄的给不出什么建议。
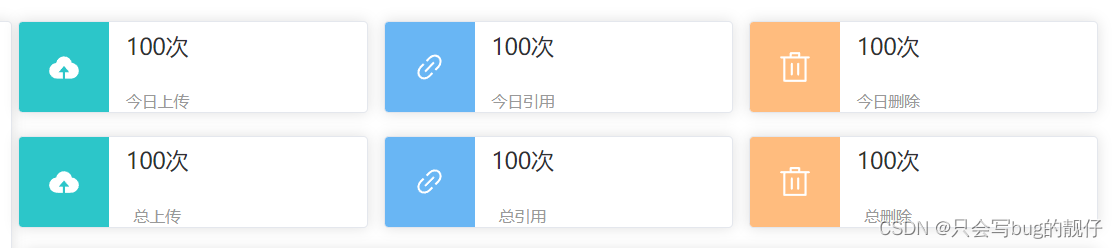
<div class="num">
        <el-card v-for="item in labelDate" :key="item.label" :body-style="{display: 'flex',padding: '0',height : '80px'}">
          <div class="icon" :style="{backgroundColor:item.color}">
          <el-icon size="30px" style="text-align: center">
            <component  :is=item.icon ></component>
          </el-icon>
          </div>
          <div class="details">
            <p class="sum">{

   {item.sum}}次</p>
            <p class="label">{

   {item.label}}</p>
          </div>
        </el-card>
      </div>
<style lang="less" scoped>

.login-info{


  p{


    line-height: 28px;
    font-size: 14px;
    color : #999999;
    span{


      color: #666666;
      margin-left: 60px;
    }
  }
}
.user{


  margin-bottom: 20px;
  padding-bottom: 20px;
  border-bottom: 1px solid #ccc;
  display: flex;
  align-items: center;
  img{


    margin-right: 40px;
    width: 150px;
    height: 150px;
    border-radius: 50%;
  }
  .user-info{


    .name{


      font-size: 32px;
      margin-bottom: 10px;
    }
    .access{


      color: #999999;
    }
  }

}
.card-header {


  display: flex;
  justify-content: space-between;
  align-items: center;
}

.text {


  font-size: 14px;
}

.item {


  margin-bottom: 18px;
}

.box-card {


}

.num {


  display: flex;
  flex-wrap: wrap;
  justify-content: space-between;
  .icon {


    display: flex;
    justify-content: center;
    align-items: center;
    width: 80px;
    height: 80px;
    text-align: center;
    line-height: 80px;
    color: #fff;
  }
  .details {


    margin-left: 15px;
    display: flex;
    flex-direction: column;
    justify-content: center;
    .sum {


      font-size: 20px;
      margin-bottom: 10px;
      line-height: 30px;
      height: 30px;
    }
    .label {


      font-size: 14px;
      color: #999;
      text-align: center;
    }
  }
  .el-card {


    margin-left: 5px;
    width: 32%;
    margin-bottom: 20px;
  }
}
.graph{


  display: flex;
  margin-top: 20px;
  justify-content: space-between;
  .el-card{


    width: 48%;

  }
}

</style>
- 图表制作。
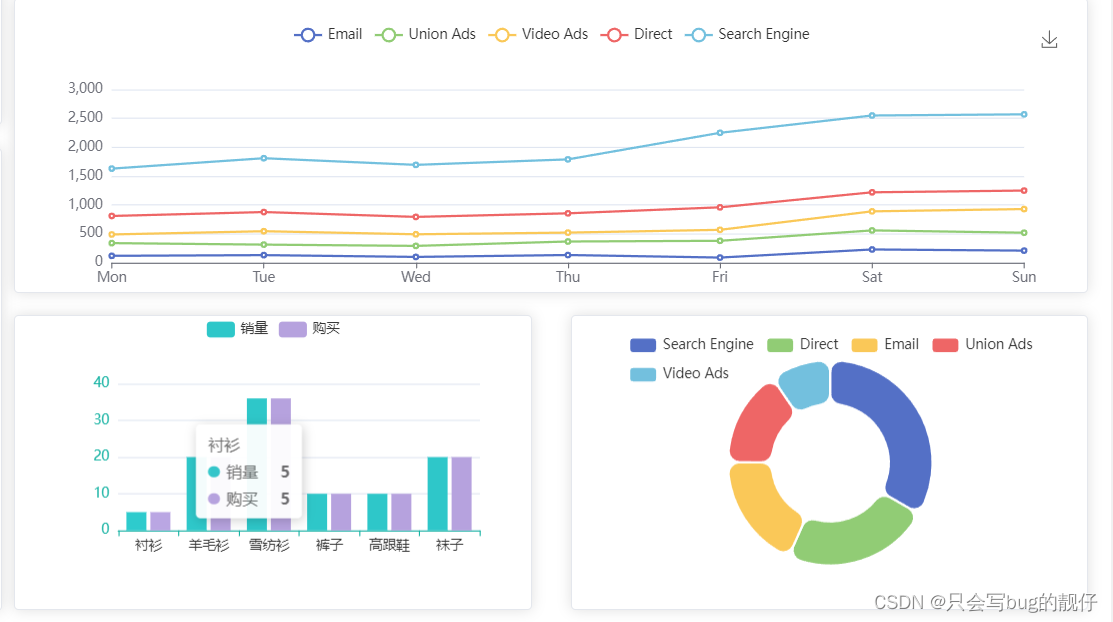 图标是使用echart插件制作的,很好用,推荐。
这个直接定位id然后塞进去就行,写在钩子函数里。
onMounted(() => {


  const myCharts = echarts.init(document.getElementById('chart1'));
  const option = {


    title: {


      text: ''
    },
    tooltip: {


      trigger: 'axis'
    },
    legend: {


      data: ['Email', 'Union Ads', 'Video Ads', 'Direct', 'Search Engine']
    },
    grid: {


      left: '3%',
      right: '4%',
      bottom: '10%',
      containLabel: true
    },
    toolbox: {


      feature: {


        saveAsImage: {

    }
      }
    },
    xAxis: {


      type: 'category',
      boundaryGap: false,
      data: ['Mon', 'Tue', 'Wed', 'Thu', 'Fri', 'Sat', 'Sun']
    },
    yAxis: {


      type: 'value'
    },
    series: [
      {


        name: 'Email',
        type: 'line',
        stack: 'Total',
        data: [120, 132, 101, 134, 90, 230, 210]
      },
      {


        name: 'Union Ads',
        type: 'line',
        stack: 'Total',
        data: [220, 182, 191, 234, 290, 330, 310]
      },
      {


        name: 'Video Ads',
        type: 'line',
        stack: 'Total',
        data: [150, 232, 201, 154, 190, 330, 410]
      },
      {


        name: 'Direct',
        type: 'line',
        stack: 'Total',
        data: [320, 332, 301, 334, 390, 330, 320]
      },
      {


        name: 'Search Engine',
        type: 'line',
        stack: 'Total',
        data: [820, 932, 901, 934, 1290, 1330, 1320]
      }
    ]
  };
  myCharts.setOption(option);

  // 柱状图
  const echarts2 = echarts.init(document.getElementById('chart2'));
  const option2 = {


    legend: {


      // 图例文字颜色
      textStyle: {


        color: "#333",
      },
    },
    grid: {


      left: "20%",
    },
    // 提示框
    tooltip: {


      trigger: "axis",
    },
    xAxis: {


      type: "category", // 类目轴
      data: ['衬衫', '羊毛衫', '雪纺衫', '裤子', '高跟鞋', '袜子'],
      axisLine: {


        lineStyle: {


          color: "#17b3a3",
        },
      },
      axisLabel: {


        interval: 0,
        color: "#333",
      },
    },
    yAxis: [
      {


        type: "value",
        axisLine: {


          lineStyle: {


            color: "#17b3a3",
          },
        },
      },
    ],
    color: ["#2ec7c9", "#b6a2de"],
    series: [
      {


        name: '销量',
        type: 'bar',
        data: [5, 20, 36, 10, 10, 20]
      },
      {


        name: '购买',
        type: 'bar',
        data: [5, 20, 36, 10, 10, 20]
      }
    ],
  };
  echarts2.setOption(option2);
  const option3 = {


    tooltip: {


      trigger: 'item'
    },
    legend: {


      top: '5%',
      left: 'center'
    },
    series: [
      {


        name: 'Access From',
        type: 'pie',
        radius: ['40%', '70%'],
        avoidLabelOverlap: false,
        itemStyle: {


          borderRadius: 10,
          borderColor: '#fff',
          borderWidth: 2
        },
        label: {


          show: false,
          position: 'center'
        },
        emphasis: {


          label: {


            show: true,
            fontSize: 40,
            fontWeight: 'bold'
          }
        },
        labelLine: {


          show: false
        },
        data: [
          {

     value: 1048, name: 'Search Engine' },
          {

     value: 735, name: 'Direct' },
          {

     value: 580, name: 'Email' },
          {

     value: 484, name: 'Union Ads' },
          {

     value: 300, name: 'Video Ads' }
        ]
      }
    ]
  };

  //饼图
  const echarts3 = echarts.init(document.getElementById('chart3'));
  option && echarts3.setOption(option3);
后面暂时没了,最后写完的话,我会把源码放出来