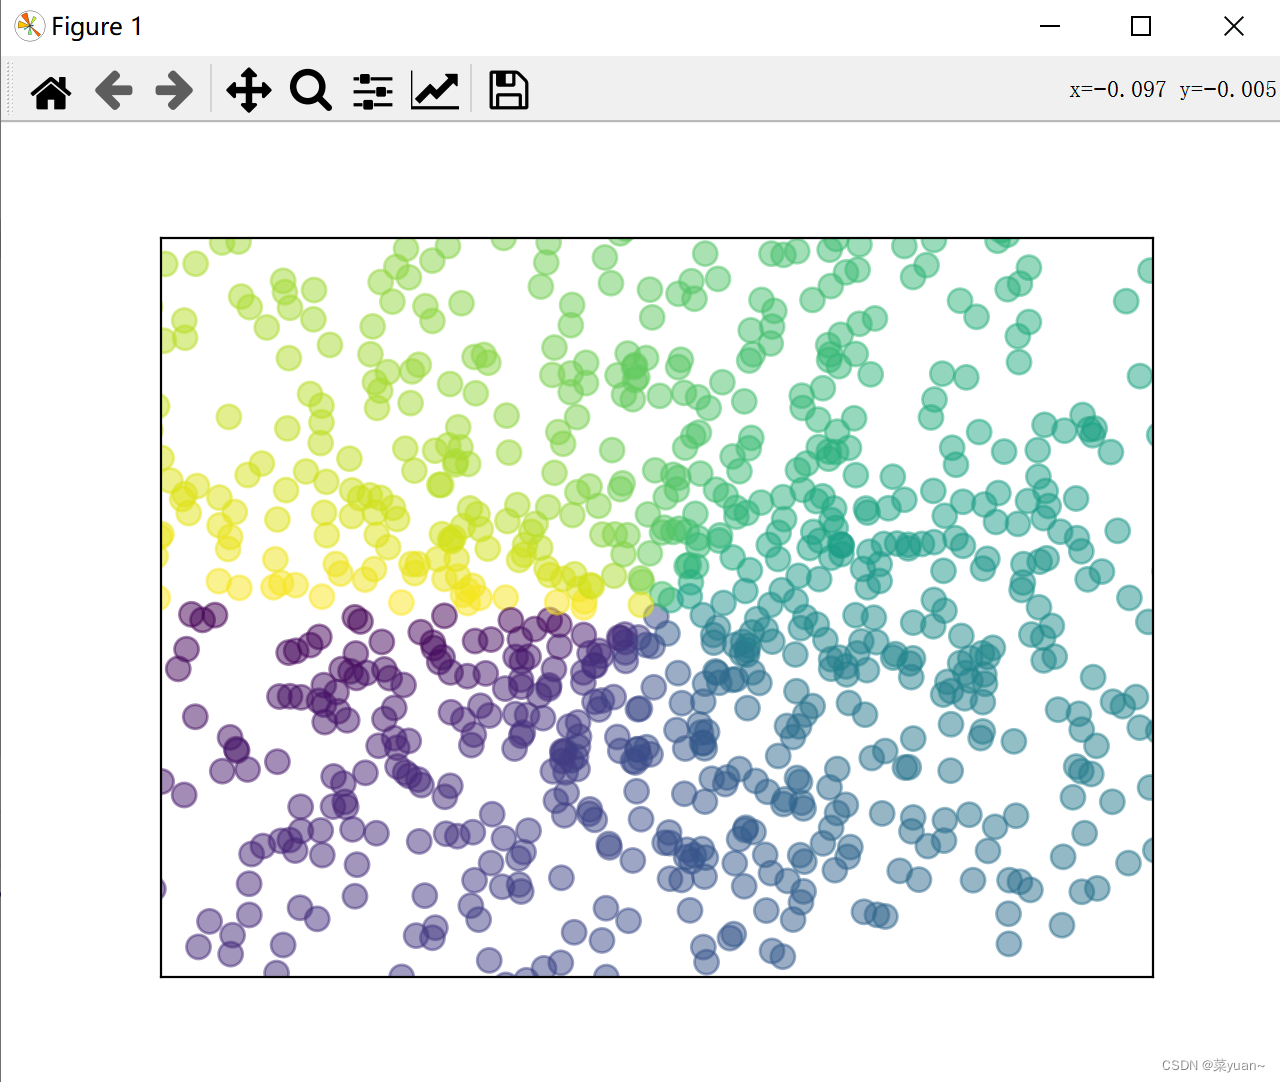
1. 散点图
import matplotlib.pyplot as plt  # 导入matplotlib库画图
import numpy as np  # 导入numpy库产生数据
n = 1024
X = np.random.normal(0, 1, n)  # 生成1024个标准正太分布点
Y = np.random.normal(0, 1, n)  # 生成1024个标准正太分布点
T = np.arctan2(Y, X)  # 给Y,X上色
plt.scatter(X, Y, s=75, c=T, alpha=0.5)
plt.xlim((-1.5, 1.5))
plt.ylim((-1.5, 1.5))
plt.xticks(())
plt.yticks(())

plt.show()
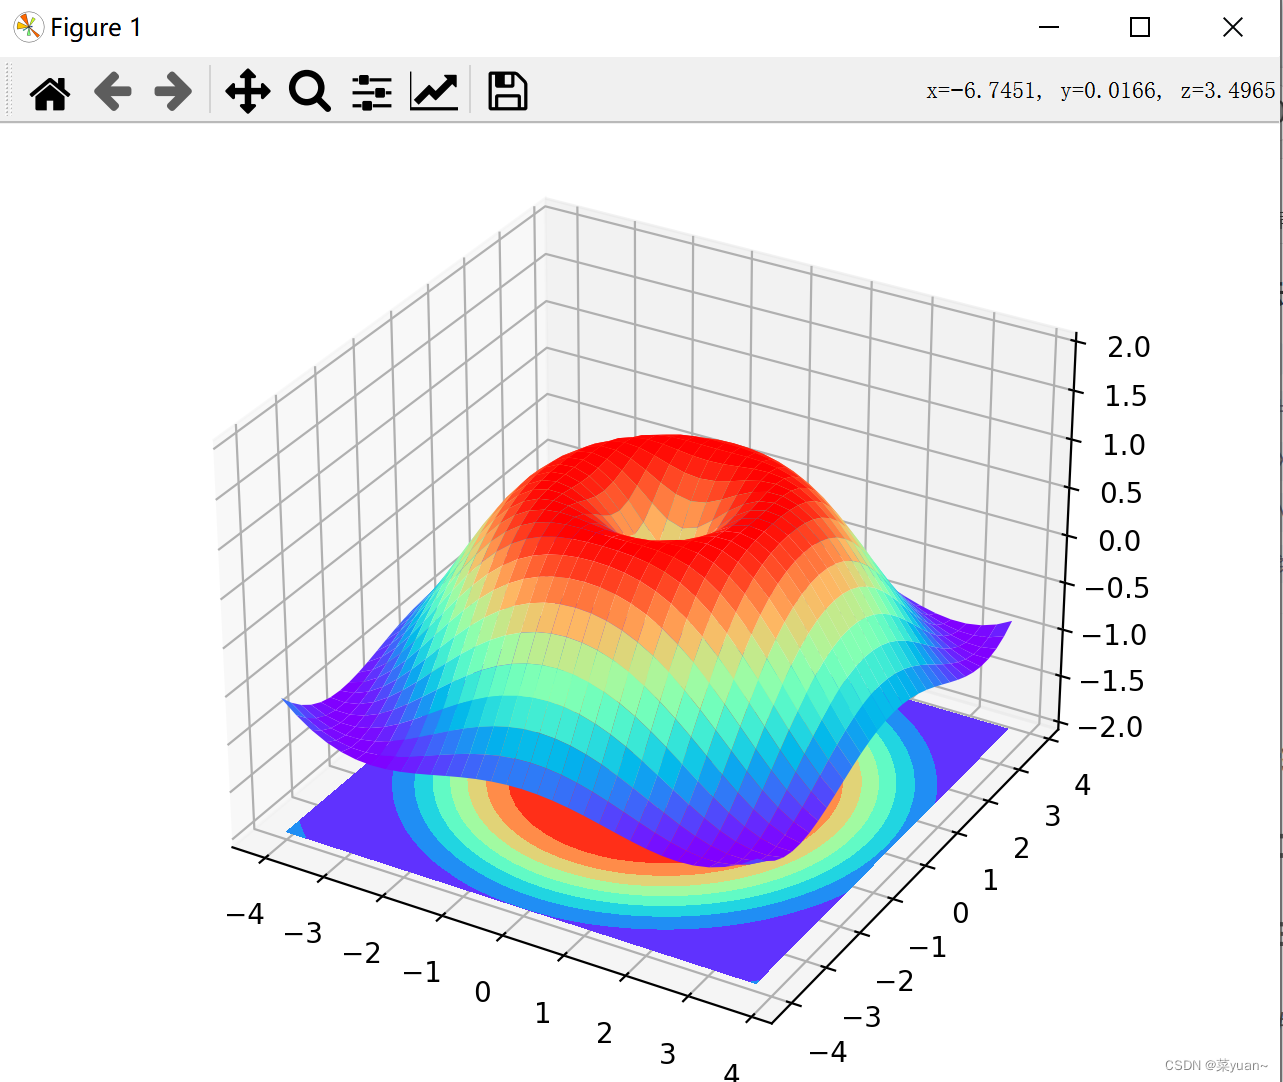
2. 三维图
import matplotlib.pyplot as plt  # 导入matplotlib库画图
import numpy as np  # 导入numpy库产生数据
from mpl_toolkits.mplot3d import Axes3D
fig = plt.figure()  # 画一张图
ax = Axes3D(fig)  # 采用3D坐标
X = np.arange(-4, 4, 0.25)  # 产生x数据
Y = np.arange(-4, 4, 0.25)  # 产生y数据
X, Y = np.meshgrid(X, Y)  # 生成网格
R = np.sqrt(X ** 2 + Y ** 2)  # 产生R数据
Z = np.sin(R)  # 产生Z数据

ax.plot_surface(X, Y, Z, rstride=1, cstride=1, cmap=plt.get_cmap('rainbow'))
# 画图,设置横纵跨度和颜色
ax.contourf(X, Y, Z, zdir='z', offset=-2, cmap='rainbow')
# 画等高线
ax.set_zlim3d(-2, 2)
# 限制Z坐标范围
plt.show()
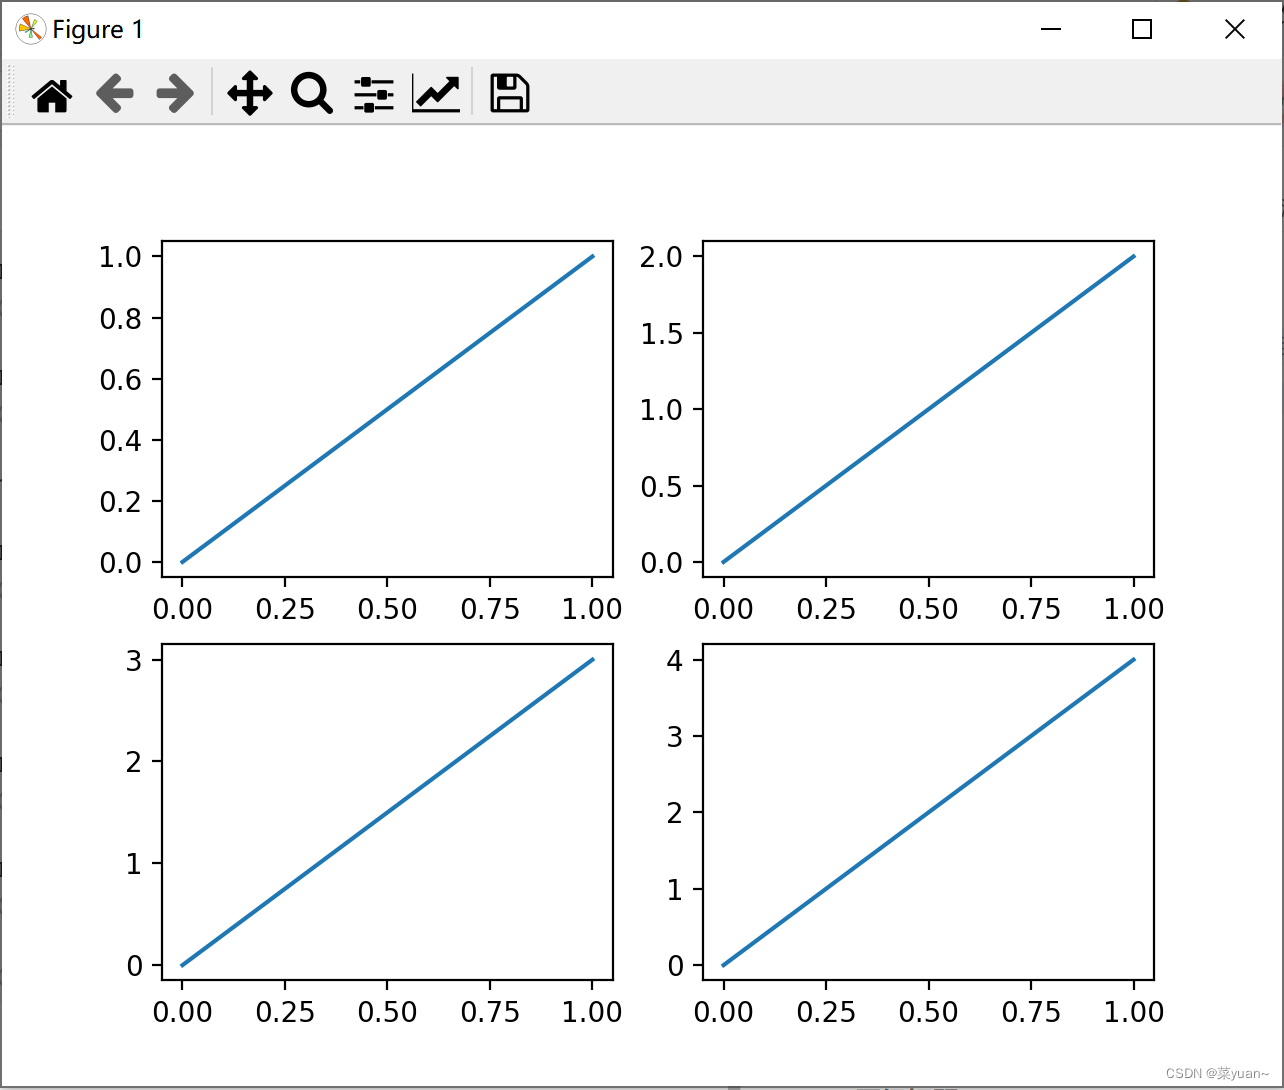
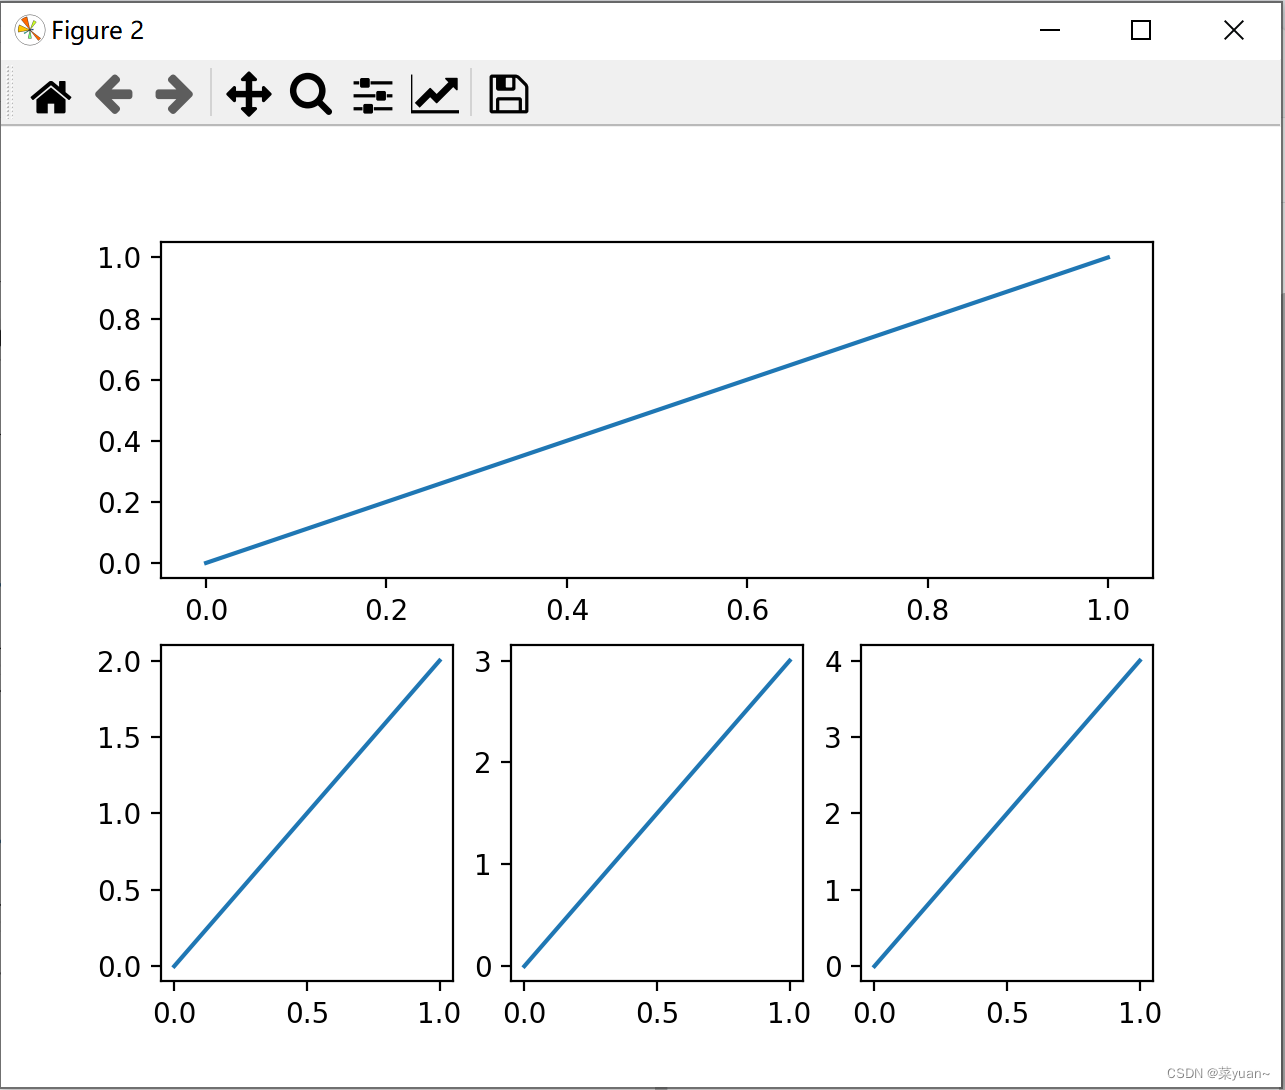
3. 子图
import matplotlib.pyplot as plt  # 导入matplotlib库画图
plt.figure(1)

plt.subplot(2, 2, 1)  # 将图分为2*2,其为第1个
plt.plot([0, 1], [0, 1])

plt.subplot(2, 2, 2)  # 将图分为2*2,其为第2个
plt.plot([0, 1], [0, 2])

plt.subplot(2, 2, 3)  # 将图分为2*2,其为第3个
plt.plot([0, 1], [0, 3])

plt.subplot(2, 2, 4)  # 将图分为2*2,其为第4个
plt.plot([0, 1], [0, 4])

plt.figure(2)

plt.subplot(2, 1, 1)  # 将图分为2*1,其为第1个
plt.plot([0, 1], [0, 1])

plt.subplot(2, 3, 4)  # 将图分为2*3,其为第4个
plt.plot([0, 1], [0, 2])

plt.subplot(2, 3, 5)  # 将图分为2*3,其为第5个
plt.plot([0, 1], [0, 3])

plt.subplot(2, 3, 6)  # 将图分为2*3,其为第6个
plt.plot([0, 1], [0, 4])

plt.show()