Linux中ps命令ps -aux 和ps -ef 参数解释
一、ps命令
ps命令用于显示当前进程的状态,类似于 windows 的任务管理器。
1.1 ps -aux
- 命令解释
显示所有包含其他使用者的进程
- ps -aux 的输出格式
USER PID %CPU %MEM VSZ RSS TTY STAT START TIME COMMAND
-
参数解释
- USER: 进程拥有者
- PID: pid
- %CPU: 占用的 CPU 使用率
- %MEM: 占用的记忆体使用率
- VSZ: 占用的虚拟记忆体大小
- RSS: 占用的记忆体大小
- TTY: 终端的次要装置号码 (minor device number of tty)
- STAT: 该行程的状态:
- D: 无法中断的休眠状态 (通常 IO 的进程)
- R: 正在执行中
- S: 静止状态
- T: 暂停执行
- Z: 不存在但暂时无法消除
- W: 没有足够的记忆体分页可分配
- <: 高优先序的行程
- N: 低优先序的行程
- L: 有记忆体分页分配并锁在记忆体内 (实时系统或捱A I/O)
- START: 行程开始时间
- TIME: 执行的时间
- COMMAND:所执行的指令
-
实例
- 查看所有进程
[root@localhost ~]# ps -aux
USER        PID %CPU %MEM    VSZ   RSS TTY      STAT START   TIME COMMAND
root          1  0.0  0.1 191412  4400 ?        Ss   19:03   0:02 /usr/lib/systemd/systemd --switched-root --system --deserialize 22
root          2  0.0  0.0      0     0 ?        S    19:03   0:00 [kthreadd]
root          4  0.0  0.0      0     0 ?        S<   19:03   0:00 [kworker/0:0H]
root          6  0.0  0.0      0     0 ?        S    19:03   0:00 [ksoftirqd/0]
root          7  0.0  0.0      0     0 ?        S    19:03   0:00 [migration/0]
root          8  0.0  0.0      0     0 ?        S    19:03   0:00 [rcu_bh]
root          9  0.0  0.0      0     0 ?        S    19:03   0:00 [rcu_sched]
root         10  0.0  0.0      0     0 ?        S<   19:03   0:00 [lru-add-drain]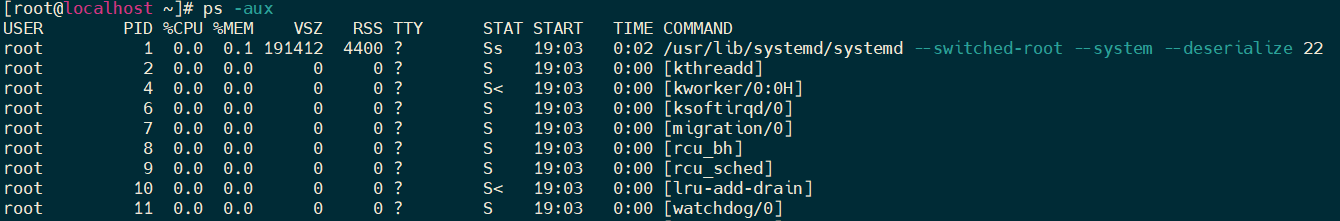
- 查找指定进程
[root@localhost ~]# ps -aux | grep tail
tom        3869  0.0  0.0 108304   680 pts/2    S+   20:10   0:00 tail
root       3872  0.0  0.0 112824   980 pts/1    R+   20:10   0:00 grep --color=auto tail
1.2 ps -ef
- 命令解释
列出全部进程的全部信息
- ps -ef 的输出格式
UID PID PPID C STIME TTY TIME CMD
-
参数解释
- UID:进程所属的用户ID
- PID:进程的进程号ID
- PPID:进程的父ID(启动此进程的其它进程)
- C:此进程的CPU占用率(百分比)
- STIME:进程的启动时间
- TTY:启动此进程的终端序号,如显示?,表示非终端启动
- TIME:进程占用CPU的时间
- CMD:进程对应的名称或启动路径或启动命令
-
实例
- 查看进程
[root@localhost ~]# ps -ef
UID         PID   PPID  C STIME TTY          TIME CMD
root          1      0  0 19:03 ?        00:00:02 /usr/lib/systemd/systemd --switched-root --system --deserialize 22
root          2      0  0 19:03 ?        00:00:00 [kthreadd]
root          4      2  0 19:03 ?        00:00:00 [kworker/0:0H]
root          6      2  0 19:03 ?        00:00:00 [ksoftirqd/0]
root          7      2  0 19:03 ?        00:00:00 [migration/0]
root          8      2  0 19:03 ?        00:00:00 [rcu_bh]
root          9      2  0 19:03 ?        00:00:00 [rcu_sched]
root         10      2  0 19:03 ?        00:00:00 [lru-add-drain]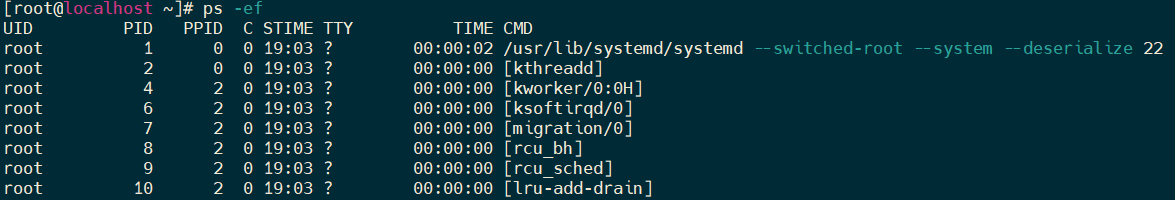
- 查找指定进程
[root@localhost ~]# ps -ef | grep tail
tom        3955   3827  0 20:18 pts/2    00:00:00 tail
root       4010   3960  0 20:19 pts/3    00:00:00 tail
root       4042   3065  0 20:21 pts/1    00:00:00 grep --color=auto tail