一、手把手教你搭建SpringCloud项目(一)图文详解,傻瓜式操作
二、手把手教你搭建SpringCloud项目(二)生产者与消费者
三、手把手教你搭建SpringCloud项目(三)集成Eureka服务注册中心
四、手把手教你搭建SpringCloud项目(四)Eureka集群版搭建
五、手把手教你搭建SpringCloud项目(五)生产者集群版搭建
六、手把手教你搭建SpringCloud项目(六)Eureka实现服务发现
七、手把手教你搭建SpringCloud项目(七)集成Consul服务注册中心
八、手把手教你搭建SpringCloud项目(八)集成Ribbon负载均衡器
九、手把手教你搭建SpringCloud项目(九)集成OpenFeign服务接口调用
十、手把手教你搭建SpringCloud项目(十)集成Hystrix之服务降级
十一、手把手教你搭建SpringCloud项目(十一)集成Hystrix之服务熔断
十二、手把手教你搭建SpringCloud项目(十二 )集成Hystrix之图形化Dashboard实时监控
十三、手把手教你搭建SpringCloud项目(十三 )集成Gateway新一代网关
十四、手把手教你搭建SpringCloud项目(十四 )集成Config分布式配置中心
十五、手把手教你搭建SpringCloud项目(十五)集成Bus消息总线
十六、手把手教你搭建SpringCloud项目(十六)集成Stream消息驱动
十七、手把手教你搭建SpringCloud项目(十七)集成Sleuth分布式链路跟踪
继续更新中,欢迎点赞关注!
在这篇手把手教你搭建SpringCloud项目(十)集成Hystrix之服务降级文章中,介绍了Hystrix的三大作用,其中服务降级和服务降级上两篇文章都学习完了,这篇文章就该轮到实时的监控,Hystrix除了隔离依赖服务的调用以外,还提供了准时的调用监控(Hystrix Dashboard)Hystrix会持续地记录所有通过Hystrix发起的请求的执行信息,并以统计报表和图形的形式展示给用户包括每秒执行多少请求多少成功,多少失败等。Netflix通过hystrix-metrics-event-stream项目实现了对以上指标的监控。Spring Cloud也提供了Hystrix Dashboard的整合,对监控内容转化成可视化界面。
废话不多说,直接肝! 大家一起熬,一起成大佬!加油!

新建module,名称为cloud-consumer-hystrix-dashboar服务,第一步修改pom.xml文件。主要是引入hystrix dashboard的依赖。如下图:
<?xml version="1.0" encoding="UTF-8"?>
<project xmlns="http://maven.apache.org/POM/4.0.0"
         xmlns:xsi="http://www.w3.org/2001/XMLSchema-instance"
         xsi:schemaLocation="http://maven.apache.org/POM/4.0.0 http://maven.apache.org/xsd/maven-4.0.0.xsd">
    <parent>
        <artifactId>mcroservice</artifactId>
        <groupId>com.study.springcloud</groupId>
        <version>1.0-SNAPSHOT</version>
    </parent>
    <modelVersion>4.0.0</modelVersion>

    <artifactId>cloud-consumer-hystrix-dashboar</artifactId>

    <dependencies>
        <!--hystrix dashboard-->
        <dependency>
            <groupId>org.springframework.cloud</groupId>
            <artifactId>spring-cloud-starter-netflix-hystrix-dashboard</artifactId>
        </dependency>
        <dependency>
            <groupId>com.study.springcloud</groupId>
            <artifactId>cloud-api-commons</artifactId>
            <version>${project.version}</version>
        </dependency>
        <dependency>
            <groupId>org.springframework.boot</groupId>
            <artifactId>spring-boot-starter-web</artifactId>
        </dependency>
        <dependency>
            <groupId>org.springframework.boot</groupId>
            <artifactId>spring-boot-starter-actuator</artifactId>
        </dependency>

        <dependency>
            <groupId>org.projectlombok</groupId>
            <artifactId>lombok</artifactId>
            <optional>true</optional>
        </dependency>
        <dependency>
            <groupId>org.springframework.boot</groupId>
            <artifactId>spring-boot-starter-test</artifactId>
            <scope>test</scope>
        </dependency>
        <dependency>
            <groupId>com.study.springcloud</groupId>
            <artifactId>cloud-api-commons</artifactId>
            <version>1.0-SNAPSHOT</version>
            <scope>compile</scope>
        </dependency>
    </dependencies>


</project>
新建配置yml文件,如下图:
server:
  port: 9003
新建主启动类,主要是加上@EnableHystrixDashboard注解,如下图:
package com.buba.springcloud;


import org.springframework.boot.SpringApplication;
import org.springframework.boot.autoconfigure.SpringBootApplication;
import org.springframework.cloud.netflix.hystrix.dashboard.EnableHystrixDashboard;

@SpringBootApplication
@EnableHystrixDashboard
public class HystrixDashboardMain {


    public static void main(String[] args) {


        SpringApplication.run(HystrixDashboardMain.class,args);
    }
}
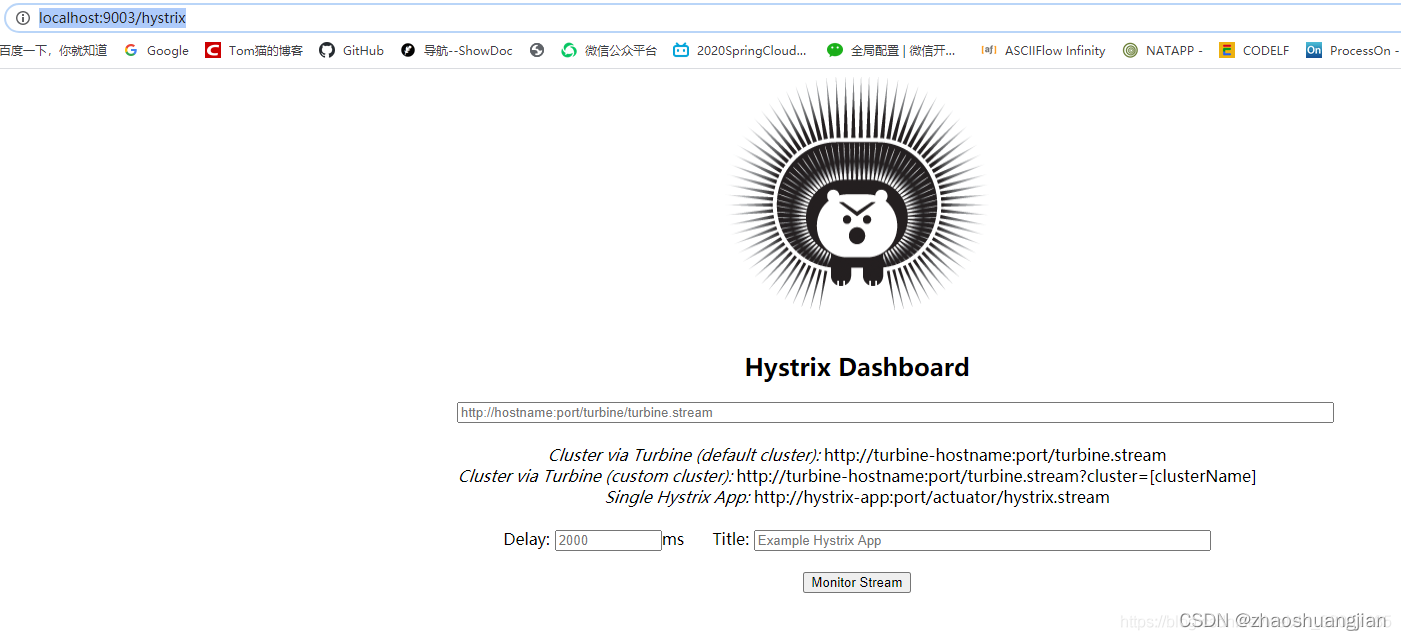
我们启动该服务,访问http://localhost:9003/hystrix,出现如下成功界面,说明配置成功。如下图:
hystrix-dashboar服务没有问题,该服务将持续监控生产者8001微服务cloud-provider-hystrix-payment8001,我们看看会出现什么的图表。那就需要修改cloud-provider-hystrix-payment8001服务,由于是hystrix的新版本,就需要在主启动类PaymentHystrixMain8001上指定监控路径,否则会报错。如下图:
package com.buba.springcloud;

import com.netflix.hystrix.contrib.metrics.eventstream.HystrixMetricsStreamServlet;
import org.springframework.boot.SpringApplication;
import org.springframework.boot.autoconfigure.SpringBootApplication;
import org.springframework.boot.web.servlet.ServletRegistrationBean;
import org.springframework.cloud.client.circuitbreaker.EnableCircuitBreaker;
import org.springframework.cloud.netflix.eureka.EnableEurekaClient;
import org.springframework.context.annotation.Bean;

import javax.swing.*;

@SpringBootApplication
@EnableEurekaClient
@EnableCircuitBreaker
public class PaymentHystrixMain8001 {


    public static void main(String[] args) {


        SpringApplication.run(PaymentHystrixMain8001.class, args);
    }
    /**
     * 此配置是为了服务监控而配置,与服务容错本身无观,springCloud 升级之后的坑
     * ServletRegistrationBean因为springboot的默认路径不是/hystrix.stream
     * 只要在自己的项目中配置上下面的servlet即可
     * @return
     */
    @Bean
    public ServletRegistrationBean getServlet(){


        HystrixMetricsStreamServlet streamServlet = new HystrixMetricsStreamServlet();
        ServletRegistrationBean<HystrixMetricsStreamServlet> registrationBean = new ServletRegistrationBean<>(streamServlet);
        registrationBean.setLoadOnStartup(1);
        registrationBean.addUrlMappings("/hystrix.stream");
        registrationBean.setName("HystrixMetricsStreamServlet");
        return registrationBean;
    }
}
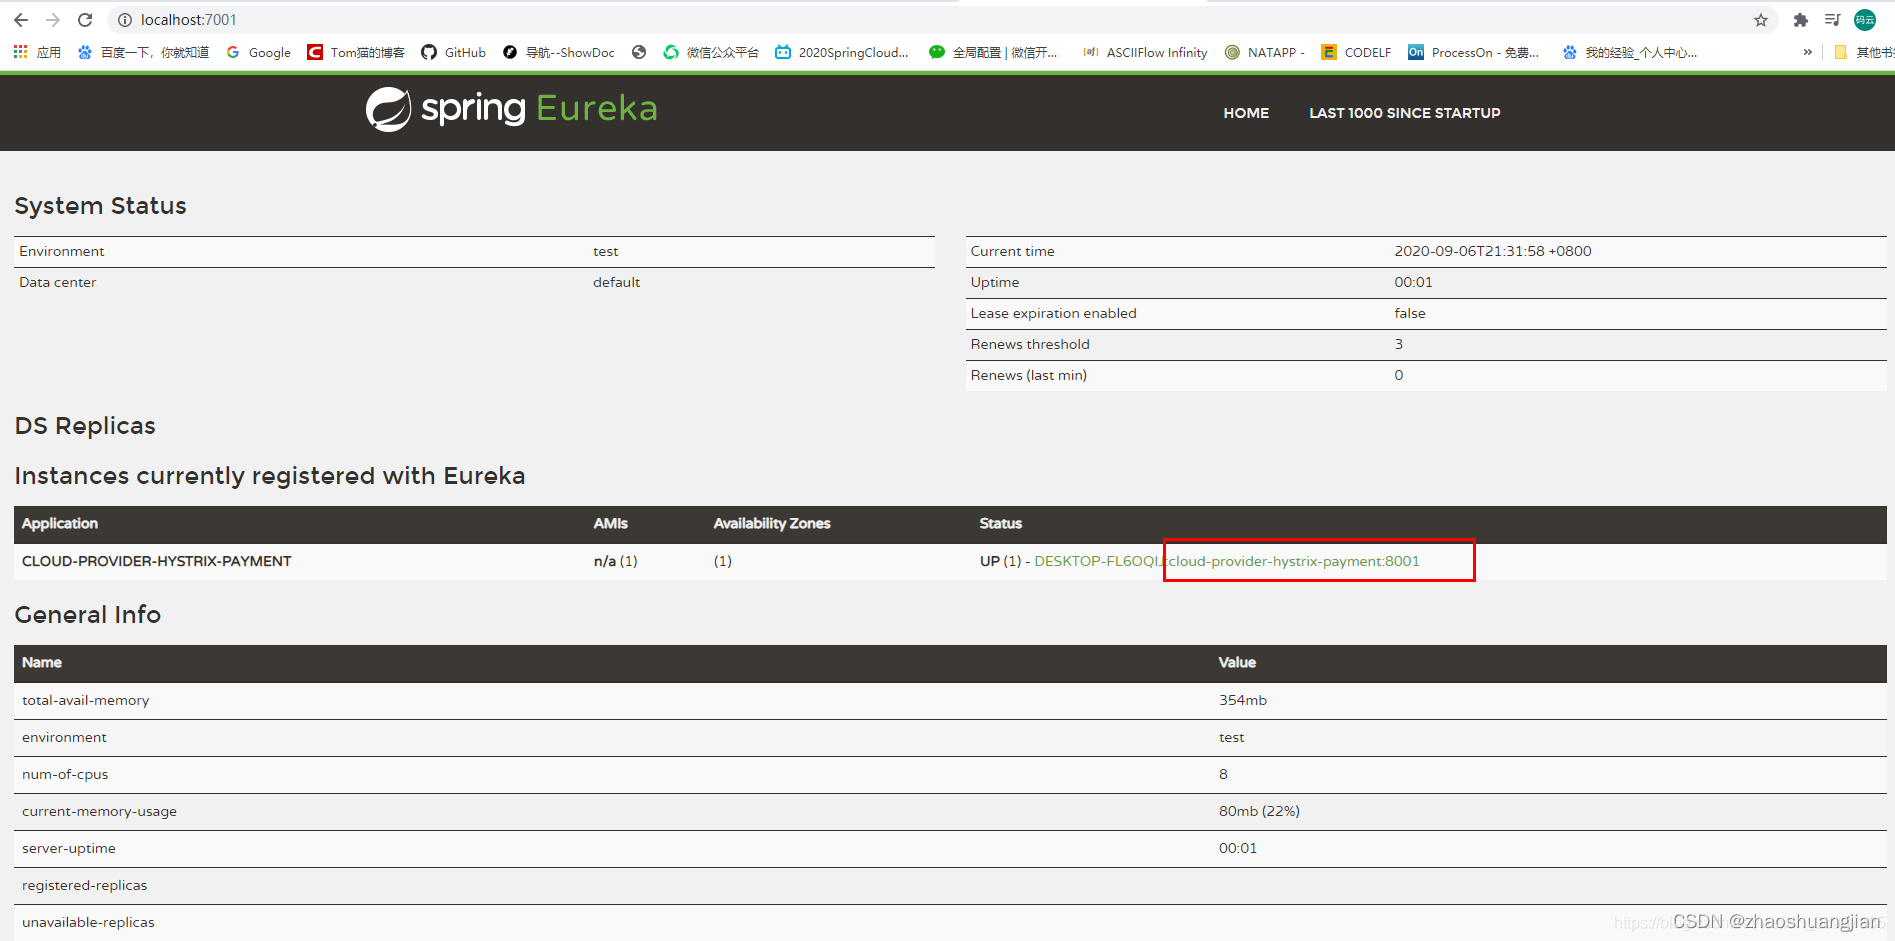
那接下来启动Eureka7001服务,然后再启动生产者服务8001,确保产者服务8001注册到了Eureka中,如下图:
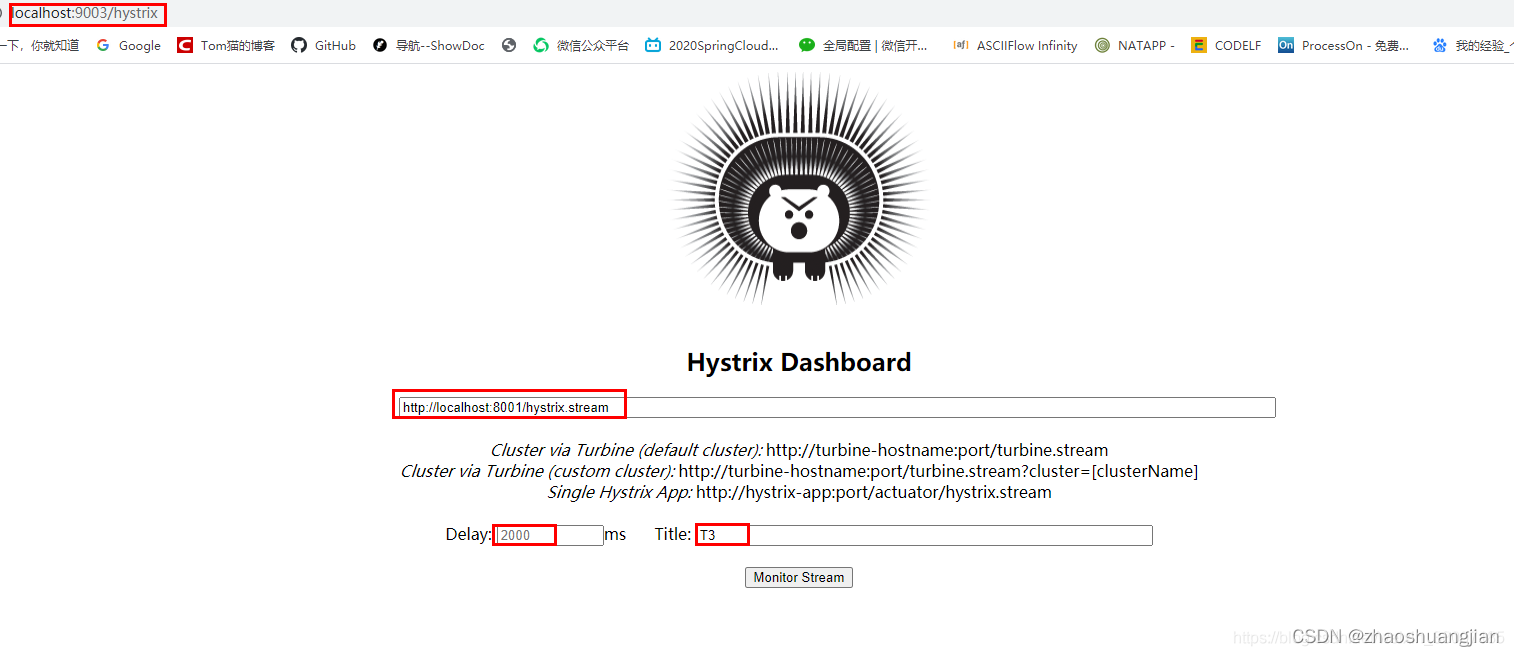
然后启动监控服务9003来监控生产者服务8001,填写监控路径,如下图:
配置成功后出现如下的界面:
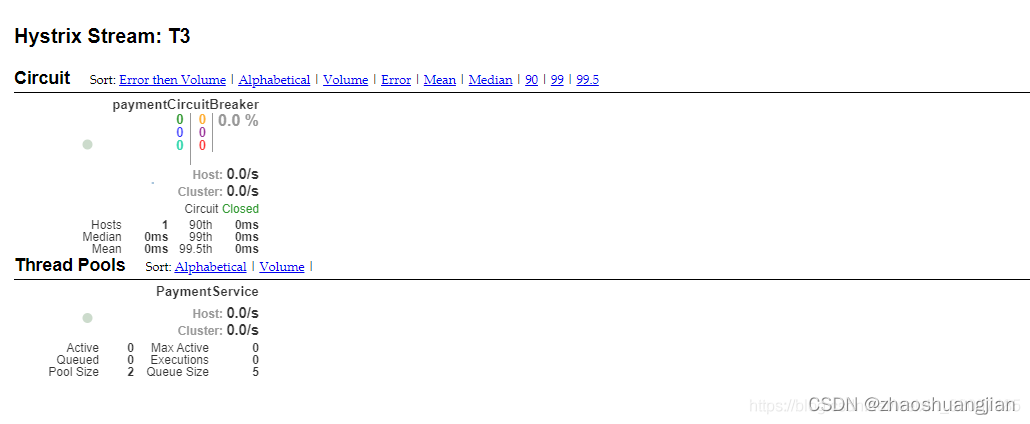
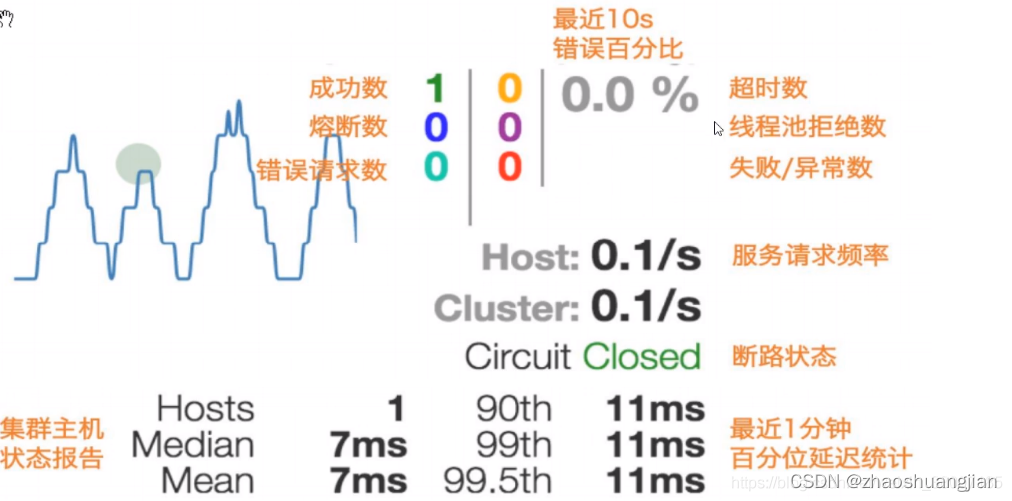
我们先了解一下每个显示参数的意义,我们称之为7色1球1线。如下图:
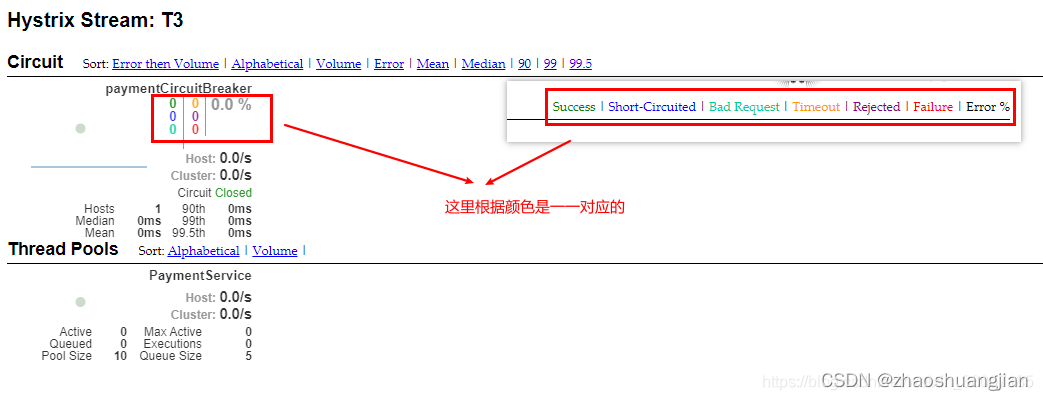
左侧的实心圆,它共有两种含义,它的颜色的变化代表了实例的健康程度,它的健康从绿色<黄色<橙色<红的递减,该实心圆除了颜色的变化之外,它的大小也会根据实例的请求流量发生变化,流量越大该实心圆也就越大,所以通过实心圆的展示,就可以在大量的实例中快速的发现故障实例和高压力实例。
左侧的曲线是用来记录2分钟内流量的相对变化,可以通过它来观察到流量的上升和下降趋势。
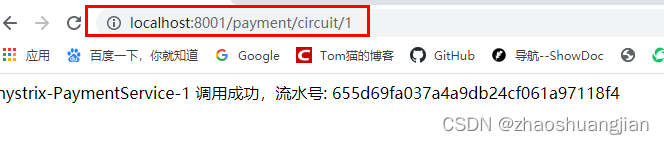
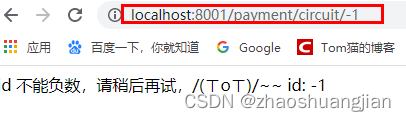
我们测试http://localhost:8001/payment/circuit/1和http://localhost:8001/payment/circuit/-1路径,因为传递的参数id的不同,一个是正数,一个是负数,所以一个会返回成功的流水号,一个返回运行时异常的提示,如下图:
那接下我们疯狂的点击访问http://localhost:8001/payment/circuit/1路径,看一下该方法的图表,如下图:
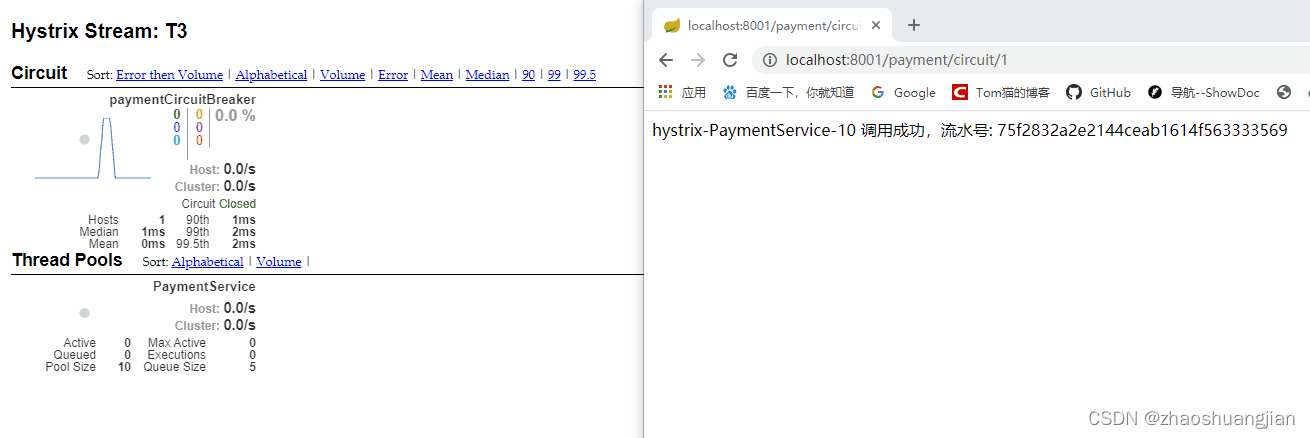
我们进行分析一下左侧的实心圆,它的颜色为绿色,说明了当前的实例的很健康,没有任何的故障。也随着我们疯狂的点击访问请求,它的逐渐变大,说明当前的流量也在变大,当随着请求变少,圆也会慢慢变小。左侧的曲线是随着我们请求的变多,一直是上升的状态,当请求变少,会呈下降趋势。也可以看到成功请求到了34次,断路器目前是关闭的状态(Circuit Closed)。
那我们接下来疯狂访问http://localhost:8001/payment/circuit/-1路径,看一下该方法的图表,如下图:
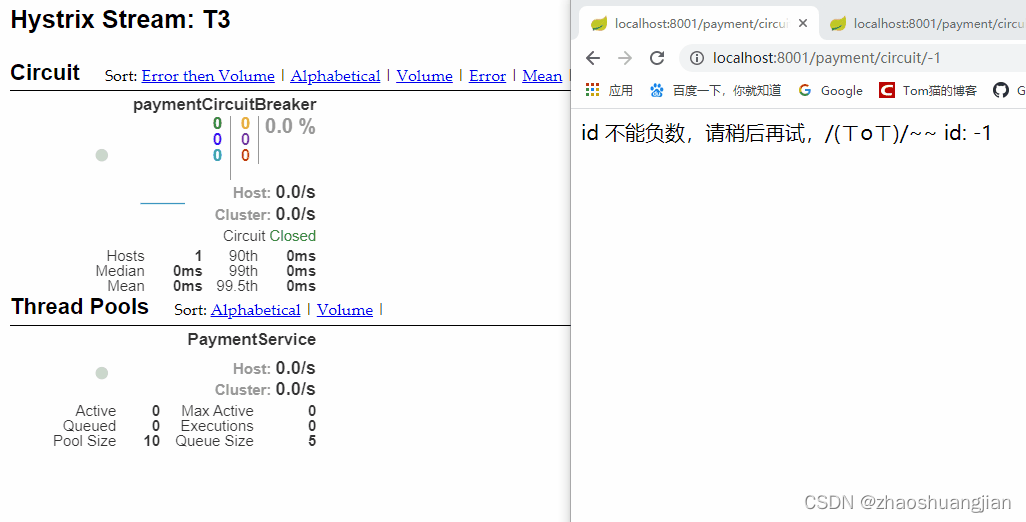
由于我们一直访问错误,左侧的实心圆,它的颜色由绿色变为了红色,说明了当前的实例不健康,也随着我们疯狂的点击访问请求,它的逐渐变大,说明当前的流量也在变大。左侧的曲线是随着我们请求的变多,一直是上升的状态,当请求变少,会呈下降趋势。也随着我们疯狂的点击访问请求,断路器由原先的Close变为了Open。出现了服务熔断,熔断数一直在增加。而我们10秒中访问的失败数一直在增加,失败率100%。
下面我们先疯狂访问返回正确的http://localhost:8001/payment/circuit/1 的路径,然后在访问返回错误信息的路径 http://localhost:8001/payment/circuit/-1,然后再访问正确的http://localhost:8001/payment/circuit/1 的路径,我们再看一下,如下图:
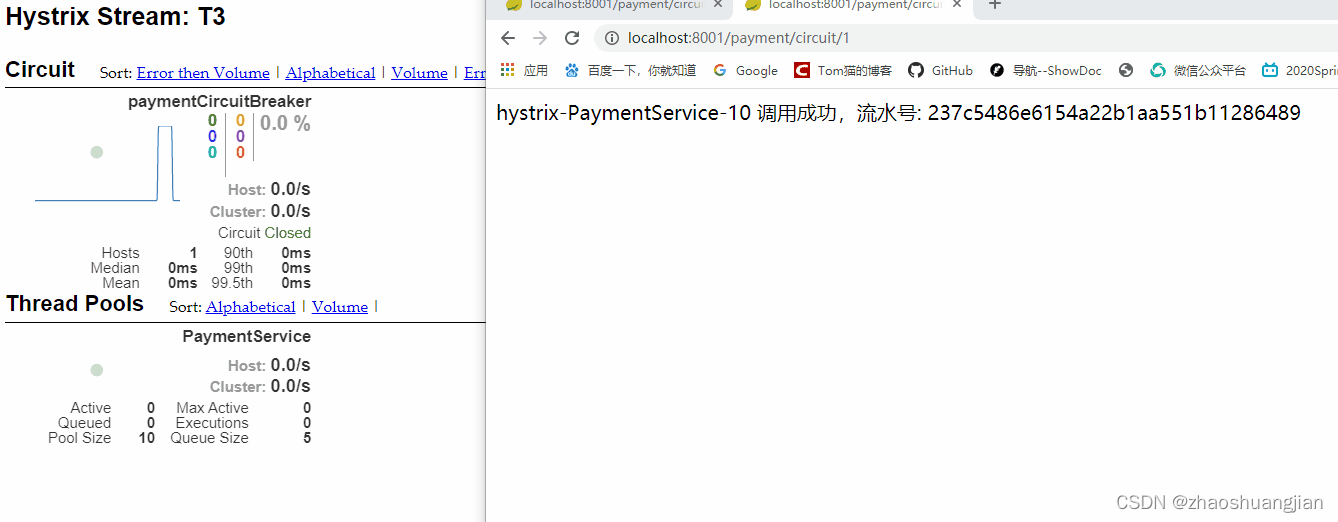
我们可以看到开始一直访问正确的路径,实心圆的颜色是绿的的,错误率和熔断数都是0,断路器也是Closed的状态,但是随着我们点击错误的路径进行访问,实心圆的颜色发生了变化从绿色>黄色>橙色>红,一直到红色,失败率也在增加,熔断数也在增加,当达到我们配置失败率达到60%的时候,断路器由Closed变为了Open的状态,当前服务进行降级和熔断,当我们再换成正确的路径,刚开始也是返回错误的信息,但是随着次数的增加,失败率也在减少,熔断数也在减少,当前断路器的状态为半开状态,随着正确的访问,断路器的状态变为全开状态。
到这里Hystrix之图形化Dashboard实时监控就学习完毕啦,so easy!

下一篇文章继续学习新一代网关GateWay!文章持续更新,欢迎关注!