every blog every motto: You can do more than you think.
https://blog.csdn.net/weixin_39190382?type=blog
0. 前言
不规则多边形的主轴线 计算方法与显示方法
1. 正文
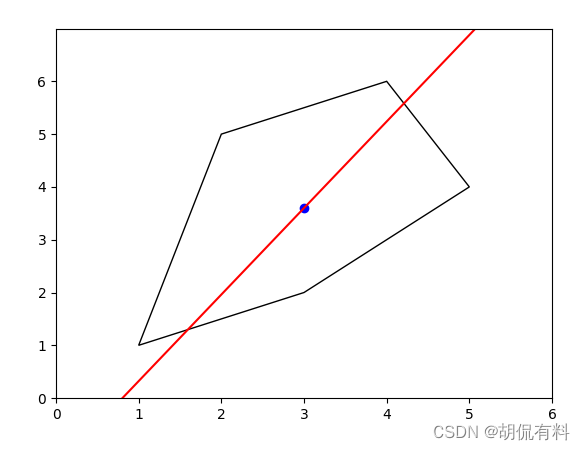
主轴线的计算与显示
首先,我们计算多边形的中心点,然后将顶点坐标相对于中心点进行平移,以便使多边形的中心点位于原点。接下来,我们计算协方差矩阵,并使用特征值分解得到特征向量和特征值。最后,我们选择具有最大特征值的特征向量作为主轴方向。
import numpy as np
import matplotlib.pyplot as plt
# # 定义不规则多边形的顶点坐标
vertices = [(1, 1), (3, 2), (5, 4), (4, 6), (2, 5)]
# 定义月牙形状多边形的顶点坐标
# vertices = [(1, 1), (2.5, 0), (4, 1), (4, 3), (2.5, 4), (1, 3)]
# vertices = [(1, 2), (3, 4), (5, 4), (7, 2), (6, 0), (2, 0)]
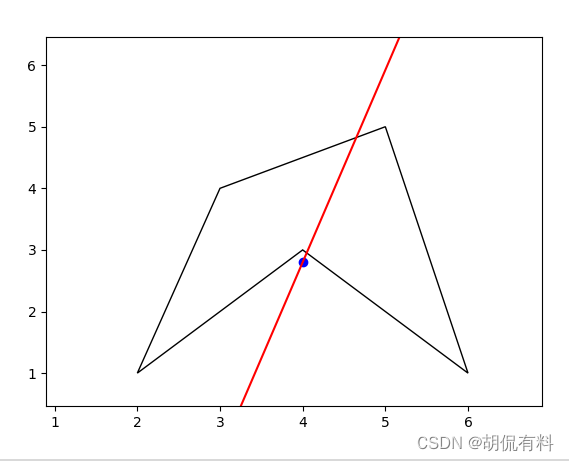
# vertices = [(2, 1), (4, 3), (6, 1), (5, 5), (3, 4)]
# 计算多边形的中心点
center = np.mean(vertices, axis=0)
# 将顶点坐标相对于中心点进行平移
translated_vertices = vertices - center
# 计算协方差矩阵
covariance_matrix = np.cov(translated_vertices.T)
# 使用特征值分解获取特征向量和特征值
eigenvalues, eigenvectors = np.linalg.eig(covariance_matrix)
# 找到最大特征值对应的特征向量作为主轴方向
max_eigenvalue_index = np.argmax(eigenvalues)
main_axis_direction = eigenvectors[:, max_eigenvalue_index]
# 绘制不规则多边形
plt.figure()
polygon = plt.Polygon(vertices, fill=None, edgecolor='black')
plt.gca().add_patch(polygon)
# 绘制主轴方向
start_point = center - main_axis_direction * 10
end_point = center + main_axis_direction * 10
plt.plot([start_point[0], end_point[0]], [
start_point[1], end_point[1]], color='red')
# 绘制中心点
plt.scatter(center[0], center[1], color='blue')
# 设置坐标轴范围
plt.xlim(min(translated_vertices[:, 0]) - 1,
max(translated_vertices[:, 0]) + 1)
plt.ylim(min(translated_vertices[:, 1]) - 1,
max(translated_vertices[:, 1]) + 1)
# 显示图形
plt.show()