是的,ChatGPT可以直接写代码! ChatGPT支持许多编程语言,包括Python,JavaScript和C ++等。您可以在消息框中键入您的代码,并使用/code命令将其格式化为代码块,以便ChatGPT更好地理解您的请求。
<!DOCTYPE html>
<html>
<head>
<meta charset="utf-8">
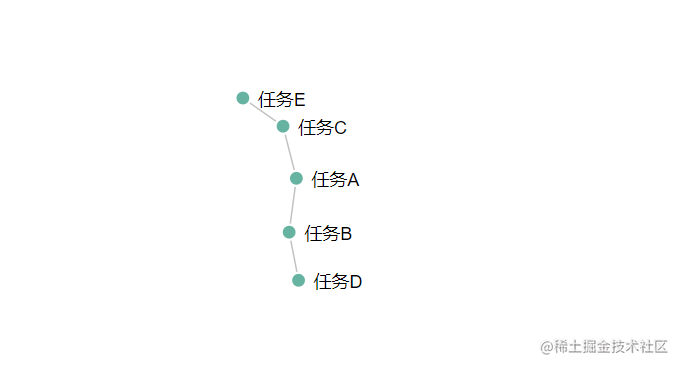
<title>D3.js流程图示例</title>
<script src="https://d3js.org/d3.v6.min.js"></script>
</head>
<body>
<svg width="600" height="400"></svg>
<script>
// 定义数据
const nodes = [
{
id: 'A', label: '任务A' },
{
id: 'B', label: '任务B' },
{
id: 'C', label: '任务C' },
{
id: 'D', label: '任务D' },
{
id: 'E', label: '任务E' },
];
const links = [
{
source: 'A', target: 'B' },
{
source: 'A', target: 'C' },
{
source: 'B', target: 'D' },
{
source: 'C', target: 'E' },
];
// 定义图表尺寸
const width = 600;
const height = 400;
// 创建svg元素
const svg = d3.select('svg');
// 创建力导向图模拟器
const simulation = d3.forceSimulation(nodes)
.force('link', d3.forceLink(links).id(d => d.id))
.force('charge', d3.forceManyBody())
.force('center', d3.forceCenter(width / 2, height / 2));
// 创建连线
const link = svg.append('g')
.attr('stroke', '#999')
.attr('stroke-opacity', 0.6)
.selectAll('line')
.data(links)
.join('line')
.attr('stroke-width', d => Math.sqrt(d.value));
// 创建节点
const node = svg.append('g')
.attr('stroke', '#fff')
.attr('stroke-width', 1.5)
.selectAll('circle')
.data(nodes)
.join('circle')
.attr('r', 5)
.attr('fill', '#69b3a2')
.call(drag(simulation));
// 创建节点标签
const label = svg.append('g')
.attr('font-family', 'sans-serif')
.attr('font-size', 12)
.selectAll('text')
.data(nodes)
.join('text')
.text(d => d.label)
.attr('x', 8)
.attr('y', 4);
// 定义拖拽函数
function drag(simulation) {
function dragstarted(event) {
if (!event.active) simulation.alphaTarget(0.3).restart();
event.subject.fx = event.subject.x;
event.subject.fy = event.subject.y;
}
function dragged(event) {
event.subject.fx = event.x;
event.subject.fy = event.y;
}
function dragended(event) {
if (!event.active) simulation.alphaTarget(0);
event.subject.fx = null;
event.subject.fy = null;
}
return d3.drag()
.on('start', dragstarted)
.on('drag', dragged)
.on('end', dragended);
}
// 更新节点和连线位置
simulation.on('tick', () => {
link
.attr('x1', d => d.source.x)
.attr('y1', d => d.source.y)
.attr('x2', d => d.target.x)
.attr('y2', d => d.target.y);
node
.attr('cx', d => d.x)
.attr('cy', d => d.y);
label
.attr('x', d => d.x + 10)
.attr('y', d => d.y + 5);
});
</script>
</body>
</html>