一界面展示:
1.主页:
点击链接即可跳转对应的疫情地图可视化界面,加强可交互功能。
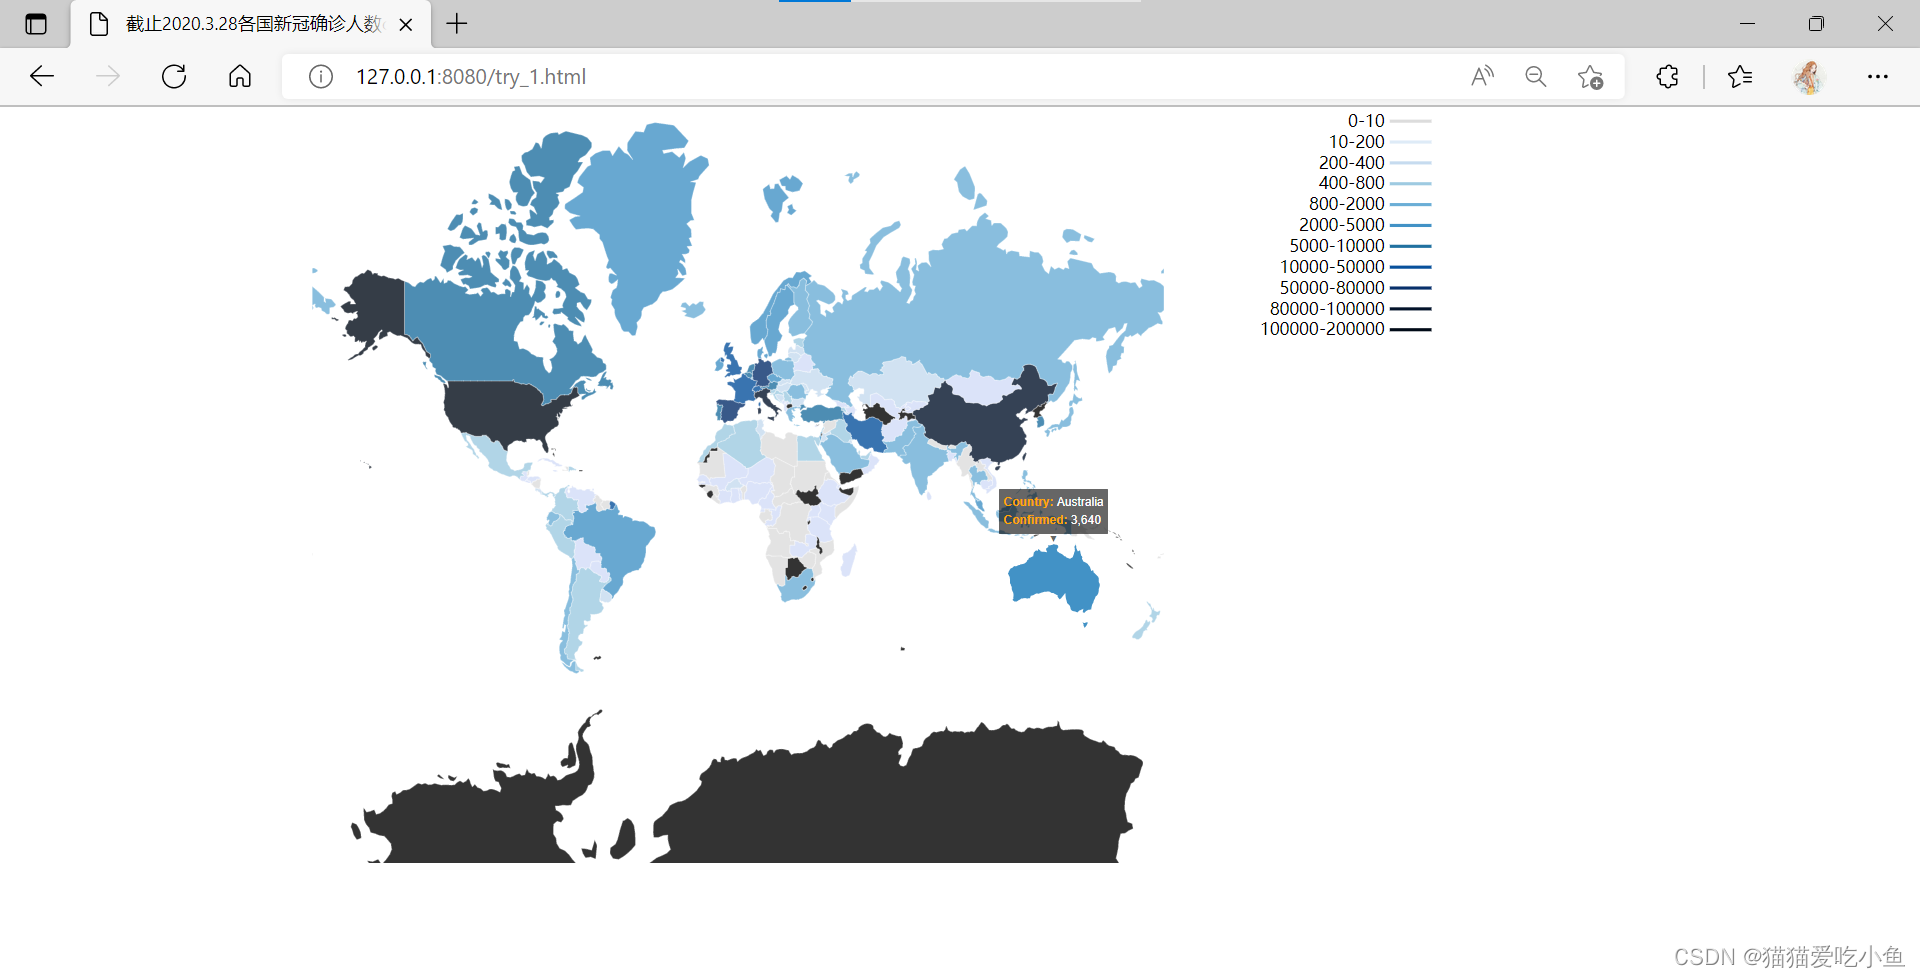
2.截止2020.3.28各国新冠确诊人数—地图可视化结果如下(有几个国家数据缺少或实在无法匹配上名称,数据缺失,地图中显示的为纯黑色区域;右上角为图例):
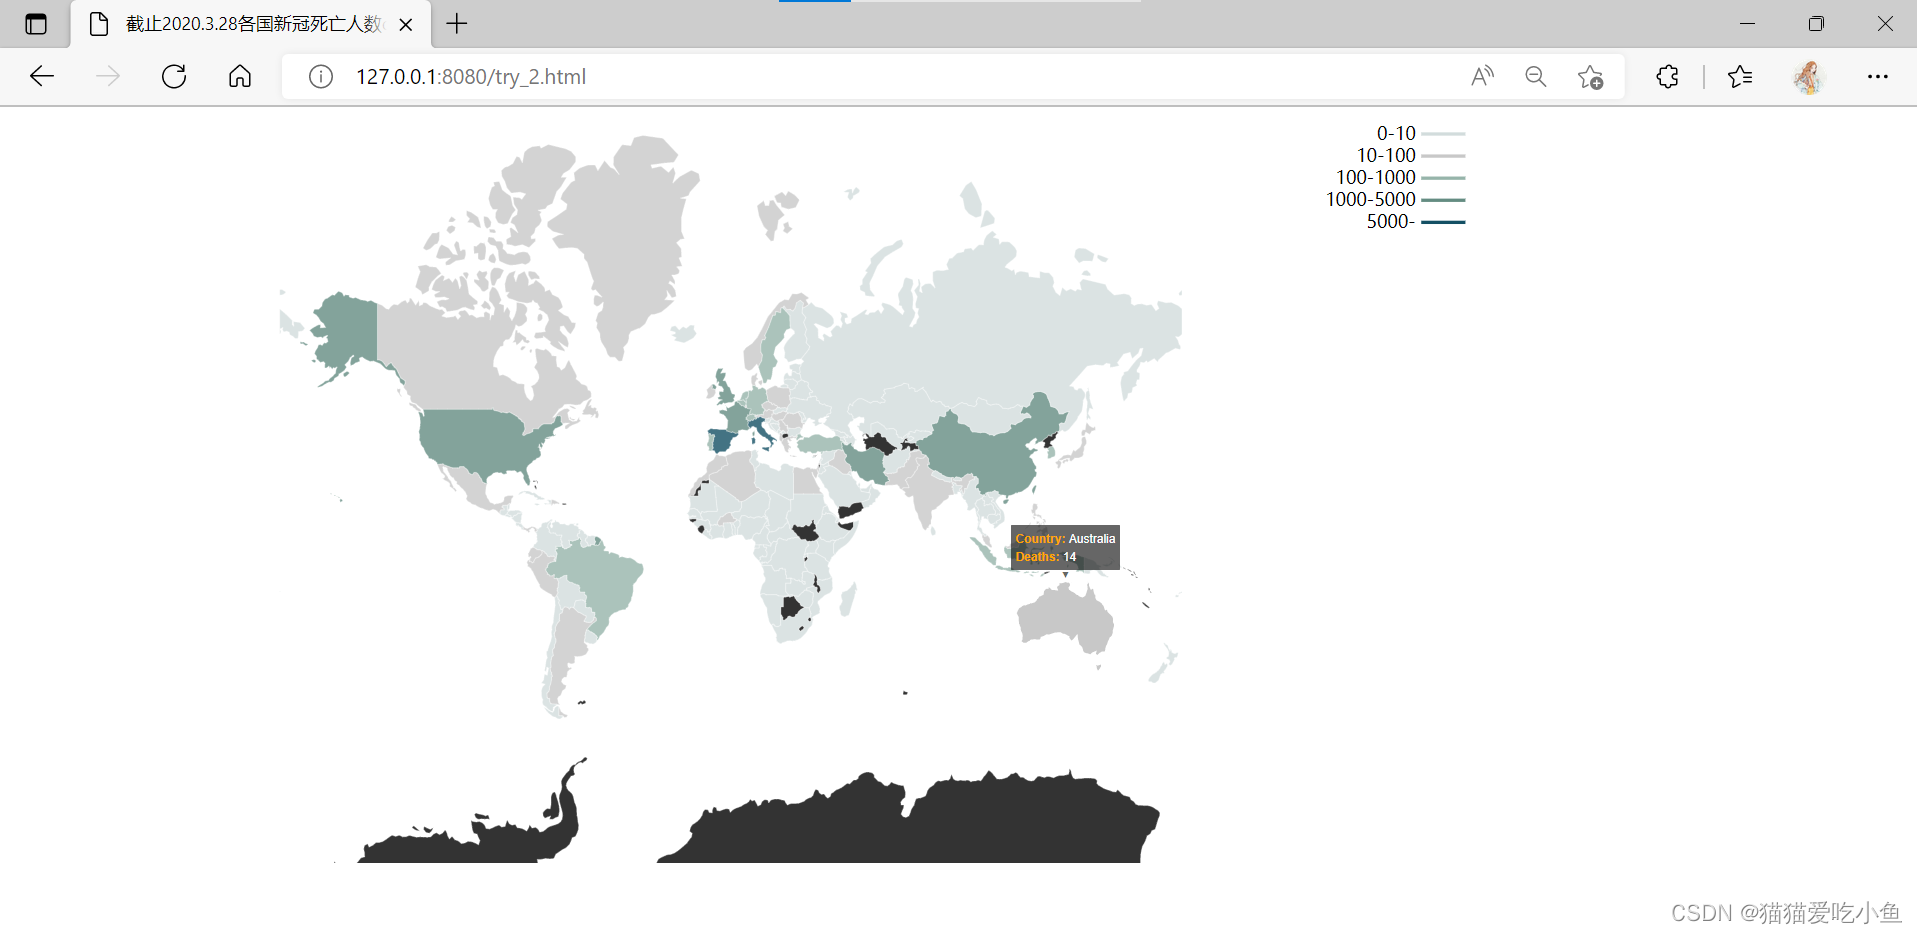
3.截止2020.3.28各国新冠死亡人数—地图可视化结果如下:
4.截止2020.3.28各国新冠治愈人数—地图可视化结果如下:

二数据处理:
1.数据匹配
covid19 - 03-28-2020.csv表格中有些国家的名称和world_countries.json文件中的国家名称不一致,需要手动更换表格中的内容,或者在代码中进行等价转换。这里我选择的是不改变表格的内容,上网查询国家名称信息,手动调节代码,使之信息一致。
例如,在遍历covid19 - 03-28-2020.csv中使国家名称与world_countries.json中的一致:
       Confirmed.forEach(function (d) {

            if(d.Country_Region=="Korea, South")

               d.Country_Region="South Korea"

            if(d.Country_Region=="United Kingdom")

               d.Country_Region="England"

            if(d.Country_Region=="Taiwan")

                d.Country_Region="China"

            if(d.Country_Region=="Congo (Brazzaville)")

               d.Country_Region="Democratic Republic of the Congo"

            if(d.Country_Region=="Congo (Kinshasa)")

               d.Country_Region="Republic of the Congo"

            if(d.Country_Region=="Tanzania")

               d.Country_Region="United Republic of Tanzania"

            if(d.Country_Region=="Cote d'Ivoire")

               d.Country_Region="Ivory Coast"

            if(d.Country_Region=="Serbia")

               d.Country_Region="Republic of Serbia"

            confirmedById[d.Country_Region] +=Number(d.Confirmed);

        });
以及在遍历world_countries.json中使国家名称与covid19 - 03-28-2020.csv中的一致:
若表格中没有对应国家的疫情数据,则填充地图的值为NaN,地图上的该国家的颜色绘制为纯黑色。
2.图例制作:
根据我们地图填充颜色时的设定:
 var color = d3.scaleThreshold()

.domain([0, 10, 100, 500, 1000,10000,50000])

.range(["rgb(247,251,255)","rgb(220,220,220)","rgb(190,190,190)","rgb(160,170,180)","rgb(120,130,150)", "rgb(100,100,100)","rgb(20,80,100)"]);
来设定图例:
var data_legend = [
        {"name":"0-10",
        "color":"rgb(247,251,255)"
        },{
        "name":"10-100",
        "color":"rgb(220,220,220)"
        },{
        "name":"100-500",
        "color":"rgb(190,190,190)"
        },{
        "name":"500-1000",
        "color":"rgb(160,170,180)"
        },{
        "name":"1000-10000",
        "color":"rgb(120,130,150)"
        },{
        "name":"10000-50000",
        "color":"rgb(100,100,100)"
        },{
        "name":"50000",
        "color":"(20,80,100)"
        }];
    var legend = svg.selectAll(".legend")
        .data(data_legend)
        .enter().append("g")
        .attr("class", "legend")
        .attr("transform", function(d, i) { return "translate(-30," + (i * 20 + 130) + ")"; });
    legend.append("rect")
        .attr("x", width - 225-100)
        .attr("y", 138+20)
        .attr("width", 40)
        .attr("height", 3)
        .style("fill", function(d){
         return d.color
         });
    legend.append("text")
        .attr("x", width - 230-100)
        .attr("y", 145+20)
        .style("text-anchor", "end")
        .text(function(d) {
        return d.name;
        });
如有完整代码需求,请私信发邮箱哈