实现的方法
1.使用第三方的Qt库,qcustomplot库
2.建立一个窗体作为子窗口
3.添加曲线
4.对需要的属性进行设置
实现过程
首先从网上下载第三方的库qcustonplot,然后建立一个工程,把qcustonplot相对应的.cpp,.h文件添加上
下面贴出对应的工程.h代码
#ifndef WIDGET_H
#define WIDGET_H

#include <QtGui/QWidget>
#include <qmath.h>
#include <QTimer>
#include <qcustomplot/qcustomplot.h>
#include <QString>
class Widget : public QWidget
{
    Q_OBJECT

public:
    Widget(QWidget *parent = 0);
    ~Widget();
private:
    double value0;
    double key;
    QString  CureName;//设置曲线名字
    QCustomPlot *customPlot;
    QCPItemText *textLabel;
    QCPItemText *textLabel2;

private slots:
   void realtimeDataSlot();
};

#endif // WIDGET_H
其中添加来实现定时的动态刷新
double value0; //存放的是关于曲线的数据值
double key; //与控制轴数据相关
QString CureName;//设置曲线名字
QCustomPlot *customPlot;
QCPItemText *textLabel; //可以显示文本
QCPItemText *textLabel2;
下面将一点点的来描述.cpp中的内容
首先
#include "widget.h"
#include <QLabel>
Widget::Widget(QWidget *parent)
: QWidget(parent)
{
//建立一个曲线图表
customPlot = new QCustomPlot(this);
customPlot->setObjectName(QString::fromUtf8("customPlot"));
customPlot->setBackground(Qt::white); //设置背景颜色
customPlot->setGeometry(QRect(130, 120, 800, 400)); //设置 位置 高度
}
首先使用 QCustomPlot *customPlot; 来实例化一个对象,
随后设置名字,设置背景色,设置显示的位置。和大小。顺便说一下setGeometry函数在存在布局的情况下是无法是指大小的(要注意)。
设置完毕后会显示默认的坐标值。如下图

这样一个坐标以就已经建好了
下面就是添加曲线了
customPlot->plotLayout()->insertRow(0);
customPlot->plotLayout()->addElement(0, 0, new QCPPlotTitle(customPlot, "Cure")); //插入一行并且添加一个标题元素
customPlot->addGraph();
customPlot->graph(0)->setPen(QPen(Qt::blue));
customPlot->graph(0)->setBrush(QBrush(QColor(240, 255, 200)));
在刚刚建立的坐标系中可以显示多条曲线。insertRow(0)表示只是添加一条
第二行 设置坐标的标题,addElement的参数的含义 可以看具体的函数定义(在这里 是 (x,y)的坐标 ,和显示的标题字符)
第三行是添加曲线的函数
第四行 设置线色
第五行 设置填充的颜色,在此程序中是曲线与时间轴围成的部分
这样曲线的部分就设置好了

接下来设置坐标轴的配置
//x坐标轴设置
customPlot->xAxis->setLabel(“time:”);//设置坐标名字
customPlot->xAxis->setLabelColor(Qt::black);//设置坐标颜色
customPlot->xAxis->setLabelPadding(1);//设置坐标轴名称文本距离坐标轴刻度线距离
//y坐标轴设置
customPlot->yAxis->setAutoTickStep(false); ////设置是否自动分配刻度间距
customPlot->yAxis->setTickStep(25);// 数值的大小是y轴的一半,设置刻度间距
customPlot->yAxis->setLabelColor(QColor(0, 160, 230)); //设置文本颜色
customPlot->yAxis->setRange(-50,50); //y轴的范围
customPlot->xAxis2-> setTicks(false); //不显示坐标轴
customPlot->yAxis2-> setTicks(false); //不显示坐标轴
程序中对每行都做了注释,每行的具体功能不再叙述。只是做几点补充 xAxis xAxis2 yAxis yAxis2  分别表示的是坐标系的四个边。

接下来要用到定时,来时线动态的效果
下面的两段代码分别是触发的条件,和执行的动作
value0=1; //测试用到
key=7;
QTimer *dataTimer = new QTimer(this);
connect(dataTimer, SIGNAL(timeout()), this, SLOT(realtimeDataSlot()));
dataTimer->start(1000);
定时执行的内容- 1
void Widget::realtimeDataSlot()
{
key++;
static double lastPointKey = 0;
if (key-lastPointKey > 0.01) // at most add point every 10 ms
{
//测试用
if(value0>0 && value0<10)
{
value0=value0+5;
}
else {value0=5;}
    customPlot->graph(0)->addData(key, value0);
    lastPointKey = key;

}

textLabel->setText("Current:"+QString::number( value0 )); //显示当前值
customPlot->xAxis->setAutoTickStep(false);  ////设置是否自动分配刻度间距
customPlot->xAxis->setTickStep(1);// 数值的大小是y轴的一半,设置刻度间距
customPlot->xAxis->setRange(key,8,Qt::AlignRight);
customPlot->replot();
}
上面测试用的部分,就是周期的给alue0赋值,来改变曲线。时间轴可以设置成系统时间

这里只想强调     customPlot->xAxis->setRange(key,8,Qt::AlignRight); 这行代码,要想实现动态,就要不仅不断地改变y值,还要改变x值的内容。如果不改变x轴,那么超过当前的x坐标轴就不会动态显示了。AlignRight的作用是右对齐的方式显示,也是很关键的,选择左对齐是没有数据的,不是因为不显示,因为只能够显示当前的点,就是一个数据点。

这样一个动态曲线就绘制好了

下面在添加一个实时显示当前值的功能
//显示当前数值文本
textLabel = new QCPItemText(customPlot);
customPlot->addItem(textLabel);
textLabel->setPositionAlignment(Qt::AlignTop); //布局内控件
textLabel->position->setType(QCPItemPosition::ptAxisRectRatio); //按比例设置位置,依赖于坐标轴矩形大小,区别于按视口大小
textLabel->position->setCoords(0, 0); // place position at center/top of axis rect
textLabel->setFont(QFont(font().family(), 15));
textLabel->setPen(QPen(Qt::black));
//在定时函数中
textLabel->setText("Current:"+QString::number( value0 )); //显示当前值
关键的代码   textLabel->position->setCoords(0, 0); setCoords函数显示的坐标的区间是[0,1].(0.5,0.5)就是坐标系的中心位置。

widget.cpp文件如下
include “widget.h”
include
Widget::Widget(QWidget *parent)
: QWidget(parent)
{
//建立一个曲线图表
customPlot = new QCustomPlot(this);
customPlot->setObjectName(QString::fromUtf8("customPlot"));
customPlot->setBackground(Qt::white); //设置背景颜色
customPlot->setGeometry(QRect(130, 120, 800, 400)); //设置 位置 高度


customPlot->plotLayout()->insertRow(0);
customPlot->plotLayout()->addElement(0, 0, new QCPPlotTitle(customPlot, "Cure")); //插入一行并且添加一个标题元素
customPlot->addGraph(); // blue line
customPlot->graph(0)->setPen(QPen(Qt::blue));
customPlot->graph(0)->setBrush(QBrush(QColor(240, 255, 200)));
customPlot->graph(0)->setAntialiasedFill(false);
//显示当前数值文本
textLabel = new QCPItemText(customPlot);
customPlot->addItem(textLabel);
textLabel->setPositionAlignment(Qt::AlignTop); //布局内控件
textLabel->position->setType(QCPItemPosition::ptAxisRectRatio); //按比例设置位置,依赖于坐标轴矩形大小,区别于按视口大小
textLabel->position->setCoords(0, 0); // place position at center/top of axis rect
textLabel->setFont(QFont(font().family(), 15)); // make font a bit larger
textLabel->setPen(QPen(Qt::black)); // show black border around text
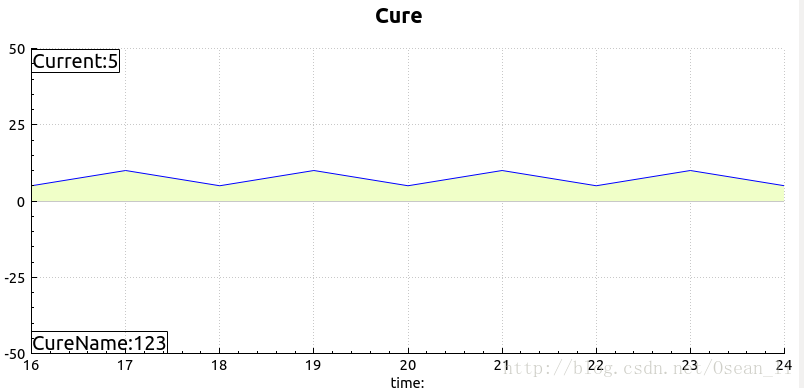
//设置当前曲线名字文本textLabel2 = new QCPItemText(customPlot);
customPlot->addItem(textLabel2);
textLabel2->setPositionAlignment(Qt::AlignBottom);
textLabel2->position->setType(QCPItemPosition::ptAxisRectRatio);
textLabel2->position->setCoords(0, 1.0);
textLabel2->setFont(QFont(font().family(), 15)); // make font a bit larger
textLabel2->setPen(QPen(Qt::black)); // show black border around text
CureName=”123”;//设置曲线名字
textLabel2->setText(“CureName:”+CureName); //显示当前值
//x坐标轴设置
customPlot->xAxis->setLabel(“time:”);//设置坐标名字
customPlot->xAxis->setLabelColor(Qt::black);//设置坐标颜色
customPlot->xAxis->setLabelPadding(1);//设置坐标轴名称文本距离坐标轴刻度线距离
//y坐标轴设置
customPlot->yAxis->setAutoTickStep(false); ////设置是否自动分配刻度间距
customPlot->yAxis->setTickStep(25);// 数值的大小是y轴的一半,设置刻度间距
customPlot->yAxis->setLabelColor(QColor(0, 160, 230)); //设置文本颜色
customPlot->yAxis->setRange(-50,50); //y轴的范围
customPlot->xAxis2-> setTicks(false); //不显示坐标轴
customPlot->yAxis2-> setTicks(false); //不显示坐标轴
value0=1; //测试用到
key=7;
QTimer *dataTimer = new QTimer(this);
connect(dataTimer, SIGNAL(timeout()), this, SLOT(realtimeDataSlot()));
dataTimer->start(1000);
}
Widget::~Widget()
{
}
void Widget::realtimeDataSlot()
{
key++;
static double lastPointKey = 0;
if (key-lastPointKey > 0.01) // at most add point every 10 ms
{
//测试用
if(value0>0 && value0<10)
{
value0=value0+5;
}
else {value0=5;}
    customPlot->graph(0)->addData(key, value0);
    lastPointKey = key;

}

textLabel->setText("Current:"+QString::number( value0 )); //显示当前值
customPlot->xAxis->setAutoTickStep(false);  ////设置是否自动分配刻度间距
customPlot->xAxis->setTickStep(1);// 数值的大小是y轴的一半,设置刻度间距
customPlot->xAxis->setRange(key,8,Qt::AlignRight);
customPlot->replot();
}
“`
效果图如下