高德地图开放文档官方文档:JS API 示例 | 高德地图API
其他文档:组件 | vue-amap
main.js中全局引入:
// 高德地图
import AMap from 'vue-amap';
Vue.use(AMap);
// 初始化vue-amap
AMap.initAMapApiLoader({
  // 高德的key
  key: 'xxxx',
  // 插件集合 (插件按需引入)
  plugin: ['AMap.Autocomplete', 'AMap.PlaceSearch', 'AMap.Scale', 'AMap.OverView', 'AMap.ToolBar', 'AMap.MapType',
    'AMap.PolyEditor', 'AMap.CircleEditor', 'AMap.DistrictSearch','AMap.CircleMarker','AMap.Polyline'
    // 'AMap.Object3DLayer', 'AMap.Object3D'
  ]
});
//高德的安全密钥
window._AMapSecurityConfig = {
  securityJsCode: 'xxxxxxxxx',
}
以下是地图组件页面代码:
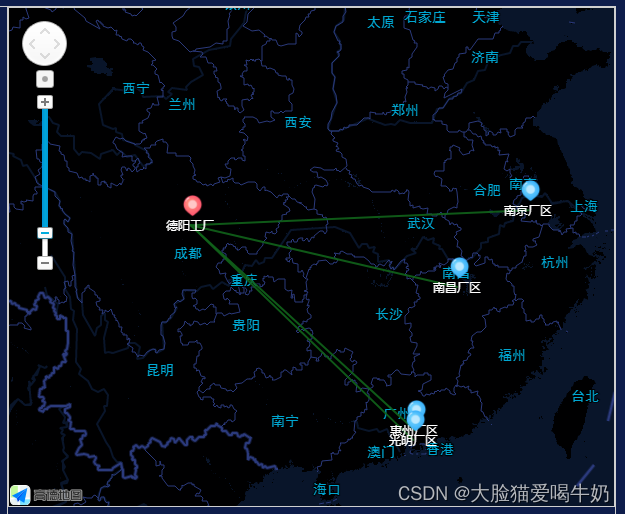
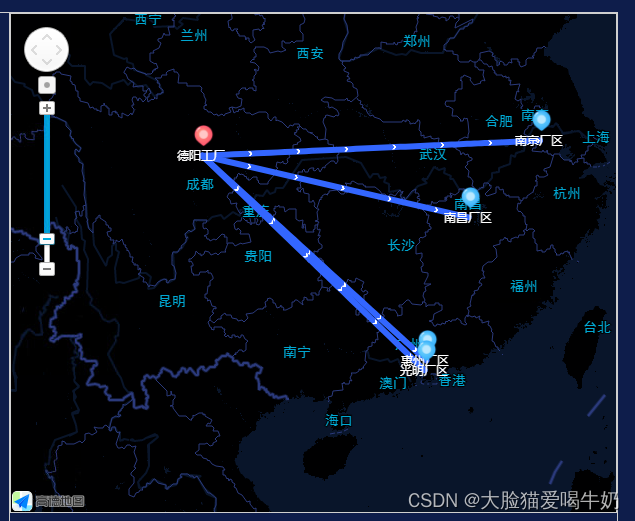
两种效果分别是调用brokenStraightLine(折线)和bezierCurve(贝塞尔曲线)两个方法来实现。
<template>
  <div class="mapBox">
    <!--显示地图的容器-->
    <div style="width: 100%; height: 100%" id="supPortraitMapContainer"></div>
  </div>
</template>

<script>

  export default {
    name: "mapBlock",
    props: {},
    data: function () {
      return {
        map: {}, //地图
        currentline: null
      }
    },
    mounted() {
      this.initData();
    },
    methods: {
      initData() {
            const _this = this

            let mapConfig = {
              centerLatitude: 29.932931,
              centerLongitude: 109.480766,
              mapStyle: "darkblue",
              zoom: 5
            }
            _this.map = new AMap.Map('supPortraitMapContainer', {
              // viewMode: '3D',
              defaultCursor: 'pointer',
              // showBuildingBlock: false,
              expandZoomRange: true,
              zooms: [3, 18],
              // pitch: 53,
              zoom: mapConfig.zoom,
              center: [mapConfig.centerLongitude, mapConfig.centerLatitude], //初始化地图中心点
              resizeEnable: true, //是否监控地图容器尺寸变化
              // mapStyle: 'amap://styles/fresh'
              mapStyle: 'amap://styles/' + mapConfig.mapStyle,
            })

            // 地图加载完成事件
            _this.map.on('complete', function () {
              // console.log("地图加载完成!");
            })

            // 左上角的缩放工具
            _this.map.plugin(['AMap.ToolBar'], function () {
              _this.map.addControl(new AMap.ToolBar())
            })

            //绑定地图移动与缩放事件
            _this.map.on('moveend', function () {
            })
            _this.map.on('zoomend', function () {
            })

            let formatFactoryData = [
              {
                pointType:'vendor',
                factoryName:'德阳工厂',
                latitude: "31.13288904823836",
                longitude: "104.17442710355034"
              },
              {
                pointType:'',
                factoryName: "南昌厂区",
                latitude: "28.782373059010062",
                longitude: "115.88005197505477"
              },
              {
                pointType:'',
                factoryName: "南京厂区",
                latitude: "31.700012349983922",
                longitude: "119.01670720064858"
              },
              {
                pointType:'',
                factoryName: "惠州厂区",
                latitude: "23.13074800394493",
                longitude: "114.02536146211665"
              },
              {
                pointType:'',
                factoryName: "光明厂区",
                latitude: "22.7375120308681",
                longitude: "113.94569901087372"
              }
            ]

            for (let i = 0; i < formatFactoryData.length; i++) {// 设置“定位点”及其图标、文字
              let fa = formatFactoryData[i]
              let icon
              if (fa.pointType==='vendor') {// 供应商定位点
                icon = new AMap.Icon({
                  size: new AMap.Size(23, 23),
                  image: require('../../../../../assets/images/portrait定位.png'),
                  imageSize: new AMap.Size(23, 23),
                  anchor: 'center'
                })
              } else {
                icon = new AMap.Icon({ // 我司定位点
                  size: new AMap.Size(23, 23),
                  image: require('../../../../../assets/images/portraitSup定位.png'),
                  imageSize: new AMap.Size(23, 23),
                  anchor: 'center'
                })
              }

              let marker = new AMap.Marker({
                position: new AMap.LngLat(fa.longitude, fa.latitude), // 经纬度对象,也可以是经纬度构成的一维数组[116.39, 39.9]
                title: fa.factoryName,
                icon: icon
              })
              _this.map.add(marker)

              // 创建纯文本标记
              let text = new AMap.Text({
                text: fa.factoryName,
                anchor: 'center', // 设置文本标记锚点
                draggable: false,
                cursor: 'pointer',
                style: {
                  background: 'none',
                  'border-width': 0,
                  'text-align': 'center',
                  color: 'white'
                },
                position: [fa.longitude, fa.latitude]
              })
              _this.map.add(text)
            }

            let vendorPoint = []
            let ourPoints = []
            for (let i = 0; i < formatFactoryData.length; i++) {
              let fac = formatFactoryData[i]
              if (fac.pointType==='vendor') {
                // console.log(fac)
                vendorPoint.push([fac.longitude, fac.latitude])
              } else {
                ourPoints.push([fac.longitude, fac.latitude])
              }
            }
            let lineData = []
            for (let i = 0; i < ourPoints.length; i++) {
              lineData.push(
                {
                  id: i,
                  path: [vendorPoint[0], ourPoints[i]],
                  events: {//在地图上打点连线的方法
                    click(e) {
                      alert('click polyline')
                    },
                    end: (e) => {
                      const newPath = e.target
                        .getPath()
                        .map((point) => [point.lng, point.lat])
                      console.log(newPath)
                    },
                  },
                  editable: false,
                }
              )
            }

            this.brokenStraightLine(lineData, _this.map)

            let path = [//每个弧线段有两种描述方式
              [116.39, 39.91, 116.37, 39.91],//起点
              //第一段弧线
              [116.380298, 39.907771, 116.38, 39.90],//控制点,途经点
              //第二段弧线
              [116.385298, 39.907771, 116.40, 39.90],//控制点,途经点//弧线段有两种描述方式1
              //第三段弧线
              [//弧线段有两种描述方式2
                [116.392872, 39.887391],//控制点
                [116.40772, 39.909252],//控制点
                [116.41, 39.89]//途经点
              ],
              //第四段弧线
              [116.423857, 39.889498, 116.422312, 39.899639, 116.425273, 39.902273]
              //控制点,控制点,途经点,每段最多两个控制点
            ];
            let bezierCurvePath = [
              [[104.17442710355034,31.13288904823836,104.18,31.13],[115.88005197505477, 28.782373059010062]],
              [[104.17442710355034,31.13288904823836,104.18,31.13],[119.01670720064858, 31.700012349983922, 119.02, 31.7]],
              [[104.17442710355034,31.13288904823836,104.18,31.13],[114.02536146211665, 23.13074800394493, 114.03, 23.13]],
              [[104.17442710355034,31.13288904823836,104.18,31.13],[113.94569901087372, 22.7375120308681, 113.95, 22.74]],
              [[104.17442710355034,31.13288904823836,104.18,31.13],[116.397128, 39.916527, 116.4, 39.92]]
            ]
            // this.bezierCurve(bezierCurvePath, _this.map)
      },
      bezierCurve(path, map) {// 贝塞尔曲线:实现带箭头的直线
        for(let i = 0; i<path.length; i++){
          let bezierCurve = new AMap.BezierCurve({
            path: path[i],
            isOutline: false,
            outlineColor: '#ffeeff',
            borderWeight: 1,
            strokeColor: "#3366FF",
            strokeOpacity: 1,
            strokeWeight: 6,
            // 线样式还支持 'dashed'
            strokeStyle: "solid",
            // strokeStyle是dashed时有效
            strokeDasharray: [10, 10],
            lineJoin: 'round',
            lineCap: 'round',
            zIndex: 50,
            showDir: true
          })
          bezierCurve.setMap(map)
          // 缩放地图到合适的视野级别
          map.setFitView([bezierCurve])
        }
      },
      brokenStraightLine(loadArr, map) { // 折线
        let that = this
        if (loadArr.length === 0) {
          that.$message({
            message: '没有路线数据',
            type: 'warning'
          })
        } else {
          for (let i = 0; i < loadArr.length; i++) {
            let path = loadArr[i].path
            let streetId = loadArr[i].id
            // 定义地图连接线
            let polyline = new AMap.Polyline({
              map: map,
              path: path,
              extData: {id: streetId},
              outlineColor: '#11631b',
              strokeColor: "#11631b",
              strokeOpacity: 0.9,
              strokeWeight: 2,
              borderWeight: 1,
              strokeStyle: "solid",
              strokeDasharray: [0, 0, 0],
              lineJoin: 'round',
              lineCap: 'round',
              zIndex: 20
            });
            let lineId = null;
            polyline.on('click', function (event) {
              polyline.setOptions({
                outlineColor: '#31f4e6',
                strokeColor: "#31f4e6",
                strokeOpacity: 1,
                strokeWeight: 4,
                borderWeight: 1,
                zIndex: 25
              });
              lineId = polyline.getExtData().id
              if (that.currentline) {
                that.currentline.setOptions({
                  outlineColor: '#11631b',
                  strokeColor: "#11631b",
                  strokeOpacity: 0.9,
                  strokeWeight: 2,
                  borderWeight: 1,
                  zIndex: 20
                })
              }
              that.currentline = polyline;
            }, lineId)
            polyline.setMap(map)
          }
        }
      },
      // 画边界(疫情区域等)
      drawBounds(map, level, districtName, fillColor, strokeColor) {
        if (!level) {
          level = 'district'
        }
        if (!fillColor) {
          fillColor = '#80d8ff'
        }
        if (!strokeColor) {
          strokeColor = '#0091ea'
        }
        //实例化DistrictSearch
        let opts = {
          subdistrict: 0, //获取边界不需要返回下级行政区
          extensions: 'all', //返回行政区边界坐标组等具体信息
          level: level //查询行政级别为 市
        }
        let district = new AMap.DistrictSearch(opts)

        //行政区查询
        district.setLevel(level)
        district.search(districtName, function (status, result) {
          // map.remove(polygons)//清除上次结果
          let polygons = []
          if (typeof (result) == 'undefined'
            || typeof (result.districtList) == 'undefined'
            || typeof (result.districtList[0]) == 'undefined') {
            return;
          }
          let bounds = result.districtList[0].boundaries
          if (bounds) {
            for (let i = 0, l = bounds.length; i < l; i++) {
              //生成行政区划polygon
              let polygon = new AMap.Polygon({
                strokeWeight: 1,
                path: bounds[i],
                fillOpacity: 0.4,
                fillColor: fillColor,
                strokeColor: strokeColor,
                content: 'fgquyu'
              })
              polygons.push(polygon)
            }
          }
          map.add(polygons)
          let overlayGroup = new AMap.OverlayGroup(polygons)
          overlayGroup.setOptions({
            zIndex: -1
          })

          // 统一添加到地图实例上
          map.add(overlayGroup)
          // map.setFitView(polygons);//视口自适应
        })
      },
    }
  }
</script>

<style scoped>
  .mapBox {
    height: 500px;
    border: 1px solid #cfcfcf;
  }
</style>
效果图如下:(项目的需求是把供应商发货地址和我司收货地址用直线连起来,实际上这个是可以做折线的,我觉得就像路线)

<template>
  <div class="mapBox">
    <!--显示地图的容器-->
    <div style="width: 100%; height: 100%" id="supPortraitMapContainer"></div>
  </div>
</template>

<script>

  export default {
    name: "mapBlock",
    props: {},
    data: function () {
      return {
        map: {}, //地图
        currentline: null
      }
    },
    mounted() {
      this.initData();
    },
    methods: {
      initData() {
        const _this = this

        let mapConfig = {
          centerLatitude: 29.932931,
          centerLongitude: 109.480766,
          isNeedTotal: null,
          mapStyle: "darkblue",
          pageNum: null,
          pageSize: null,
          searchUrl: "",
          zoom: 5
        }
        _this.map = new AMap.Map('supPortraitMapContainer', {
          // viewMode: '3D',
          defaultCursor: 'pointer',
          // showBuildingBlock: false,
          expandZoomRange: true,
          zooms: [3, 18],
          // pitch: 53,
          zoom: mapConfig.zoom,
          center: [mapConfig.centerLongitude, mapConfig.centerLatitude], //初始化地图中心点
          resizeEnable: true, //是否监控地图容器尺寸变化
          // mapStyle: 'amap://styles/fresh'
          mapStyle: 'amap://styles/' + mapConfig.mapStyle,
        })

        // 地图加载完成事件
        _this.map.on('complete', function () {
          // console.log("地图加载完成!");
        })

        // 左上角的缩放工具
        _this.map.plugin(['AMap.ToolBar'], function () {
          _this.map.addControl(new AMap.ToolBar())
        })

        //绑定地图移动与缩放事件
        _this.map.on('moveend', function () {
        })
        _this.map.on('zoomend', function () {
        })

        let formatFactoryData = [
          {
            pointType:'vendor',
            factoryName:'德阳工厂',
            latitude: "31.13288904823836",
            longitude: "104.17442710355034"
          },
          {
            pointType:'',
            factoryName: "南昌厂区",
            latitude: "28.782373059010062",
            longitude: "115.88005197505477"
          },
          {
            pointType:'',
            factoryName: "南京厂区",
            latitude: "31.700012349983922",
            longitude: "119.01670720064858"
          },
          {
            pointType:'',
            factoryName: "惠州厂区",
            latitude: "23.13074800394493",
            longitude: "114.02536146211665"
          },
          {
            pointType:'',
            factoryName: "光明厂区",
            latitude: "22.7375120308681",
            longitude: "113.94569901087372"
          }
        ]

        for (let i = 0; i < formatFactoryData.length; i++) {// 设置“定位点”及其图标、文字
          let fa = formatFactoryData[i]
          let icon
          if (fa.pointType==='vendor') {// 供应商定位点
            icon = new AMap.Icon({
              size: new AMap.Size(23, 23),
              image: require('../../../../../assets/images/portrait定位.png'),
              imageSize: new AMap.Size(23, 23),
              anchor: 'center'
            })
          } else {
            icon = new AMap.Icon({ // 我司定位点
              size: new AMap.Size(23, 23),
              image: require('../../../../../assets/images/portraitSup定位.png'),
              imageSize: new AMap.Size(23, 23),
              anchor: 'center'
            })
          }

          let marker = new AMap.Marker({
            position: new AMap.LngLat(fa.longitude, fa.latitude), // 经纬度对象,也可以是经纬度构成的一维数组[116.39, 39.9]
            title: fa.factoryName,
            icon: icon
          })
          _this.map.add(marker)

          // 创建纯文本标记
          let text = new AMap.Text({
            text: fa.factoryName,
            anchor: 'center', // 设置文本标记锚点
            draggable: false,
            cursor: 'pointer',
            style: {
              background: 'none',
              'border-width': 0,
              'text-align': 'center',
              color: 'white'
            },
            position: [fa.longitude, fa.latitude]
          })
          _this.map.add(text)
        }

        let vendorPoint = []
        let ourPoints = []
        for (let i = 0; i < formatFactoryData.length; i++) {
          let fac = formatFactoryData[i]
          if (fac.pointType==='vendor') {
            // console.log(fac)
            vendorPoint.push([fac.longitude, fac.latitude])
          } else {
            ourPoints.push([fac.longitude, fac.latitude])
          }
        }
        let lineData = []
        for (let i = 0; i < ourPoints.length; i++) {
          lineData.push(
            {
              id: i,
              path: [vendorPoint[0], ourPoints[i]],
              events: {//在地图上打点连线的方法
                click(e) {
                  alert('click polyline')
                },
                end: (e) => {
                  const newPath = e.target
                    .getPath()
                    .map((point) => [point.lng, point.lat])
                  console.log(newPath)
                },
              },
              editable: false,
            }
          )
        }

        // this.brokenStraightLine(lineData, _this.map)

        let path = [//每个弧线段有两种描述方式
          [116.39, 39.91, 116.37, 39.91],//起点
          //第一段弧线
          [116.380298, 39.907771, 116.38, 39.90],//控制点,途经点
          //第二段弧线
          [116.385298, 39.907771, 116.40, 39.90],//控制点,途经点//弧线段有两种描述方式1
          //第三段弧线
          [//弧线段有两种描述方式2
            [116.392872, 39.887391],//控制点
            [116.40772, 39.909252],//控制点
            [116.41, 39.89]//途经点
          ],
          //第四段弧线
          [116.423857, 39.889498, 116.422312, 39.899639, 116.425273, 39.902273]
          //控制点,控制点,途经点,每段最多两个控制点
        ];
        let bezierCurvePath = [
          [[104.17442710355034,31.13288904823836,104.18,31.13],[115.88005197505477, 28.782373059010062]],
          [[104.17442710355034,31.13288904823836,104.18,31.13],[119.01670720064858, 31.700012349983922, 119.02, 31.7]],
          [[104.17442710355034,31.13288904823836,104.18,31.13],[114.02536146211665, 23.13074800394493, 114.03, 23.13]],
          [[104.17442710355034,31.13288904823836,104.18,31.13],[113.94569901087372, 22.7375120308681, 113.95, 22.74]],
        ]
        this.bezierCurve(bezierCurvePath, _this.map)
      },
      bezierCurve(path, map) {// 贝塞尔曲线:实现带箭头的直线
        for(let i = 0; i<path.length; i++){
          let bezierCurve = new AMap.BezierCurve({
            path: path[i],
            isOutline: false,
            outlineColor: '#ffeeff',
            borderWeight: 1,
            strokeColor: "#3366FF",
            strokeOpacity: 1,
            strokeWeight: 6,
            // 线样式还支持 'dashed'
            strokeStyle: "solid",
            // strokeStyle是dashed时有效
            strokeDasharray: [10, 10],
            lineJoin: 'round',
            lineCap: 'round',
            zIndex: 50,
            showDir: true // 是否显示箭头
          })
          bezierCurve.setMap(map)
          // 缩放地图到合适的视野级别
          map.setFitView([bezierCurve])
        }
      },
      brokenStraightLine(loadArr, map) { // 折线
        let that = this
        if (loadArr.length === 0) {
          that.$message({
            message: '没有路线数据',
            type: 'warning'
          })
        } else {
          for (let i = 0; i < loadArr.length; i++) {
            let path = loadArr[i].path
            let streetId = loadArr[i].id
            // 定义地图连接线
            let polyline = new AMap.Polyline({
              map: map,
              path: path,
              extData: {id: streetId},
              outlineColor: '#11631b',
              strokeColor: "#11631b",
              strokeOpacity: 0.9,
              strokeWeight: 2,
              borderWeight: 1,
              strokeStyle: "solid",
              strokeDasharray: [0, 0, 0],
              lineJoin: 'round',
              lineCap: 'round',
              zIndex: 20
            });
            let lineId = null;
            polyline.on('click', function (event) {
              polyline.setOptions({
                outlineColor: '#31f4e6',
                strokeColor: "#31f4e6",
                strokeOpacity: 1,
                strokeWeight: 4,
                borderWeight: 1,
                zIndex: 25
              });
              lineId = polyline.getExtData().id
              if (that.currentline) {
                that.currentline.setOptions({
                  outlineColor: '#11631b',
                  strokeColor: "#11631b",
                  strokeOpacity: 0.9,
                  strokeWeight: 2,
                  borderWeight: 1,
                  zIndex: 20
                })
              }
              that.currentline = polyline;
            }, lineId)
            polyline.setMap(map)
          }
        }
      },
      // 画边界(疫情区域等)
      drawBounds(map, level, districtName, fillColor, strokeColor) {
        if (!level) {
          level = 'district'
        }
        if (!fillColor) {
          fillColor = '#80d8ff'
        }
        if (!strokeColor) {
          strokeColor = '#0091ea'
        }
        //实例化DistrictSearch
        let opts = {
          subdistrict: 0, //获取边界不需要返回下级行政区
          extensions: 'all', //返回行政区边界坐标组等具体信息
          level: level //查询行政级别为 市
        }
        let district = new AMap.DistrictSearch(opts)

        //行政区查询
        district.setLevel(level)
        district.search(districtName, function (status, result) {
          // map.remove(polygons)//清除上次结果
          let polygons = []
          if (typeof (result) == 'undefined'
            || typeof (result.districtList) == 'undefined'
            || typeof (result.districtList[0]) == 'undefined') {
            return;
          }
          let bounds = result.districtList[0].boundaries
          if (bounds) {
            for (let i = 0, l = bounds.length; i < l; i++) {
              //生成行政区划polygon
              let polygon = new AMap.Polygon({
                strokeWeight: 1,
                path: bounds[i],
                fillOpacity: 0.4,
                fillColor: fillColor,
                strokeColor: strokeColor,
                content: 'fgquyu'
              })
              polygons.push(polygon)
            }
          }
          map.add(polygons)
          let overlayGroup = new AMap.OverlayGroup(polygons)
          overlayGroup.setOptions({
            zIndex: -1
          })

          // 统一添加到地图实例上
          map.add(overlayGroup)
          // map.setFitView(polygons);//视口自适应
        })
      },
    }
  }
</script>

<style scoped>
  .mapBox {
    height: 500px;
    border: 1px solid #cfcfcf;
  }
</style>
这是用贝塞尔曲线实现的将两个地址用直线连起来(折线也可以用showDir:true属性设置箭头)
