动动发财的小手,点个赞吧!

数据工程构成了数据科学过程的很大一部分。在 CRISP-DM 中,这个过程阶段称为“数据准备”。它包括数据摄取、数据转换和数据质量保证等任务。在本文[1]章中,我们使用 ChatGPT 和 Python 解决了典型的数据工程任务。通过这样做,我们探索了数据工程与提示工程新学科之间的联系。
简介
2022 年 5 月,斯蒂芬·沃尔夫勒姆 (Stephen Wolfram) 和莱克斯·弗里德曼 (Lex Fridman) 发表了题为“编程已死吗?”的深刻见解。他们讨论了未来开发者是否还会使用高级语言。根据 Wolfram 的说法,许多编程任务可以通过大型语言模型 (LLM) 实现自动化。在撰写本文时,此类模型最突出的例子是 ChatGPT。自 2022 年底推出以来,它产生了惊人的效果。指定要由 LLM 执行的操作称为“提示工程”。如果 Wolfram 是对的,至少软件开发的一部分将从编写代码转向编写提示。
在数据科学方面,数据准备可能是一项耗时且乏味的任务。那么,为什么不尝试使用 LLM 使其自动化呢?在以下部分中,我们将使用 ChatGPT 和 Python 解决不同的数据工程问题。我们没有自己编写 Python 代码,而是使用提示工程来生成它。我们的实验是在 2023 年 5 月 19 日基于当时最新的免费 ChatGPT 版本 (GPT-3.5) 进行的。
创建数据框
让我们从一个简单的问题开始,并从样本数据集创建一个 Pandas 数据框。表 1 包含例如世界银行提供的国家指标。
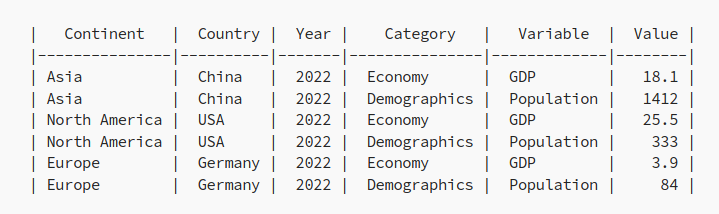
为了从上面的示例中创建数据框,我们开始了与 ChatGPT 的新对话并发布了以下提示:
Create a Pandas table with the following data:
Continent, Country, Year, Category, Variable, Value
Asia, China, 2022, Economy, GDP, 18.1
Asia, China, 2022, Demographics, Population, 1412
North America, USA, 2022, Economy, GDP, 25.5
North America, USA, 2022, Demographics, Population, 333
Europe, Germany, 2022, Economy, GDP, 3.9
Europe, Germany, 2022, Demographics, Population, 84
作为响应,该模型生成了以下 Python 代码:
import pandas as pd

data = {


    'Continent': ['Asia', 'Asia', 'North America', 'North America', 'Europe', 'Europe'],
    'Country': ['China', 'China', 'USA', 'USA', 'Germany', 'Germany'],
    'Year': [2022, 2022, 2022, 2022, 2022, 2022],
    'Category': ['Economy', 'Demographics', 'Economy', 'Demographics', 'Economy', 'Demographics'],
    'Variable': ['GDP', 'Population', 'GDP', 'Population', 'GDP', 'Population'],
    'Value': [18.1, 1412, 25.5, 333, 3.9, 84]
}

df = pd.DataFrame(data)
print(df)
运行脚本时,我们看到输出符合我们的规范:
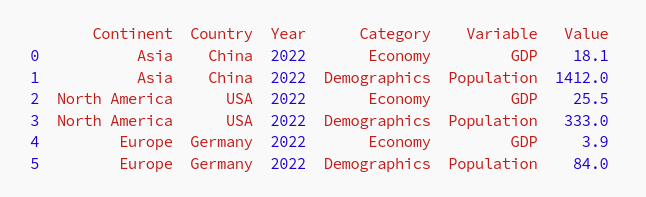
尽管我们在实验中使用了示例,但下一节中生成的代码原则上也可以处理更大的数据集。
旋转数据框
对于数据科学,我们在第一个提示中创建的表结构并不是最优的。相反,所谓的“平板”会更方便。在表 1 中,指标“GDP”和“人口”分别用名为“Variable”和“Value”的两列表示。相比之下,平面表格将为每个指标包含单独的列,如表 2 所示。
将表 1 的格式转换为表 2 的格式称为“透视”。让我们尝试使用 ChatGPT 来解决这个任务。为此,我们在对话中发布了第二个提示:
Transform the table into the following format:
Continent, Country, Year, GDP, Population
Asia, China, 2022, 18.1, 1412
North America, USA, 2022, 25.5, 333
Europe, Germany, 2022, 3.9, 84
上述消息基于所需数据格式的示例。或者,我们也可以纯口头表达我们的要求。与经典编程一样,在提示工程中有实现目标的替代解决方案。在不久的将来,寻找最佳方式将是一项激动人心的任务。根据我们的提示,ChatGPT对Python代码进行了如下调整:
import pandas as pd

data = {


    'Continent': ['Asia', 'Asia', 'North America', 'North America', 'Europe', 'Europe'],
    'Country': ['China', 'China', 'USA', 'USA', 'Germany', 'Germany'],
    'Year': [2022, 2022, 2022, 2022, 2022, 2022],
    'Category': ['Economy', 'Demographics', 'Economy', 'Demographics', 'Economy', 'Demographics'],
    'Variable': ['GDP', 'Population', 'GDP', 'Population', 'GDP', 'Population'],
    'Value': [18.1, 1412, 25.5, 333, 3.9, 84]
}

df = pd.DataFrame(data)

# Pivot the table
pivot_df = df.pivot_table(index=['Continent', 'Country', 'Year'], columns='Category', values='Value').reset_index()

# Rename the columns
pivot_df.columns.name = None
pivot_df.columns = [column if column != 'Variable' else None for column in pivot_df.columns]

print(pivot_df)
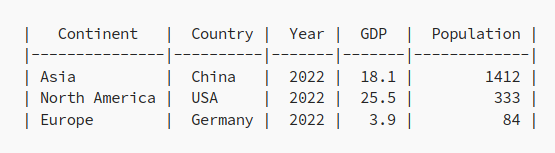
然而,运行脚本的第二个版本显示输出不是我们所要求的: 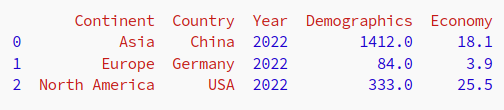
该表包含名为“人口统计”和“经济”的两列,而不是预期的“GDP”和“人口”列。为了解决这个问题,我们发布了下一个提示:
The columns are not correct, you should have used
the variables GDP and population
作为响应,模型纠正了错误并生成了另一个版本的 Python 代码:
import pandas as pd

data = {


    'Continent': ['Asia', 'Asia', 'North America', 'North America', 'Europe', 'Europe'],
    'Country': ['China', 'China', 'USA', 'USA', 'Germany', 'Germany'],
    'Year': [2022, 2022, 2022, 2022, 2022, 2022],
    'Category': ['Economy', 'Demographics', 'Economy', 'Demographics', 'Economy', 'Demographics'],
    'Variable': ['GDP', 'Population', 'GDP', 'Population', 'GDP', 'Population'],
    'Value': [18.1, 1412, 25.5, 333, 3.9, 84]
}

df = pd.DataFrame(data)

# Pivot the table
pivot_df = df.pivot_table(index=['Continent', 'Country', 'Year'], columns='Variable', values='Value').reset_index()

# Rename the columns
pivot_df.columns.name = None
pivot_df.columns = ['Continent', 'Country', 'Year', 'GDP', 'Population']

print(pivot_df)
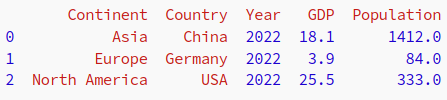
运行脚本表明这次旋转已正确实现:
富集数据框
另一个典型的数据工程任务是用附加信息丰富数据集。为此,我们要求 ChatGPT 通过发布以下提示将 ISO 国家代码添加到我们的数据中:
For each country, in the table above, add its ISO code
结果,模型调整了响应并返回了以下代码片段:
import pandas as pd

data = {


    'Continent': ['Asia', 'Asia', 'North America', 'North America', 'Europe', 'Europe'],
    'Country': ['China', 'China', 'USA', 'USA', 'Germany', 'Germany'],
    'Year': [2022, 2022, 2022, 2022, 2022, 2022],
    'Category': ['Economy', 'Demographics', 'Economy', 'Demographics', 'Economy', 'Demographics'],
    'Variable': ['GDP', 'Population', 'GDP', 'Population', 'GDP', 'Population'],
    'Value': [18.1, 1412, 25.5, 333, 3.9, 84]
}

iso_codes = {


    'China': 'CN',
    'USA': 'US',
    'Germany': 'DE'
}

df = pd.DataFrame(data)

# Add ISO code column
df['ISO Code'] = df['Country'].map(iso_codes)

# Pivot the table
pivot_df = df.pivot_table(index=['Continent', 'Country', 'ISO Code', 'Year'], columns='Variable', values='Value').reset_index()

# Rename the columns
pivot_df.columns.name = None
pivot_df.columns = ['Continent', 'Country', 'ISO Code', 'Year', 'GDP', 'Population']

print(pivot_df)
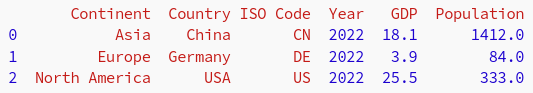
运行脚本显示一个带有 ISO 代码的新列已添加到数据框中。
派生列
接下来让我们通过将一个国家的 GDP 除以其人口规模来得出一个新的列“人均 GDP”。为此,我们发送了以下提示:
Derive a new column "GDP per capita" by dividing the GDP
of a country by its population size
对此,模型修改了代码如下:
import pandas as pd

data = {


    'Continent': ['Asia', 'Asia', 'North America', 'North America', 'Europe', 'Europe'],
    'Country': ['China', 'China', 'USA', 'USA', 'Germany', 'Germany'],
    'Year': [2022, 2022, 2022, 2022, 2022, 2022],
    'Category': ['Economy', 'Demographics', 'Economy', 'Demographics', 'Economy', 'Demographics'],
    'Variable': ['GDP', 'Population', 'GDP', 'Population', 'GDP', 'Population'],
    'Value': [18.1, 1412, 25.5, 333, 3.9, 84]
}

iso_codes = {


    'China': 'CN',
    'USA': 'US',
    'Germany': 'DE'
}

df = pd.DataFrame(data)

# Add ISO code column
df['ISO Code'] = df['Country'].map(iso_codes)

# Pivot the table
pivot_df = df.pivot_table(index=['Continent', 'Country', 'ISO Code', 'Year'], columns='Variable', values='Value').reset_index()

# Calculate GDP per capita
pivot_df['GDP per capita'] = pivot_df['GDP'] / pivot_df['Population']

# Rename the columns
pivot_df.columns.name = None
pivot_df.columns = ['Continent', 'Country', 'ISO Code', 'Year', 'GDP', 'Population', 'GDP per capita']

print(pivot_df)
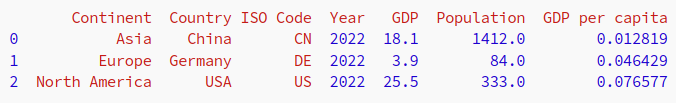
输出表明脚本产生了预期的结果:
分析数据
一旦数据转换完成,实际的分析就可以开始了。最后让我们计算一下各国GDP与人口的相关系数。为此,我们贴出最后一个提示:
Use the table above to calculate the correlation coefficient between
the GDP and the population of the countries
结果,模型返回了以下代码片段:
import pandas as pd

data = {


    'Continent': ['Asia', 'Asia', 'North America', 'North America', 'Europe', 'Europe'],
    'Country': ['China', 'China', 'USA', 'USA', 'Germany', 'Germany'],
    'Year': [2022, 2022, 2022, 2022, 2022, 2022],
    'Category': ['Economy', 'Demographics', 'Economy', 'Demographics', 'Economy', 'Demographics'],
    'Variable': ['GDP', 'Population', 'GDP', 'Population', 'GDP', 'Population'],
    'Value': [18.1, 1412, 25.5, 333, 3.9, 84]
}

df = pd.DataFrame(data)

# Pivot the table
pivot_df = df.pivot_table(index=['Continent', 'Country', 'Year'], columns='Variable', values='Value').reset_index()

# Calculate correlation coefficient
correlation_coefficient = pivot_df['GDP'].corr(pivot_df['Population'])

print("Correlation Coefficient: {:.3f}".format(correlation_coefficient))
运行脚本时,我们发现两个变量之间存在很强的正相关性,这并不奇怪:

总结
不可否认,我们的实验是基于一个简单的数据集。然而,结果是显著的。我们执行了几项数据工程任务,而没有编写一行代码。 ChatGPT 不仅能够在大多数情况下正确执行我们的提示。但即使模型犯了错误,它也能够反映和修复错误。与软件开发一样,生成的代码必须经过测试。此外,它可能需要重构和优化。在 AI 时代使用 pylint 仍然是一个好主意。然而,总而言之,我们必须同意 Wolfram 的观点:在未来,数据工程的重要部分将从编码转向提示工程。这种新方法不会取代数据工程师,但会提高他们的效率。
Reference
Source: "https://towardsdatascience.com/from-data-engineering-to-prompt-engineering-5debd1c636e0"
本文由 mdnice 多平台发布