一、实验内容
- 基于模板
process.c编写多进程的样本程序,实现如下功能: + 所有子进程都并行运行,每个子进程的实际运行时间一般不超过 30 秒; + 父进程向标准输出打印所有子进程的 id,并在所有子进程都退出后才退出; - 在
Linux0.11上实现进程运行轨迹的跟踪。 + 基本任务是在内核中维护一个日志文件/var/process.log,把从操作系统启动到系统关机过程中所有进程的运行轨迹都记录在这一 log 文件中。 - 在修改过的 0.11 上运行样本程序,通过分析 log 文件,统计该程序建立的所有进程的等待时间、完成时间(周转时间)和运行时间,然后计算平均等待时间,平均完成时间和吞吐量。可以自己编写统计程序,也可以使用 python 脚本程序——
stat_log.py(在/home/teacher/目录下) ——进行统计。 - 修改 0.11 进程调度的时间片,然后再运行同样的样本程序,统计同样的时间数据,和原有的情况对比,体会不同时间片带来的差异。
/var/process.log 文件的格式必须为:
PID X Time其中:
- pid 是进程的 ID;
- X 可以是 N、J、R、W 和 E 中的任意一个,分别表示进程新建(N)、进入就绪态(J)、进入运行态(R)、进入阻塞态(W) 和退出(E);
- time 表示 X 发生的时间。这个时间不是物理时间,而是系统的滴答时间(tick);
三个字段之间用制表符分隔。例如:
12    N    1056
12    J    1057
4    W    1057
12    R    1057
13    N    1058
13    J    1059
14    N    1059
14    J    1060
15    N    1060
15    J    1061
12    W    1061
15    R    1061
15    J    1076
14    R    1076
14    E    1076
......
二、实验环境搭建(Ubuntu虚拟机)
三、先备知识
在init/目录下有一个main.c文件,系统在执行完boot/目录下的head.s程序后就会将执行权交给main.c,这个程序包含了内核初始化的所有工作。

- 多进程如何启动?
main中的fork()创建了操作系统中的0进程的第一个子进程,在这个子进程中,执行了init(),init中又执行了Shell(Windows桌面),Shell这个进程再启动其他进程,这样就形成了多进程图像。
这里简单介绍一下fork()函数,fork()系统调用用于创建子进程,它的返回值有两个,父进程返回创建子进程的pid,子进程返回0。这里if(!fork())就表示在子进程中调用init()函数。

- 多进程如何组织?
多进程的组织依赖于一些重要的数据结构,比如PCB(进程控制块)、队列和状态。
进程控制块(PCB):是用来记录进程信息的一种数据结构,它在linux-0.11内核中的include/linux/sched.h中,结构如下:

状态:这里值进程的状态,进程的状态有五种:新建态、就绪态、运行态、阻塞态、终止态。
 注:上面的箭头表示状态的转换方向
队列:因为CPU在同一时刻只能运行一个进程。除了处于运行态的进程,其他的进程都排队等着执行。
但是每个进程的状态又是不一样的,如果进程已经准备就绪,只是还没有被分配CPU,这个进程的PCB就处于就绪队列上,等着被CPU调度。如果进程正在等待一个事件发生,从而发生了阻塞,需要这个事件发生来唤醒,那么这个进程PCB处于阻塞队列上,等着被唤醒,唤醒后则进入就绪态。
因此每个队列上的元素都是进程的PCB,随着进程状态的改变,这些PCB也会随之出队入队。

这样操作系统就把多个进程有序的组织起来了。
- 多进程如何交替?
进程交替需要三个步骤:队列操作+调度+切换

队列操作:就是将进程PCB放入对应状态的等待队列中,随着进程状态转换出队入队的操作。
调度:当一个进程因为要等待某个事件的发生(比如读写磁盘的IO操作)或者时间片用完,擦偶作系统会使用剥夺当前进程的CPU使用权,使用调度算法(FIFO、短作业优先等策略)在就绪队列中选出下一个进程使用CPU。
切换:当进程切换时,需要保存运行时的一些状态和数据,而这些都保存在CPU的寄存器中,这时,被剥夺CPU的进程需要把CPU这些寄存器的值保存在自己的PCB中,而获得CPU使用权的进程,为了从上次运行的状态继续运行,则需要将自己PCB中的寄存器的值赋值给CPU。

- 多进程如何影响?


实验相关源码分析:
1.实验目的是要将进程的每一次状态变换和该状态持续的时间都记录在log文件中,因此要求操作系统启动后先打开/var/process.log,然后就可以在每个进程发生状态切换的时候写入记录,为了能尽早开始记录,应该在内核启动时就打开log文件,内核入口是init/main.c的main函数:
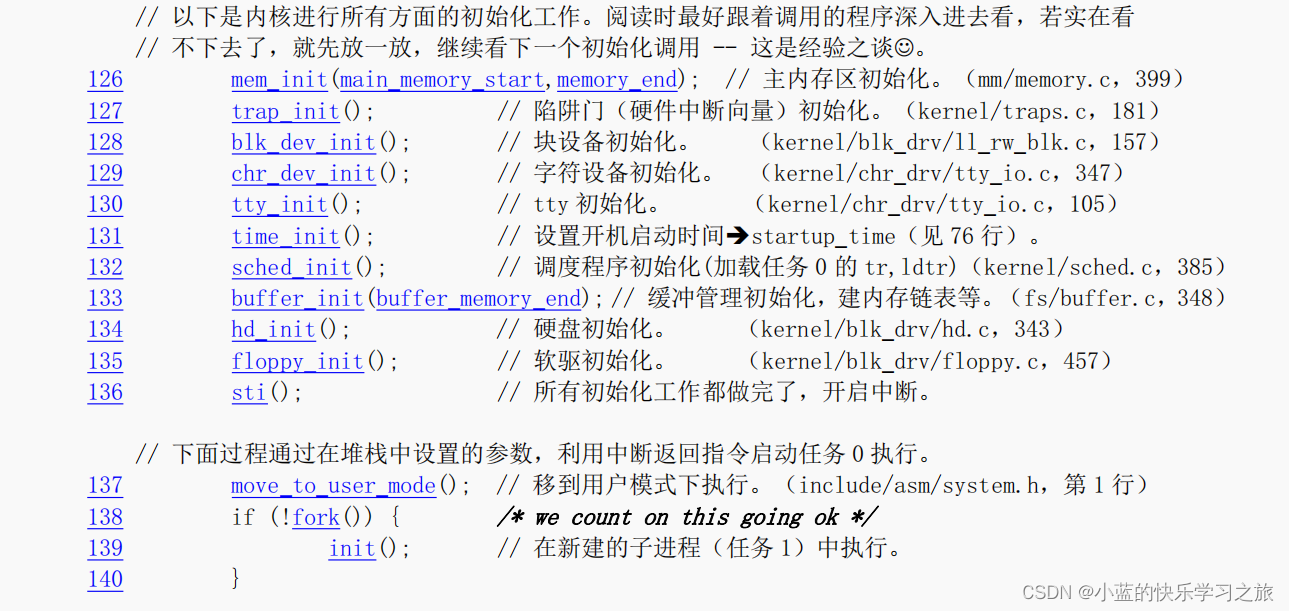
将下面红色区域的代码剪切到上面 move_to_user_mode();后面,然后其后跟着添加打开log文件的代码:
(void) open("/var/process.log",O_CREAT|O_TRUNC|O_WRONLY,0666); 这样,文件描述符0,1,2,3就在进程0中创建了。根据fork()原理,进程0创建的任意子进程都会继承这些文件描述符,因此在init()中就不必再open()了。此后,init()的后续代码和/bin/sh都会重新初始化它们。所以只有进程0和进程1的文件描述符关联着log文件。
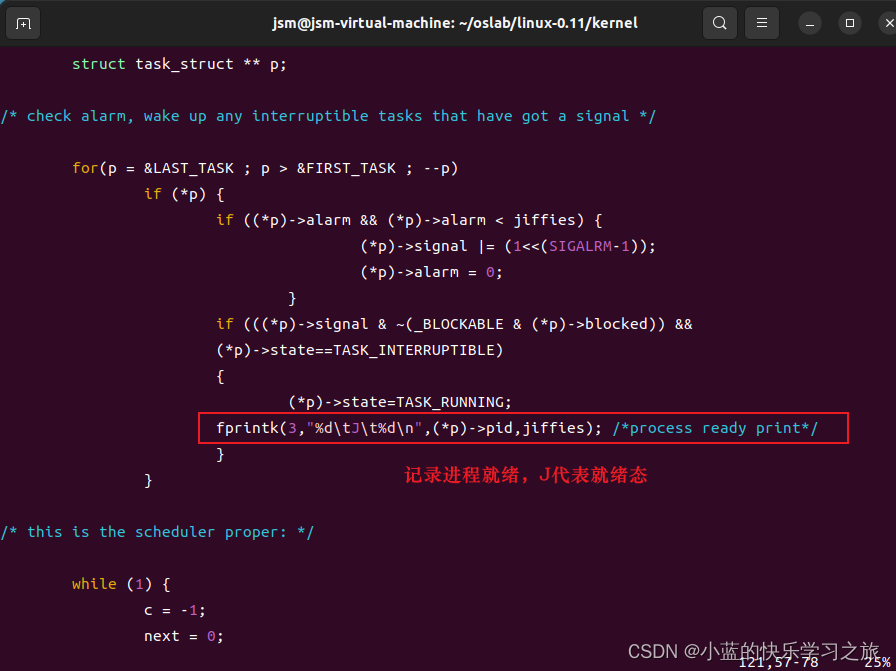
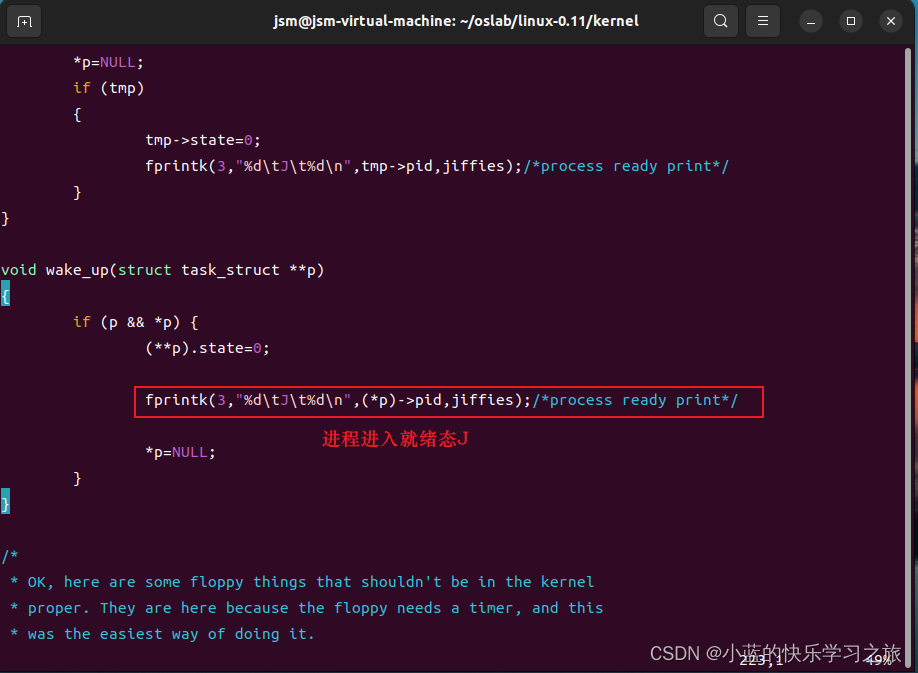
2.编写fprintk()函数,所有的状态转移都是在内核环境下发生的,而想要把每一次状态切换的记录写入log文件,内核不能使用write()函数,就像内核状态下只能调用printk()而不能调用printf()函数一样。因此这个fprintk()函数实现的功能就是在内核中写log文件。下面是代码:
#include "linux/sched.h"
#include "sys/stat.h"

static char logbuf[1024];
int fprintk(int fd, const char *fmt, ...)
{
    va_list args;
    int count;
    struct file * file;
    struct m_inode * inode;

    va_start(args, fmt);
    count=vsprintf(logbuf, fmt, args);
    va_end(args);
/* 如果输出到stdout或stderr,直接调用sys_write即可 */
    if (fd < 3)
    {
        __asm__("push %%fs\n\t"
            "push %%ds\n\t"
            "pop %%fs\n\t"
            "pushl %0\n\t"
        /* 注意对于Windows环境来说,是_logbuf,下同 */
            "pushl $logbuf\n\t"
            "pushl %1\n\t"
        /* 注意对于Windows环境来说,是_sys_write,下同 */
            "call sys_write\n\t"
            "addl $8,%%esp\n\t"
            "popl %0\n\t"
            "pop %%fs"
            ::"r" (count),"r" (fd):"ax","cx","dx");
    }
    else
/* 假定>=3的描述符都与文件关联。事实上,还存在很多其它情况,这里并没有考虑。*/
    {
    /* 从进程0的文件描述符表中得到文件句柄 */
        if (!(file=task[0]->filp[fd]))
            return 0;
        inode=file->f_inode;

        __asm__("push %%fs\n\t"
            "push %%ds\n\t"
            "pop %%fs\n\t"
            "pushl %0\n\t"
            "pushl $logbuf\n\t"
            "pushl %1\n\t"
            "pushl %2\n\t"
            "call file_write\n\t"
            "addl $12,%%esp\n\t"
            "popl %0\n\t"
            "pop %%fs"
            ::"r" (count),"r" (file),"r" (inode):"ax","cx","dx");
    }
    return count;
}
3.在进程状态切换处,将进程的声明周期写入日志。涉及到的文件有fork.c、sched.c、exit.c
新建态:用户使用fork()函数,新建的进程处于新建态
就绪态:进程新建之后进入就绪态、进程阻塞事件发生进入就绪态、进程时间片用完进入就绪态等等
阻塞态:进程等待资源或事件会进入阻塞态
运行态:进程被调度占用CPU进入运行态
四、实验步骤
1.修改init.c文件。
将init.c文件中的init()的以下代码移动到main()函数中,并添加代码打开process.log文件。

2.在printf.c里面添加上面fprintk的代码:

3.将进程状态切换信息写入process.log文件:
修改fork文件:


修改sched.c文件:


4.在linux-0.11目录下执行make all重新编译,若没报错则执行下一步。
5.编写process.c文件,这个文件可以放在oslab下,为了把这个文件拷贝到linux-0.11系统中,需要挂载系统硬盘,最后启动linux-0.11系统,在这个系统里编译运行process.c文件。
#include <stdio.h>
#include <unistd.h>
#include <time.h>
#include <sys/times.h>
#define HZ 100
void cpuio_bound(int last, int cpu_time, int io_time);
int main(int argc, char * argv[])
{
pid_t n_proc[10]; /*10个子进程 PID*/
int i;
for(i=0;i<10;i++)
{
n_proc[i] = fork();
/*子进程*/
if(n_proc[i] == 0)
{
cpuio_bound(20,2*i,20-2*i); /*每个子进程都占用20s*/
return 0; /*执行完cpuio_bound 以后,结束该子进程*/
}
/*fork 失败*/
else if(n_proc[i] < 0 )
{
printf("Failed to fork child process %d!\n",i+1);
return -1;
}
/*父进程继续fork*/
}
/*打印所有子进程PID*/
for(i=0;i<10;i++)
printf("Child PID: %d\n",n_proc[i]);
/*等待所有子进程完成*/
wait(&i); /*Linux 0.11 上 gcc要求必须有一个参数, gcc3.4+则不需要*/
return 0;
}
/*
* 此函数按照参数占用CPU和I/O时间
* last: 函数实际占用CPU和I/O的总时间,不含在就绪队列中的时间,>=0是必须的
* cpu_time: 一次连续占用CPU的时间,>=0是必须的
* io_time: 一次I/O消耗的时间,>=0是必须的
* 如果last > cpu_time + io_time,则往复多次占用CPU和I/O
* 所有时间的单位为秒
*/
void cpuio_bound(int last, int cpu_time, int io_time)
{
struct tms start_time, current_time;
clock_t utime, stime;
int sleep_time;
while (last > 0)
{
/* CPU Burst */
times(&start_time);
/* 其实只有t.tms_utime才是真正的CPU时间。但我们是在模拟一个
* 只在用户状态运行的CPU大户,就像“for(;;);”。所以把t.tms_stime
* 加上很合理。*/
do
{
times(¤t_time);
utime = current_time.tms_utime - start_time.tms_utime;
stime = current_time.tms_stime - start_time.tms_stime;
} while ( ( (utime + stime) / HZ ) < cpu_time );
last -= cpu_time;
if (last <= 0 )
break;
/* IO Burst */
/* 用sleep(1)模拟1秒钟的I/O操作 */
sleep_time=0;
while (sleep_time < io_time)
{
sleep(1);
sleep_time++;
}
last -= sleep_time;
}
}
挂载代码:sudo ./mount-hdc
将process文件用cp指令复制到hdc/usr/root目录下,然后在oslab目录执行./run,启动系统。
 执行process之后,会生成log文件(这个文件在hdc/var目录下,退出linux-0.11,hdc会自动卸载,再挂载一次就行了),但注意一定要刷新,然后将log文件拷贝到oslab目录下。

6.编写python文件stat_log.py(这个文件放在oslab下),统计进程的运行信息。
#!/usr/share/python
import sys
import copy

P_NULL = 0
P_NEW = 1
P_READY = 2
P_RUNNING = 4
P_WAITING = 8
P_EXIT = 16

S_STATE = 0
S_TIME = 1

HZ = 100

graph_title = r"""
-----===< COOL GRAPHIC OF SCHEDULER >===-----

             [Symbol]   [Meaning]
         ~~~~~~~~~~~~~~~~~~~~~~~~~~~
             number   PID or tick
              "-"     New or Exit
              "#"       Running
              "|"        Ready
              ":"       Waiting
                    / Running with
              "+" -|     Ready
                    \and/or Waiting

-----===< !!!!!!!!!!!!!!!!!!!!!!!!! >===-----
"""

usage = """
Usage:
%s /path/to/process.log [PID1] [PID2] ... [-x PID1 [PID2] ... ] [-m] [-g]

Example:
# Include process 6, 7, 8 and 9 in statistics only. (Unit: tick)
%s /path/to/process.log 6 7 8 9

# Exclude process 0 and 1 from statistics. (Unit: tick)
%s /path/to/process.log -x 0 1

# Include process 6 and 7 only and print a COOL "graphic"! (Unit: millisecond)
%s /path/to/process.log 6 7 -m -g

# Include all processes and print a COOL "graphic"! (Unit: tick)
%s /path/to/process.log -g
"""

class MyError(Exception):
    pass

class DuplicateNew(MyError):
    def __init__(self, pid):
	    args = "More than one 'N' for process %d." % pid
	    MyError.__init__(self, args)

class UnknownState(MyError):
    def __init__(self, state):
	    args = "Unknown state '%s' found." % state
	    MyError.__init__(self, args)

class BadTime(MyError):
    def __init__(self, time):
	    args = "The time '%d' is bad. It should >= previous line's time." % time
	    MyError.__init__(self, args)

class TaskHasExited(MyError):
    def __init__(self, state):
	    args = "The process has exited. Why it enter '%s' state again?" % state
	    MyError.__init__(self, args)

class BadFormat(MyError):
    def __init__(self):
	    args = "Bad log format"
	    MyError.__init__(self, args)

class RepeatState(MyError):
	def __init__(self, pid):
		args = "Previous state of process %d is identical with this line." % (pid)
		MyError.__init__(self, args)

class SameLine(MyError):
	def __init__(self):
		args = "It is a clone of previous line."
		MyError.__init__(self, args)

class NoNew(MyError):
	def __init__(self, pid, state):
		args = "The first state of process %d is '%s'. Why not 'N'?" % (pid, state)
		MyError.__init__(self, args)

class statistics:
	def __init__(self, pool, include, exclude):
		if include:
			self.pool = process_pool()
			for process in pool:
				if process.getpid() in include:
					self.pool.add(process)
		else:
			self.pool = copy.copy(pool)

		if exclude:
			for pid in exclude:
				if self.pool.get_process(pid):
					self.pool.remove(pid)

	def list_pid(self):
		l = []
		for process in self.pool:
			l.append(process.getpid())
		return l

	def average_turnaround(self):
		if len(self.pool) == 0:
			return 0
		sum = 0
		for process in self.pool:
			sum += process.turnaround_time()
		return float(sum) / len(self.pool)

	def average_waiting(self):
		if len(self.pool) == 0:
			return 0
		sum = 0
		for process in self.pool:
			sum += process.waiting_time()
		return float(sum) / len(self.pool)

	def begin_time(self):
		begin = 0xEFFFFF
		for p in self.pool:
			if p.begin_time() < begin:
				begin = p.begin_time()
		return begin

	def end_time(self):
		end = 0
		for p in self.pool:
			if p.end_time() > end:
				end = p.end_time()
		return end

	def throughput(self):
		return len(self.pool) * HZ / float(self.end_time() - self.begin_time())

	def print_graphic(self):
		begin = self.begin_time()
		end = self.end_time()

		print graph_title

		for i in range(begin, end+1):
			line = "%5d " % i
			for p in self.pool:
				state = p.get_state(i)
				if state & P_NEW:
					line += "-"
				elif state == P_READY or state == P_READY | P_WAITING:
					line += "|"
				elif state == P_RUNNING:
					line += "#"
				elif state == P_WAITING:
					line += ":"
				elif state & P_EXIT:
					line += "-"
				elif state == P_NULL:
					line += " "
				elif state & P_RUNNING:
					line += "+"
				else:
					assert False
				if p.get_state(i-1) != state and state != P_NULL:
					line += "%-3d" % p.getpid()
				else:
					line += "   "
			print line

class process_pool:
	def __init__(self):
		self.list = []

	def get_process(self, pid):
		for process in self.list:
			if process.getpid() == pid:
				return process
		return None

	def remove(self, pid):
		for process in self.list:
			if process.getpid() == pid:
				self.list.remove(process)

	def new(self, pid, time):
		p = self.get_process(pid)
		if p:
			if pid != 0:
				raise DuplicateNew(pid)
			else:
				p.states=[(P_NEW, time)]
		else:
			p = process(pid, time)
			self.list.append(p)
		return p

	def add(self, p):
		self.list.append(p)

	def __len__(self):
		return len(self.list)

	def __iter__(self):
		return iter(self.list)

class process:
	def __init__(self, pid, time):
		self.pid = pid
		self.states = [(P_NEW, time)]

	def getpid(self):
		return self.pid

	def change_state(self, state, time):
		last_state, last_time = self.states[-1]
		if state == P_NEW:
			raise DuplicateNew(pid)
		if time < last_time:
			raise BadTime(time)
		if last_state == P_EXIT:
			raise TaskHasExited(state)
		if last_state == state and self.pid != 0: # task 0 can have duplicate state
			raise RepeatState(self.pid)

		self.states.append((state, time))

	def get_state(self, time):
		rval = P_NULL
		combo = P_NULL
		if self.begin_time() <= time <= self.end_time():
			for state, s_time in self.states:
				if s_time < time:
					rval = state
				elif s_time == time:
					combo |= state
				else:
					break
			if combo:
				rval = combo
		return rval

	def turnaround_time(self):
		return self.states[-1][S_TIME] - self.states[0][S_TIME]

	def waiting_time(self):
		return self.state_last_time(P_READY)

	def cpu_time(self):
		return self.state_last_time(P_RUNNING)

	def io_time(self):
		return self.state_last_time(P_WAITING)

	def state_last_time(self, state):
		time = 0
		state_begin = 0
		for s,t in self.states:
			if s == state:
				state_begin = t
			elif state_begin != 0:
				assert state_begin <= t
				time += t - state_begin
				state_begin = 0
		return time


	def begin_time(self):
		return self.states[0][S_TIME]

	def end_time(self):
		return self.states[-1][S_TIME]

# Enter point
if len(sys.argv) < 2:
	print usage.replace("%s", sys.argv[0])
	sys.exit(0)

# parse arguments
include = []
exclude = []
unit_ms = False
graphic = False
ex_mark = False

try:
	for arg in sys.argv[2:]:
		if arg == '-m':
			unit_ms = True
			continue
		if arg == '-g':
			graphic = True
			continue
		if not ex_mark:
			if arg == '-x':
				ex_mark = True
			else:
				include.append(int(arg))
		else:
			exclude.append(int(arg))
except ValueError:
	print "Bad argument '%s'" % arg
	sys.exit(-1)

# parse log file and construct processes
processes = process_pool()

f = open(sys.argv[1], "r")

# Patch process 0's New & Run state
processes.new(0, 40).change_state(P_RUNNING, 40)

try:
	prev_time = 0
	prev_line = ""
	for lineno, line in enumerate(f):

		if line == prev_line:
			raise SameLine
		prev_line = line

		fields = line.split("\t")
		if len(fields) != 3:
			raise BadFormat

		pid = int(fields[0])
		s = fields[1].upper()

		time = int(fields[2])
		if time < prev_time:
			raise BadTime(time)
		prev_time = time

		p = processes.get_process(pid)

		state = P_NULL
		if s == 'N':
			processes.new(pid, time)
		elif s == 'J':
			state = P_READY
		elif s == 'R':
			state = P_RUNNING
		elif s == 'W':
			state = P_WAITING
		elif s == 'E':
			state = P_EXIT
		else:
			raise UnknownState(s)
		if state != P_NULL:
			if not p:
				raise NoNew(pid, s)
			p.change_state(state, time)
except MyError, err:
	print "Error at line %d: %s" % (lineno+1, err)
	sys.exit(0)

# Stats
stats = statistics(processes, include, exclude)
att = stats.average_turnaround()
awt = stats.average_waiting()
if unit_ms:
	unit = "ms"
	att *= 1000/HZ
	awt *= 1000/HZ
else:
	unit = "tick"
print "(Unit: %s)" % unit
print "Process   Turnaround   Waiting   CPU Burst   I/O Burst"
for pid in stats.list_pid():
	p = processes.get_process(pid)
	tt = p.turnaround_time()
	wt = p.waiting_time()
	cpu = p.cpu_time()
	io = p.io_time()

	if unit_ms:
		print "%7d   %10d   %7d   %9d   %9d" % (pid, tt*1000/HZ, wt*1000/HZ, cpu*1000/HZ, io*1000/HZ)
	else:
		print "%7d   %10d   %7d   %9d   %9d" % (pid, tt, wt, cpu, io)
print "Average:  %10.2f   %7.2f" % (att, awt)
print "Throughout: %.2f/s" % (stats.throughput())

if graphic:
	stats.print_graphic()
运行这个文件:python2 stat_log.py process.log,得到实验结果。

参考博客: