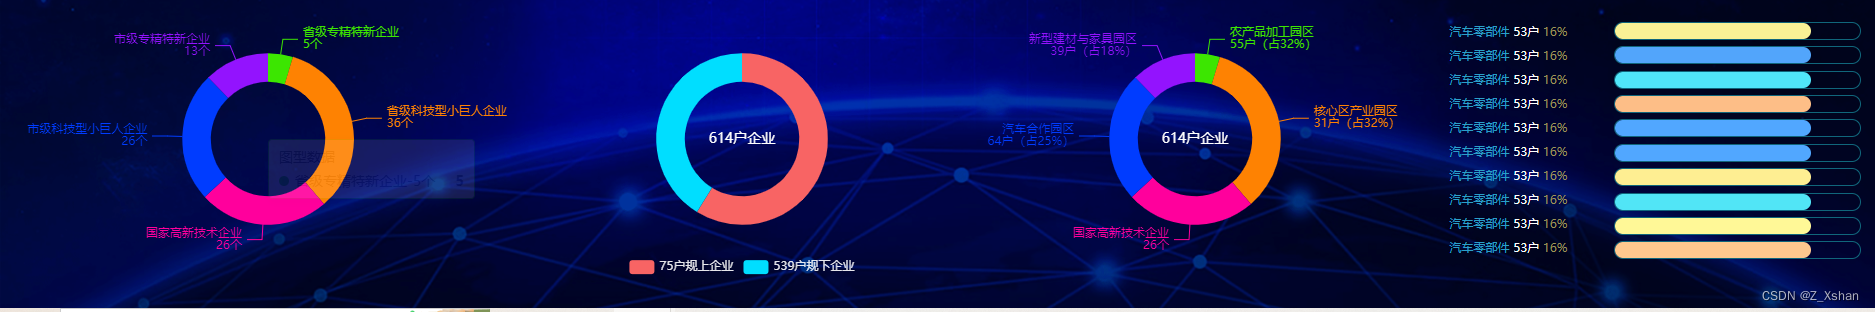
先看效果
给环形图设置对应颜色和指示线超出换行

const formatter = (val) => {
      return val.split("-").join("\n");
    };
itemStyle: {
normal: {
// 指示线文字换行
label: {
formatter: function (val) {
return val.name.split("-").join("\n");
},
},
// 对应图形的颜色
color: (params) => {
console.log(params, "123");
var index = params.dataIndex;
return colorList.value[index];
},
},
},给对应的指示线换颜色
let colorList = ref([
"#3ce601",
"#fe8202",
"#ff009c",
"#003cff",
"#9313fe",
]);
let pieDate = ref([
{
value: 5,
name: "省级专精特新企业-5个",
},
{ value: 36, name: "省级科技型小巨人企业-36个" },
{ value: 26, name: "国家高新技术企业-26个" },
{ value: 26, name: "市级科技型小巨人企业-26个" },
{ value: 13, name: "市级专精特新企业-13个" },
]);data: pieDate.value.map((item, index) => {
item.label = {
color: colorList.value[index],
};
return item;
}),给环形图中间加提示文字
graphic: {
type: "text",
left: "center",
top: "center",
style: {
text: "614户企业",
textAlign: "center",
fill: "#fff",
fontSize: 14,
},
},
series: []整体代码
let colorList = ref([
"#3ce601",
"#fe8202",
"#ff009c",
"#003cff",
"#9313fe",
]);
let pieDate = ref([
{
value: 5,
name: "省级专精特新企业-5个",
},
{ value: 36, name: "省级科技型小巨人企业-36个" },
{ value: 26, name: "国家高新技术企业-26个" },
{ value: 26, name: "市级科技型小巨人企业-26个" },
{ value: 13, name: "市级专精特新企业-13个" },
]);
option: {
tooltip: {
trigger: "item",
// (这里是相对位置,放置在容器正中间)提示框浮层的位置,默认不设置时位置会跟随鼠标的位置,[10, 10],回掉函数,inside鼠标所在图形的内部中心位置,top、left、bottom、right鼠标所在图形上侧,左侧,下侧,右侧,
position: ["50%", "50%"],
},
labelLine: {
show: false,
length: 10,
length2: 5,
},
series: [
{
name: "图型数据",
type: "pie",
radius: ["40%", "60%"],
avoidLabelOverlap: false,
// 给对应指示线换颜色
data: pieDate.value.map((item, index) => {
item.label = {
color: colorList.value[index],
};
return item;
}),
itemStyle: {
              normal: {
                // 指示线文字换行
                label: {
                  formatter: function (val) {
                    return val.name.split("-").join("\n");
                  },
                },
                // 对应图形的颜色
                color: (params) => {
                  console.log(params, "123");
                  var index = params.dataIndex;
                  return colorList.value[index];
                },
              },
            },
},
],
},