关于Pyecharts画图,图却不显示出来的问题,出问题可能有好几种原因。可能是版本问题、包没下全等等,在这边说的是一个很坑的问题,博主因为这个白白浪费了好几个小时和精力。
最近在做数据挖掘课设,用pandas处理数据,十分的方便,没错,图不显示就是因为它。下面为大家举个例子:
假设我们有一组数据,转为DataFrame或者Series后经过多种处理,最终从中提取出来,想要用pyecharts做一个图,于是就会出现文章标题这样的错误。
from pyecharts.charts import Bar
from pyecharts import options as opts
import pandas as pd
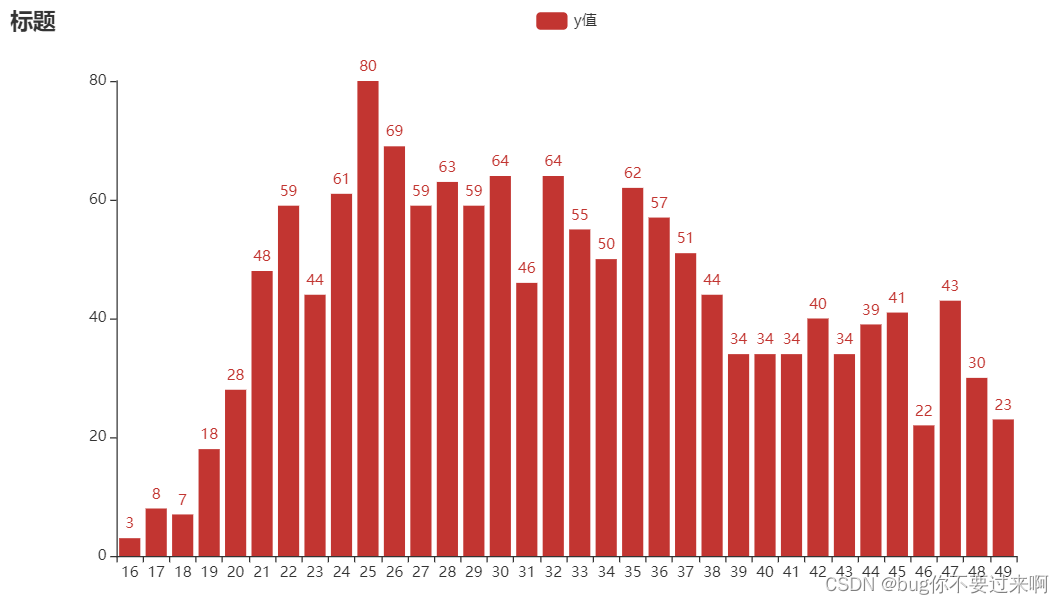
x = [16, 17, 18, 19, 20, 21, 22, 23, 24, 25, 26, 27, 28, 29, 30, 31, 32, 33, 34, 35, 36, 37, 38, 39, 40, 41, 42, 43, 44, 45, 46, 47, 48, 49]
y = [3, 8, 7, 18, 28, 48, 59, 44, 61, 80, 69, 59, 63, 59, 64, 46, 64, 55, 50, 62, 57, 51, 44, 34, 34, 34, 40, 34, 39, 41, 22, 43, 30, 23]
pdx = pd.Series(x)
pdy = pd.Series(y)
x_value = pdx.values
y_value = pdy.values
# Pyecharts 1.9.0所以支持链式表达
bar = (
Bar()
.add_xaxis(x_value)
.add_yaxis("y值", y_value)
.set_global_opts(title_opts=opts.TitleOpts(title="标题"))
)
bar.render()
让我们来看看这样画出来的图,就会发现它显示不出来。

原因如下:
print(x_value)
print(type(y_value))
print(type(y_value[0]))
打印出来之后就会发现:
[16 17 18 19 20 21 22 23 24 25 26 27 28 29 30 31 32 33 34 35 36 37 38 39
 40 41 42 43 44 45 46 47 48 49]
<class 'numpy.ndarray'>
<class 'numpy.int64'>
列表中的数据类型为numpy.int64
而pyecharts要求int类型的数据,所以画的柱状图无法显示数据。
正确的做法就是把数据全部转为int类型,或者不用pandas处理数据…
我尝试着在转为datafram、或series时将类型转为int,但它还是会自动转为numpy.int32。
pdx = pd.Series(x, dtype=int)
pdy = pd.Series(y, dtype=int)
print类型
<class 'numpy.ndarray'>
<class 'numpy.int32'>
不过知道原因之后就好解决了。
时隔半年我又来小小的更新一下,还是用之前的代码,之前的代码是错误示范,现在给大家正确的代码,如何解决
from pyecharts.charts import Bar
from pyecharts import options as opts
import pandas as pd

x = [16, 17, 18, 19, 20, 21, 22, 23, 24, 25, 26, 27, 28, 29, 30, 31, 32, 33, 34, 35, 36, 37, 38, 39, 40, 41, 42, 43, 44, 45, 46, 47, 48, 49]
y = [3, 8, 7, 18, 28, 48, 59, 44, 61, 80, 69, 59, 63, 59, 64, 46, 64, 55, 50, 62, 57, 51, 44, 34, 34, 34, 40, 34, 39, 41, 22, 43, 30, 23]
pdx = pd.Series(x)
pdy = pd.Series(y)
x_value = [int(value) for value in pdx.values]
y_value = [int(value) for value in pdy.values]

bar = (
    Bar()
    .add_xaxis(x_value)
    .add_yaxis("y值", y_value)
    .set_global_opts(title_opts=opts.TitleOpts(title="标题"))
)
bar.render()
其实就是整了一个列表推导式,把数据格式转成int就好,之前也这样试过来着,那时候不行,现在可以了,可能那时候写东西比较赶,没反应过来,这样就解决了。