环境搭建:
环境:win10+Anaconda +jupyter Notebook
库:Numpy,pandas,matplotlib,seaborn ,missingno,各种包的管理和安装主要利用conda和pip。
数据集:保险理赔分析
探索问题:
1、理赔性别分布
2、年龄离散分布情况
3、地区分布
4、月收入离散分布
5、年收入离散分布
6、理赔状态分布
7、索赔失败原因
8、保险种类分布
9、身体状况分析
# 导入需要的数据库:
import pandas as pd
import numpy as np
import seaborn as sns
sns.set()
import matplotlib.pyplot as plt


# 设置配置输出高清矢量图:
%config InlineBackend.figure_format = 'svg'
%matplotlib inline

# 使用pandas进行数据读入和分析:
data = pd.read_excel("D:/Insurance_claims.xls")

# 输出主要信息:
data.info()
<class 'pandas.core.frame.DataFrame'>
RangeIndex: 18740 entries, 0 to 18739
Data columns (total 14 columns):
 #   Column  Non-Null Count  Dtype
---  ------  --------------  -----
 0   性别      18740 non-null  object
 1   姓名      18740 non-null  object
 2   年龄      18740 non-null  int64
 3   地区      18740 non-null  object
 4   保险理赔日期  18740 non-null  object
 5   月收入     18740 non-null  int64
 6   年收入     18740 non-null  int64
 7   电话      18740 non-null  int64
 8   身体状况    18740 non-null  object
 9   保险单号    18740 non-null  object
 10  理赔状态    18740 non-null  object
 11  索赔失败原因  11388 non-null  object
 12  保险赔付费   18740 non-null  int64
 13  保险种类    18740 non-null  object
dtypes: int64(5), object(9)
memory usage: 2.0+ MB
# 获得行数和列数
rows = len(data)
columns = len(house.columns)
print(rows,columns)
# 输出列的数据类型
columns_type = house.dtypes
columns_type
18740 14


性别        object
姓名        object
年龄         int64
地区        object
保险理赔日期    object
月收入        int64
年收入        int64
电话         int64
身体状况      object
保险单号      object
理赔状态      object
索赔失败原因    object
保险赔付费      int64
保险种类      object
dtype: object
# 为了显示中文
from pylab import mpl
mpl.rcParams['font.sans-serif'] = [u'SimHei']
mpl.rcParams['axes.unicode_minus'] = False
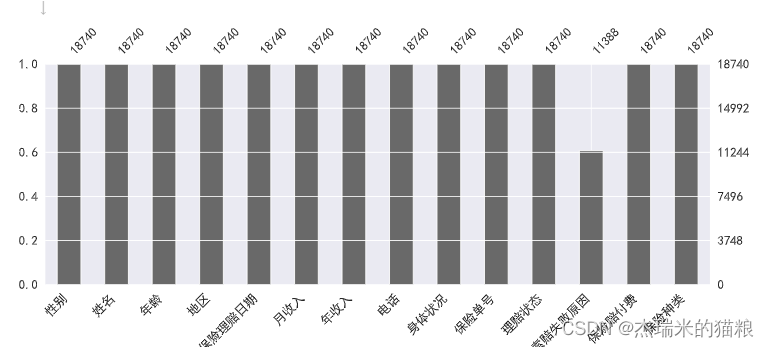
# 通过上述info信息我们发现有数据的缺失值,在此我们统计一下缺失情况:
missing_values = data.isnull().sum()
print(missing_values)
# 通过可视化展现为:
import missingno as msno
msno.matrix(data,figsize = (12,5), labels=True)
性别           0
姓名           0
年龄           0
地区           0
保险理赔日期       0
月收入          0
年收入          0
电话           0
身体状况         0
保险单号         0
理赔状态         0
索赔失败原因    7352
保险赔付费        0
保险种类         0
dtype: int64


<Axes: >
![[外链图片转存失败,源站可能有防盗链机制,建议将图片保存下来直接上传(img-Y52olG5f-1684846522333)(output_5_2.svg)]](https://img-blog.csdnimg.cn/15b40ee6cb014bdd940b751a46a77a07.png)
msno.bar(data,figsize = (15,5)) # 条形图显示
<Axes: >
数据清洗:
本阶段的数据处理,主要针对前一阶段所提出的资料问题:缺失值问题。清理有两个目标:首先,清理使数据变得可用。第二个目的,就是将这些数据,转化成更好的数据,用来做分析。一般来说,一个"脏"的数据必须是清楚的,一个"净"的数据必须是清洁的。
在缺少数据的处理中,我们通常会将缺少的数据剔除掉。在 pandas模块中,可以使用 dropna ()来删除含有 NaN值的行。
如果是数值型的数据,可以用该列的数据的平均值或者中位数来代替,如果是分类型的数据,可以用该列数据的出现频数最多的数据(众数)来填补。如果无法解决的空白数值,可以暂且搁置,不用急着删除。因为在以后的条件下:以后的操作可以略过这个 null值。
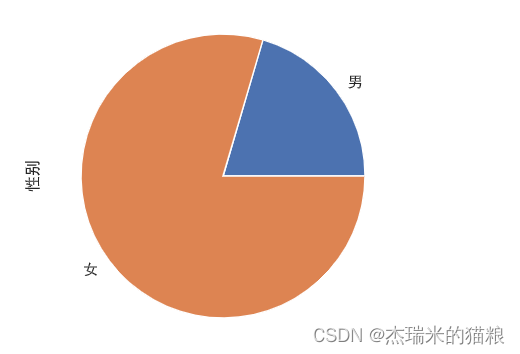
# 性别分布:
gender = data['性别'].value_counts(ascending=True)
print(gender)
gender.plot.pie()
# 理赔案件以女性居多,要不说有女司机这一梗
男     3837
女    14903
Name: 性别, dtype: int64


<Axes: ylabel='性别'>
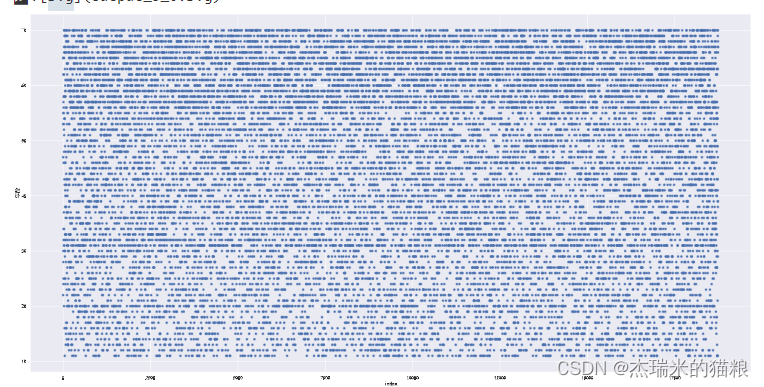
# 年龄分布:
type(data['年龄'])
df = data['年龄'].to_frame()
column = df.columns[0]
df['index'] = df.index.tolist()
df.plot.scatter(x='index', y=column,figsize = (30,15))
plt.show()
# 理赔案件在年龄大的区域较多,可能年轻人涉事较少,没有经验,或者年轻人并没与足够的钱去购买保险。
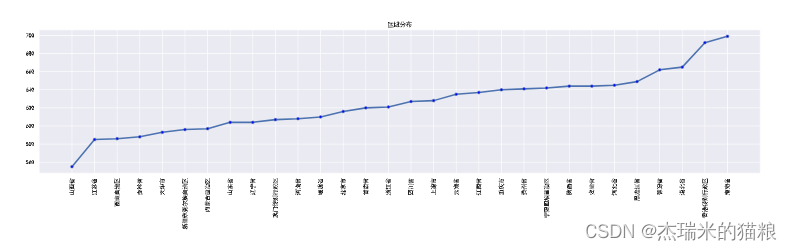
# 区域分布:
region = data['地区'].value_counts(ascending=True)
print(region)
plt.figure(figsize= (25 ,5))#创建画布
plt.xticks(rotation = 90)  # 横坐标
plt.plot(region, linewidth=3, marker='o',
         markerfacecolor='blue', markersize=5)

plt.title('区域分布')
plt.show()
# 案件以海南省为最多
山西省          555
江苏省          585
西藏自治区        586
吉林省          588
天津市          593
新疆维吾尔族自治区    596
内蒙古自治区       597
山东省          604
辽宁省          604
澳门特别行政区      607
河南省          608
福建省          610
北京市          616
甘肃省          620
浙江省          621
四川省          627
上海市          628
云南省          635
江西省          637
重庆市          640
贵州省          641
宁夏回族自治区      642
陕西省          644
安徽省          644
河北省          645
黑龙江省         649
青海省          662
湖北省          665
香港特别行政区      692
海南省          699
Name: 地区, dtype: int64
# 月收入分析:
data['月收入'].describe()
count    18740.000000
mean      4759.274066
std       6170.065566
min        200.000000
25%        919.000000
50%       2584.500000
75%       5434.250000
max      49934.000000
Name: 月收入, dtype: float64
# 年收入分析:
data['年收入'].describe()
count     18740.000000
mean      73578.522785
std       74427.940579
min        5563.000000
25%       29920.000000
50%       47891.000000
75%       83821.000000
max      625194.000000
Name: 年收入, dtype: float64
pandas模块中,提供了将包含NaN值的行删除的方法dropna()
数据可视化
pandas.pivot_table函数中包含四个主要的变量,以及一些可选择使用的参数。四个主要的变量分别是数据源data,行索引index,列columns,和数值values。可选择使用的参数包括数值的汇总方式,NaN值的处理方式,以及是否显示汇总行数据等。
在可视化分析方面,会涉及到python常用的绘图库:matplotlib和seaborn,网上已经有非常多的使用指南,这里就不多说了,以后有时间,也会做一些总结。
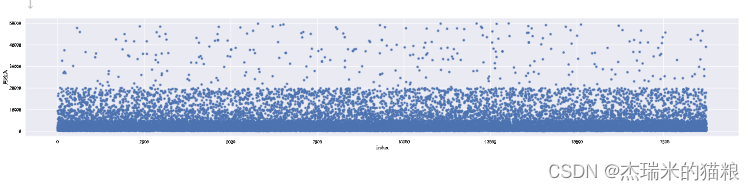
# 月收入散点图分析:
type(data['月收入'])
df = data['月收入'].to_frame()
column = df.columns[0]
df['index'] = df.index.tolist()
df.plot.scatter(x='index', y=column,figsize = (30,5))
plt.show()
# 我们发现在图中展现出四个阶层,<=5000,<=10000,<=20000,>=20000,说明大多数人都在5000左右的月收入内,
# 年收入散点图分析:
type(data['年收入'])
df = data['年收入'].to_frame()
column = df.columns[0]
df['index'] = df.index.tolist()
df.plot.scatter(x='index', y=column,figsize = (30,5))
plt.show()
# 我们发现年收入分为几个区间的态势
![[外链图片转存失败,源站可能有防盗链机制,建议将图片保存下来直接上传(img-Ppp3vzqz-1684846522342)(output_16_0.svg)]
](https://img-blog.csdnimg.cn/73d9c7486e5f4f23a3d8c605015fa400.png)
# 使用工具进行区间划分
data["月收入阶层"]=pd.cut(data["月收入"],4)#将年龄列的数值划分为5等分
price_info = data["月收入阶层"].value_counts(sort=False)#查看每个分组有多少人数

price_info.plot(label='数量',title='月收入分布',figsize=(11,5))
plt.show()
# 我们发现这个区间划分较大
![[外链图片转存失败,源站可能有防盗链机制,建议将图片保存下来直接上传(img-vIKs7dns-1684846522343)(output_17_0.svg)]
](https://img-blog.csdnimg.cn/723567043a824c4b9161d9f658f52fb4.png)
# 理赔状态分布:
status = data['理赔状态'].value_counts(ascending=True)
print(status)
status.plot.pie()
# 大多以失败告终
成功     7352
失败    11388
Name: 理赔状态, dtype: int64


<Axes: ylabel='理赔状态'>
![[外链图片转存失败,源站可能有防盗链机制,建议将图片保存下来直接上传(img-1YxbRW1t-1684846522344)(output_18_2.svg)]](https://img-blog.csdnimg.cn/199fc37a240a414cafb3aff7bb7afabd.png)
# 索赔失败原因分析:
reason = data['索赔失败原因'].value_counts(ascending=True)
print(reason)
plt.figure(figsize= (10 ,5))#创建画布
plt.xticks(rotation = 90)  # 横坐标
plt.plot(reason, linewidth=3, marker='o',
         markerfacecolor='blue', markersize=5)

plt.title('索赔失败原因分析')
plt.show()
不符合理赔的范围             707
客户隐瞒事实              1409
当事人对保险的相关业务范围不了解    9272
Name: 索赔失败原因, dtype: int64
![[外链图片转存失败,源站可能有防盗链机制,建议将图片保存下来直接上传(img-zV89ojpQ-1684846522345)(output_19_1.svg)]](https://img-blog.csdnimg.cn/fd76bfe0ac164accadc5cb39c35fd80d.png)
# 保险种类分布:
kind = data['保险种类'].value_counts(ascending=True)
print(kind)
plt.figure(figsize= (10 ,5))#创建画布
plt.xticks(rotation = 90)  # 横坐标
plt.plot(kind, linewidth=3, marker='o',
         markerfacecolor='blue', markersize=5)

plt.title('保险种类分布')
plt.show()
# 大多以医疗为主的索赔
括养老保险       427
财产损失险       630
信用保证保险      885
生育保险       1238
失业保险       1392
责任保险       1417
工伤保险       2203
医疗保险      10548
Name: 保险种类, dtype: int64
![[外链图片转存失败,源站可能有防盗链机制,建议将图片保存下来直接上传(img-ec6u0pvD-1684846522346)(output_20_1.svg)]](https://img-blog.csdnimg.cn/4f53db5c61744169b7cc7162433b23c2.png)
# 理赔状态分布:
body = data['身体状况'].value_counts(ascending=True)
print(body)
body.plot.pie()
# 很多申请人都处于疾病状态
亚健康     2037
健康      7638
疾病状态    9065
Name: 身体状况, dtype: int64


<Axes: ylabel='身体状况'>
![[外链图片转存失败,源站可能有防盗链机制,建议将图片保存下来直接上传(img-kLGAwRQl-1684846522347)(output_21_2.svg)]
](https://img-blog.csdnimg.cn/d9ead7e8e60d414e85a54b409dd2926a.png)