记录和分析spark开发中遇到的问题
1 查看日志
| 日志来源 | 获取方式 | 特点 |
|---|---|---|
| 调度系统 | 直接查看调度产生日志 | 快速定位简单问题,日志最简洁,不能深度分析 |
| Spark UI | 在Spark UI上通过应用ID查看 | 图形化的展示,便于分析问题和执行过程,日志较全 |
| yarn log | yarn logs -applicationId app_ld > res.log | 日志文本,但日志最为详细,深度分析问题 |
日志丢
1. 日志丢失
1)driver所在节点丢失,缩容或spot回收。
2 资源不足
driver、excutor都有可能内存不足;
1. 错误代码-134
聚合函数导致内存溢出
1. 错误描述
Container exited with a non-zero exit code 134. Error file: prelaunch.err.
Last 4096 bytes of prelaunch.err
2. 函数
collect_set 、 collect_list
3. 原因
某个key值(null, unknown, 空串)过多, 被聚合的value值过多, 导致范围(数组超范围)超限;
4. 解决方法
1) 调大内存
2) 找出超限的key值过滤掉;
2. 错误代码-104
广播join导致内存溢出
diagnostics: Application application_id failed 2 times due to AM Container for appattempt_id exited with exitCode: -104
Container is running beyond physical memory limits. Current usage: 2.4 GB of 2.4 GB physical memory used; 4.4 GB of 11.9 GB virtual memory used. Killing container.
3. 错误代码-137
容器内存不足
1. 错误描述
Job aborted due to stage failure: Task 2 in stage 26.0 failed 4 times, most recent failure: Lost task 2.3 in stage 26.0 (TID 3253, ip-10-20-68-111.eu-west-1.compute.internal, executor 43): ExecutorLostFailure (executor 43 exited caused by one of the running tasks) Reason: Container from a bad node: container_e03_1634810603944_186010_01_000121 on host: ip-10-20-68-111.eu-west-1.compute.internal. Exit status: 137. Diagnostics: [2022-05-27 01:49:51.535]Container killed on request. Exit code is 137
2. 解决方法
解决 Amazon EMR 上 Spark 中的“Container killed on request.Exit code is 137”
AWS EMR 上 Spark 任务 Container killed Exit code 137 错误
4. 错误代码-OutOfMemoryError
1 driver内存溢出
1)错误提示
java.lang.OutOfMemoryError: GC overhead limit exceeded
-XX:OnOutOfMemoryError="kill -9 %p"
Executing /bin/sh -c "kill -9 29082"...
java.lang.OutOfMemoryError: Java heap space
-XX:OnOutOfMemoryError="kill -9 %p
Executing /bin/sh -c "kill -9 234632)可能原因
| 问题原因 | 解决方案 |
|---|---|
| 广播了较大的表 | a. 增加内存; b. 取消要广播的表 |
| 数据源分区过多 | a. 增加内存 b. 缩减上游分区 |
| collect到driver端的数据过多 | a. 增加内存 b. 减小结果集 |
| driver端所在服务器资源不足 | a. 适当降低driver但内存 b. 切换到资源充足的服务器 |
-
3. 缓存失效
问题描述:spark3当cache表 where 后有 in 过滤时 不会走cache ,而再去读源数据
-- 不走cache写法:
cache table test_tamp1 as(
    select
        id
    from
        table_name_01
    where
        dt = '20230326'
        and pkg in (select pkg from table_name_02)
    group by
        id
);


解决方法
-- join替代in操作
cache table test_tamp1 as(
    select
        id
    from
        table_name_01 aa
    left semi join
        table_name_02 bb
        on aa.pkg = bb.pkg
    where
        dt = '20230326'
    group by
        id
);

-- 设置参数
set spark.sql.legacy.storeAnalyzedPlanForView=true;
4 数据倾斜
可能原因:
1)关联时出现了热键(null值、异常值);
2)coalesce缩减分区,导致数据倾斜;
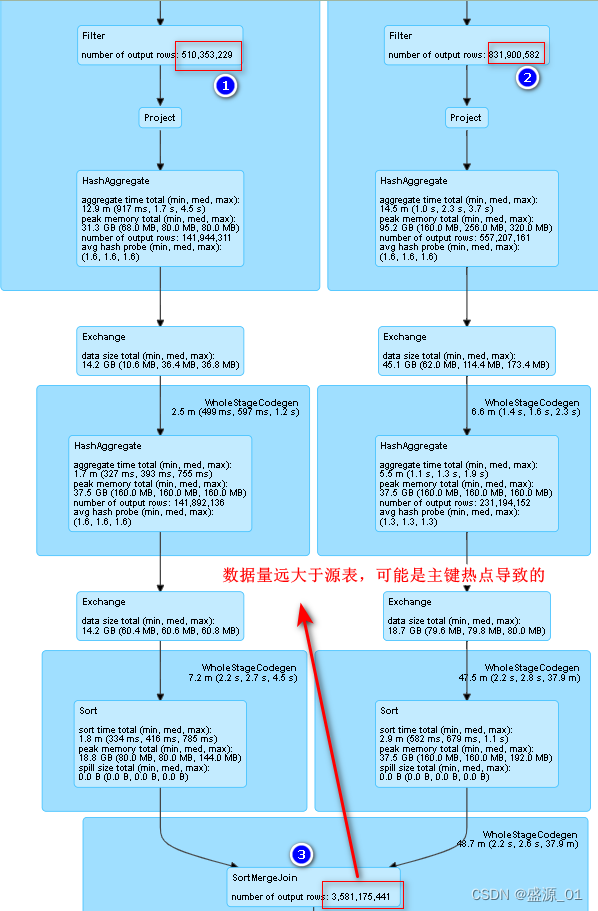
1 查看运行日志
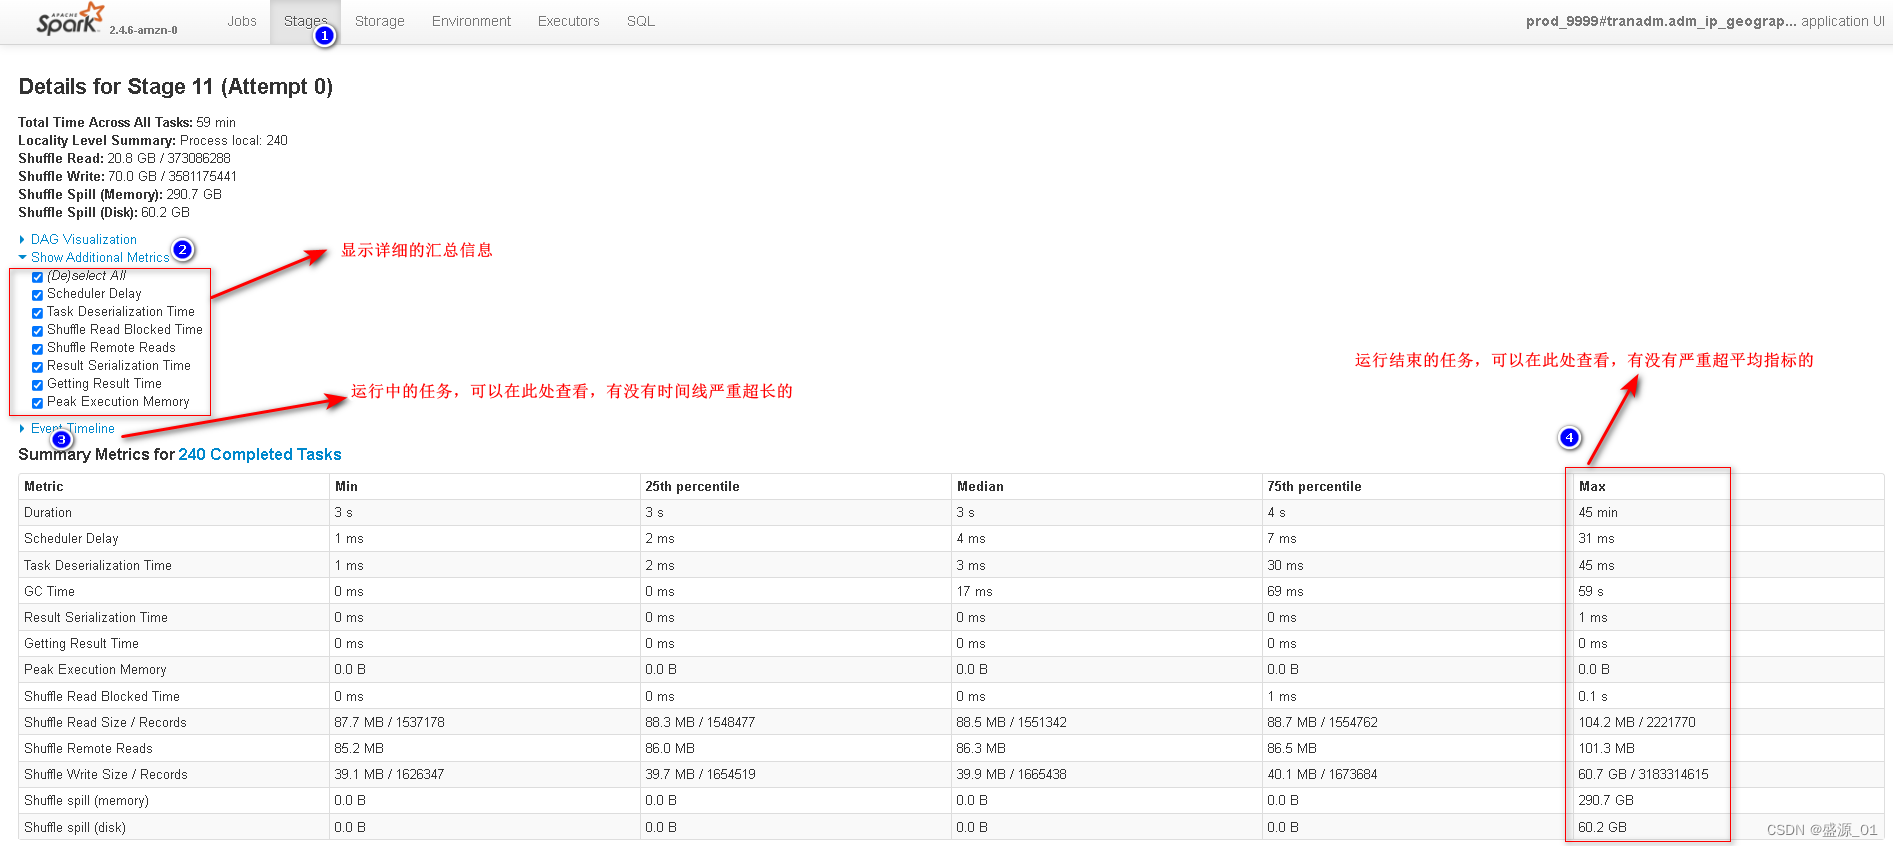
2 查找倾斜主键
1 源表主键分布
直接分析源表,数据不会暴增,查询迅速
2 关联统计主键分布
已经发生倾斜,查询速度慢
3 优化措施
1 过滤掉无效和异常主键
1)id = '异常主键'
2) id is null
3) id = ''
5. 写出阶段出错
1)增加并行度
2)增加内存
3)溢写到磁盘
6. 栈溢出错误
java.lang.StackOverflowError
`java.lang.StackOverflowError`通常是由于递归调用深度过大导致的。在Spark中,可能会出现这种情况,尤其是当你进行复杂的联接或者嵌套多个数据处理操作时。
导致这个问题的场景:
union 太多的表
为了避免这种情况,你可以尝试以下几个解决办法
1. 增加JVM的堆栈大小:在启动应用程序时设置`-Xss`参数可以增加JVM的堆栈大小。例如,`spark-submit --conf spark.driver.extraJavaOptions=-Xss4m yourApp.jar`,将堆栈大小设置为4MB。但是,这种方法可能会导致JVM使用更多的内存,因此需要谨慎使用。
2. 使用`repartition`方法:`repartition`方法可以重新分区数据,从而减少联接时的负载。例如,如果你的数据集中有100个分区,你可以使用`df.repartition(10)`将其划分为10个分区,以减少负载。
3. 使用`broadcast`变量:`broadcast`变量可以将变量广播到所有的工作节点。这种方法通常适用于小型数据集,可以减少每个工作节点的负载。例如,如果你需要联接一个非常大的数据集和一个非常小的数据集,你可以将小的数据集广播到所有的工作节点,以减少负载。
10 其他汇总
| 中文描述 | 错误代码 | 解决方法 |
|---|---|---|
| 不能读表 | Error in query: java.lang.IllegalArgumentException: Can not create a Path from an empty string; |
1 在hive上重新创建视图 |
| 不能直接读取文件 | catalyst.analysis.UnresolvedException: Invalid call to dataType on unresolved object, tree | 1 读取了不存在的列 |
| 删除其他分区数据 | 动态分区 OverWrite 问题 | Apache Spark 动态分区 OverWrite 问题 – 过往记忆 |
| 不能读写同一个表 | Error in query: Cannot overwrite a path that is also being read from. |
-- 不使用hive元数据 set spark.sql.hive.convertMetastoreParquet=false; set spark.sql.hive.convertMetastoreOrc=false; |
| 设定参数没有生效 | 1. spark的environment中确认 2. 是否又被覆盖了(中间组件导致的,像kyuubi有自己的默认参数) |
-
20 待解决问题
| 序号 | 问题描述 |
|---|---|
| 1 | select * from table_name where dt = '20220423' 过滤数据后写出到表, 如何控制写出的并行度, 又可以增大处理的并行度 |
| 2 | spark-sql 中如何处理异常 |
| 3 | 多表关联时,如何串行加载各表 |