最近确实是没有时间写博客了,所以都是把原来各处的东西搜集了起来。这是之前在知乎上面我的一个回答,当时时间仓促也没有写完,这次先放到博客上,再慢慢更新。原地址
首先想到的是ArcGIS平台的 Space Time Cube。它实现方式基本上和你的想法一样。
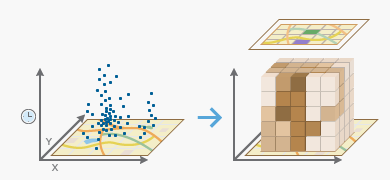
我对这方面比较感兴趣,但是没具体使用过这个工具,不能给出详细的评论和操作步骤。所以先贴一下示意图。细节部分,只有以后有空了再补充了。算是提供个方向和思路吧。
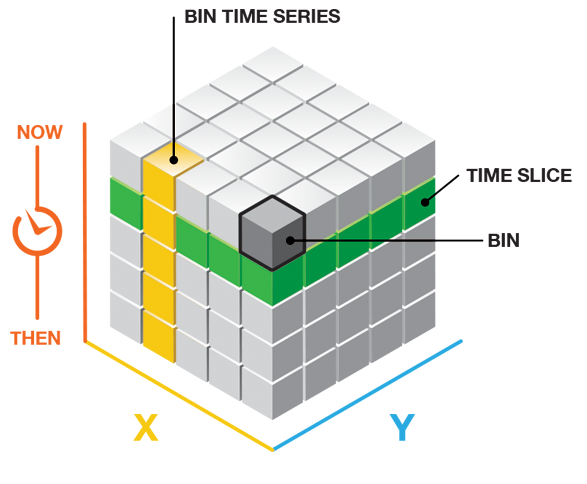
Space Time Cube
This tool aggregates your point Input Features into space-time bins. The data structure it creates can be thought of as a three-dimensional cube made up of space-time bins with the x and y dimensions representing space and the t dimension representing time.
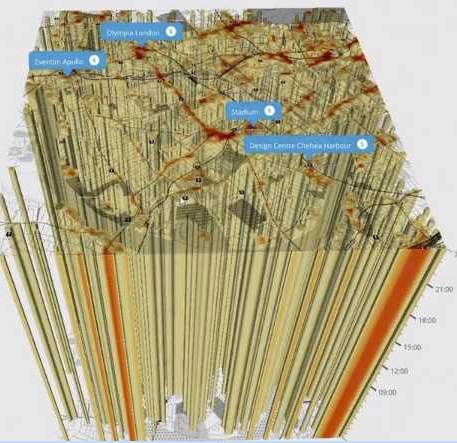
效果大概是这样的:
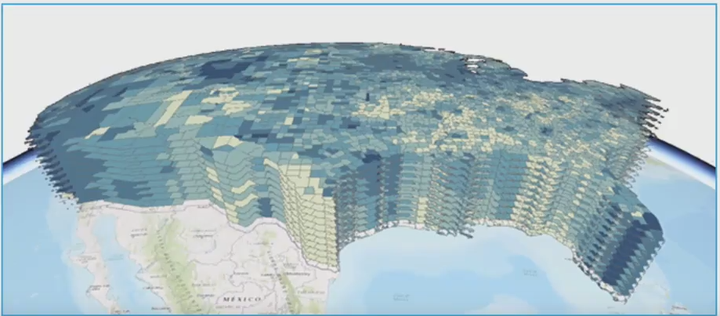
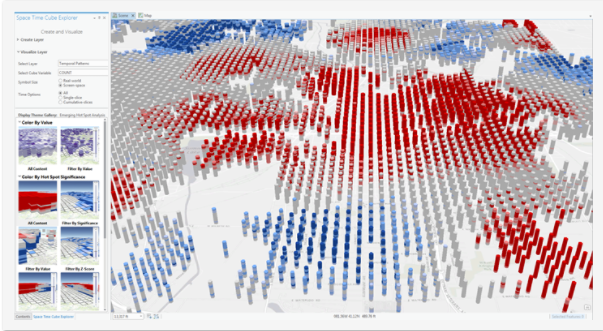
(虽然美观性差一点,我猜想这种组织方式和表现形式对于大数据的支持和时空数据挖掘比较有帮助吧)
相关链接:
Create Space Time Cube By Aggregating Points
How Creating a Space Time Cube works
The Space Time Cube Explorer Add-in for ArcGIS Pro has been Released!
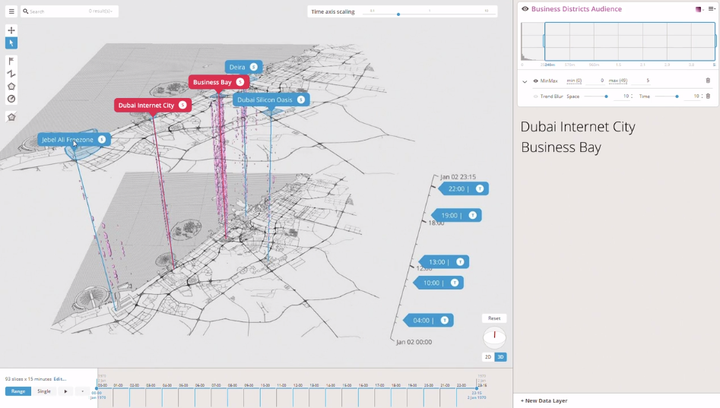
其他印象较深的相关产品
有兴趣可以顺着后面的链接去看看。