1、首先创建好 Vue 的项目,创建好之后在控制台输入
//安装 echarts
npm install echarts --save
2、接下来在 main.js 中进行引入
// 引入Echarts
import echarts from "echarts"
Vue.prototype.$echarts = echarts
3、创建一个 Vue 页面对 Echarts 曲线图进行一个简单的展示
<template>
  <div class="EchartPractice">
    <div id="main"></div>
  </div>
</template>

<script>
  export default {
    name: "EchartPractice",
    methods:{
      drawChart() {
        let myEchart = this.$echarts.init(document.getElementById("main"));
        let option = {
					xAxis: {
						data: ['7.8', '7.9', '7.10', '7.11', '7.12', '7.13', '7.14']
					},
					yAxis: {},
					series: [{
						data: [60, 80, 100, 120, 200, 170,180],
						type: 'line',
						smooth: true,
						symbol: "none",
						areaStyle: {
							color: '#344CE9',
							opacity: 0.5
						}
					}]
				};
        myEchart.setOption(option);
      }
    },
    mounted() {
      this.drawChart();
    }
  }
</script>

<style scoped>
  #main {
    width: 600px;
    height:400px;
    margin: auto;
    margin-top: 100px
  }
</style>
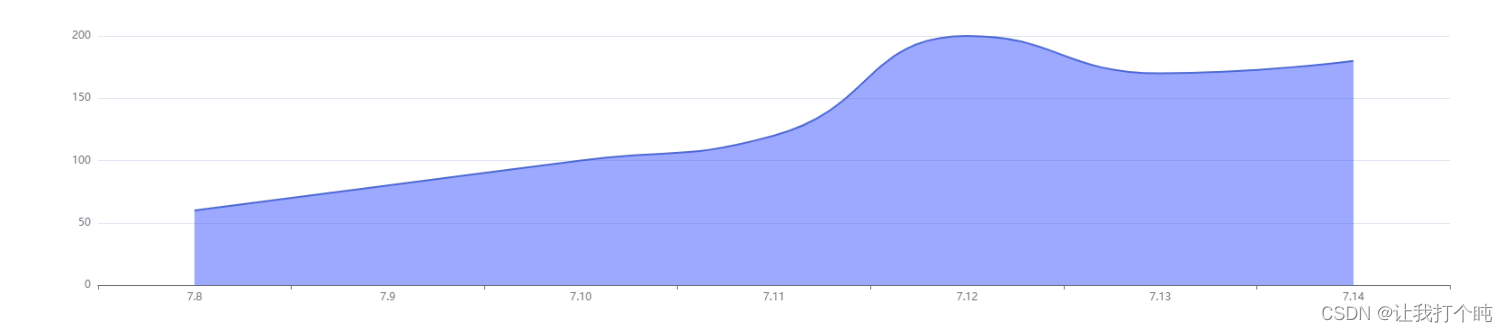
4.页面效果如下图所示