转自 https://blog.csdn.net/LiuMiao1128/article/details/68060287
php.ini 配置 需要添加如下内容
[XDebug]
xdebug.profiler_output_dir="D:\phpStudy\tmp\xdebug"
xdebug.trace_output_dir="D:\phpStudy\tmp\xdebug"
zend_extension="D:\phpStudy\php\php-5.6.27-nts\ext\php_xdebug.dll"

;zend_extension = D:\phpStudy\php\php-5.6.27-nts\ext\php_xdebug-2.5.1-5.6-vc11-x86_64.dll
xdebug.remote_enable =1
xdebug.remote_handler = "dbgp"
xdebug.idekey = PHPSTORM
xdebug.remote_host = "127.0.0.1"
xdebug.remote_port = 9000
- 1
- 2
- 3
- 4
- 5
- 6
- 7
- 8
- 9
- 10
- 11
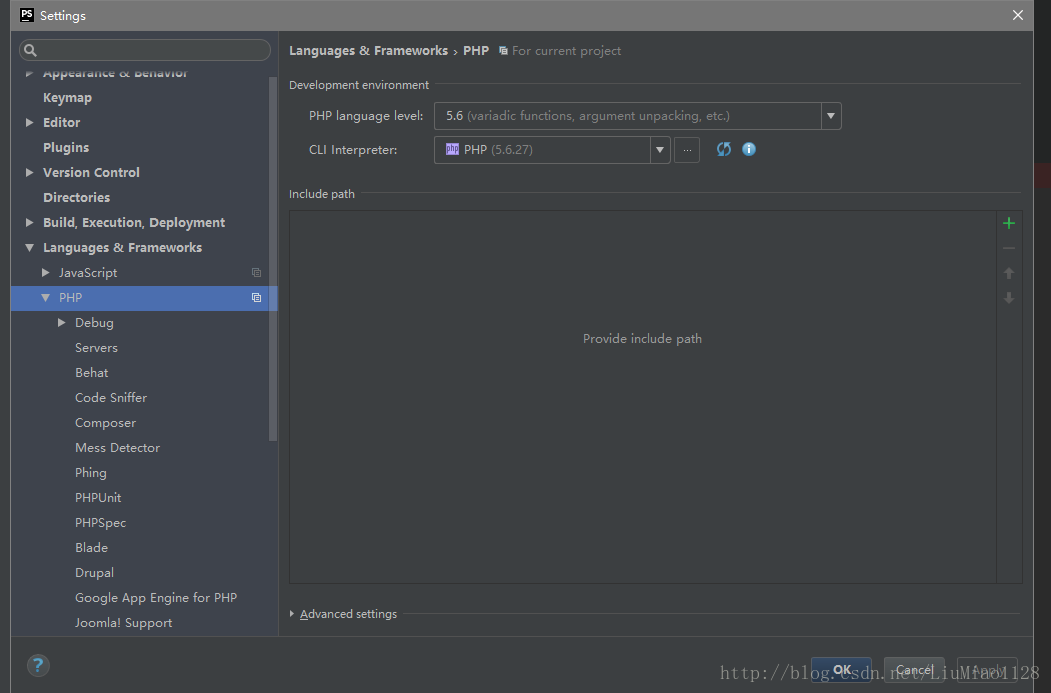
php languagel level: 这个是PHP的版本
cli interpreler 选择PHP的文件所在位置,最后选择为php-cgi.exe 文件
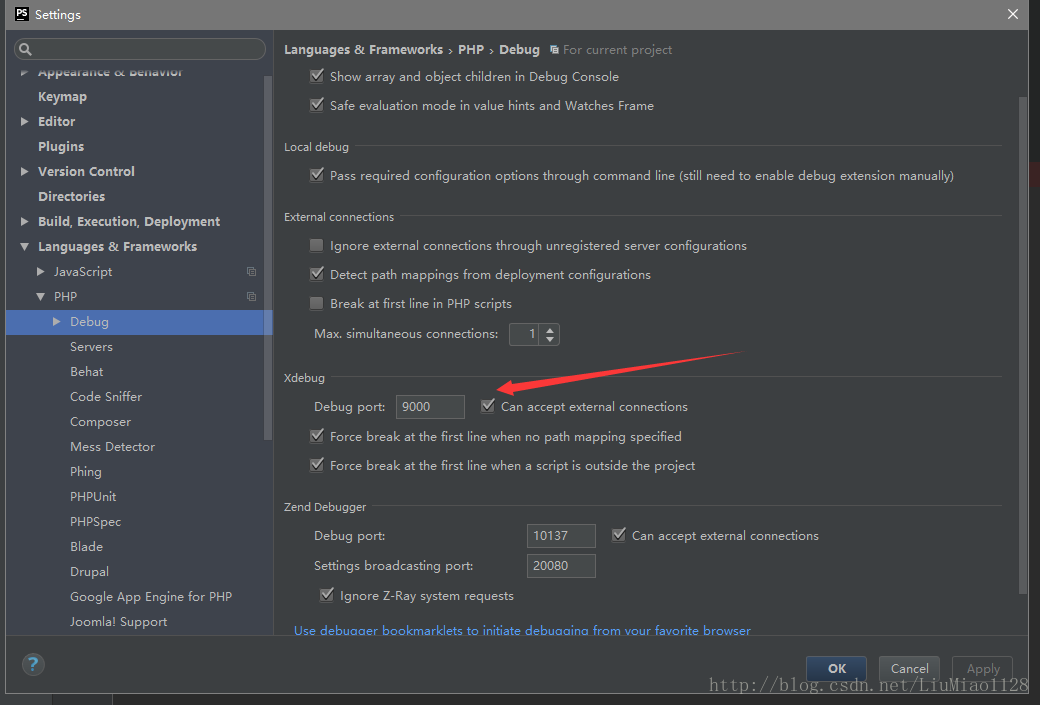
原有的配置文件不变,主要看Debug port 端口号,要与PHPinfo 里的xdebug port端口号一致
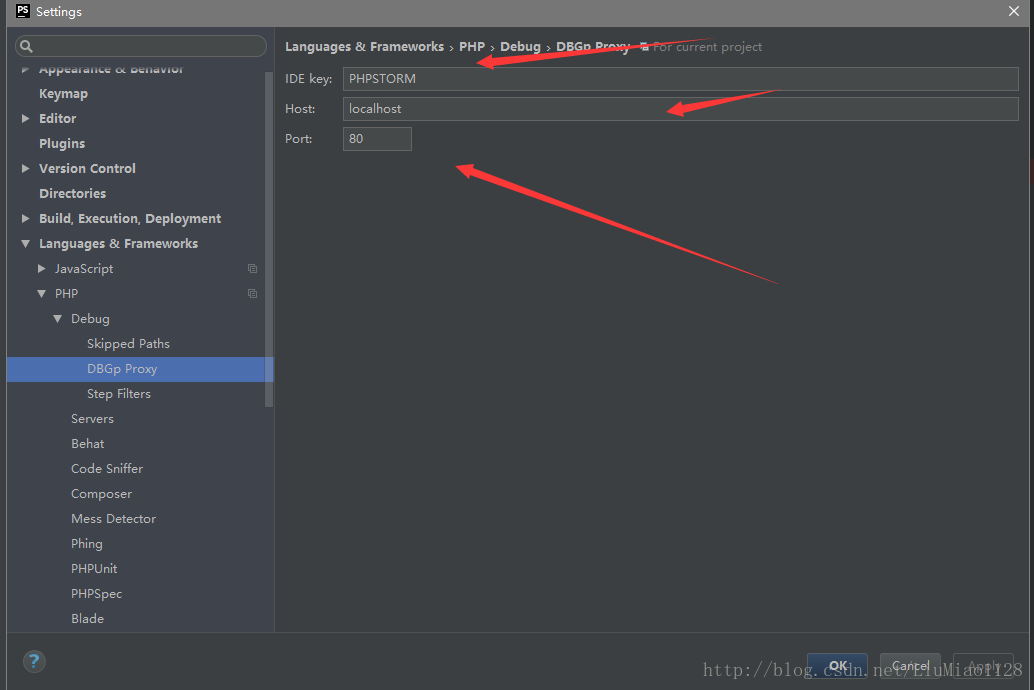
Ied key : 这里要查看phpinfo里的xdebug 的key是什么,要写的一致
host:你的访问域名或者 localhost
port:你项目的端口是多少就写多少
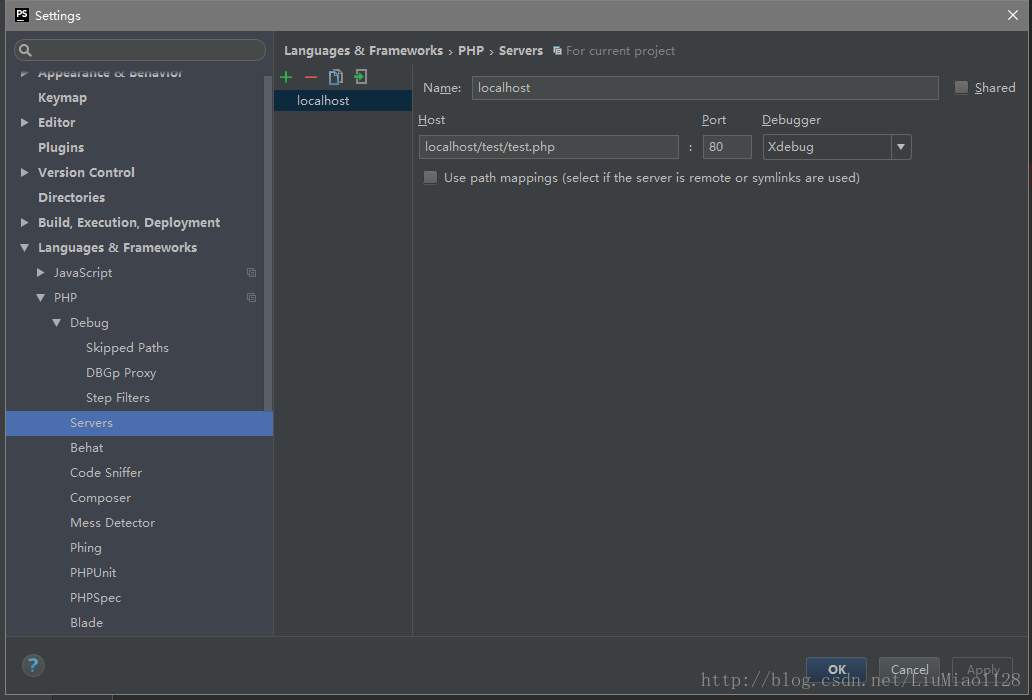
Name:这个写个名字就好
host:我这里写的是项目的访问路径
prot:项目的端口
debugger:选择xdebug
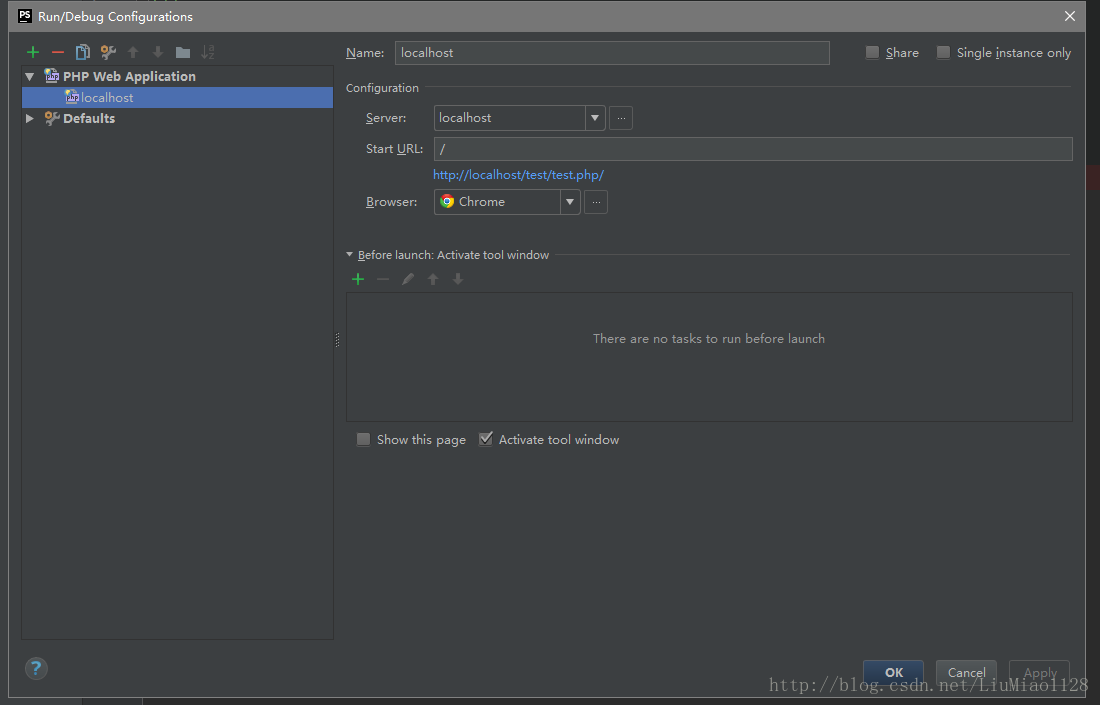
name:随便写个名字
server:选择你刚才创建的那个项目
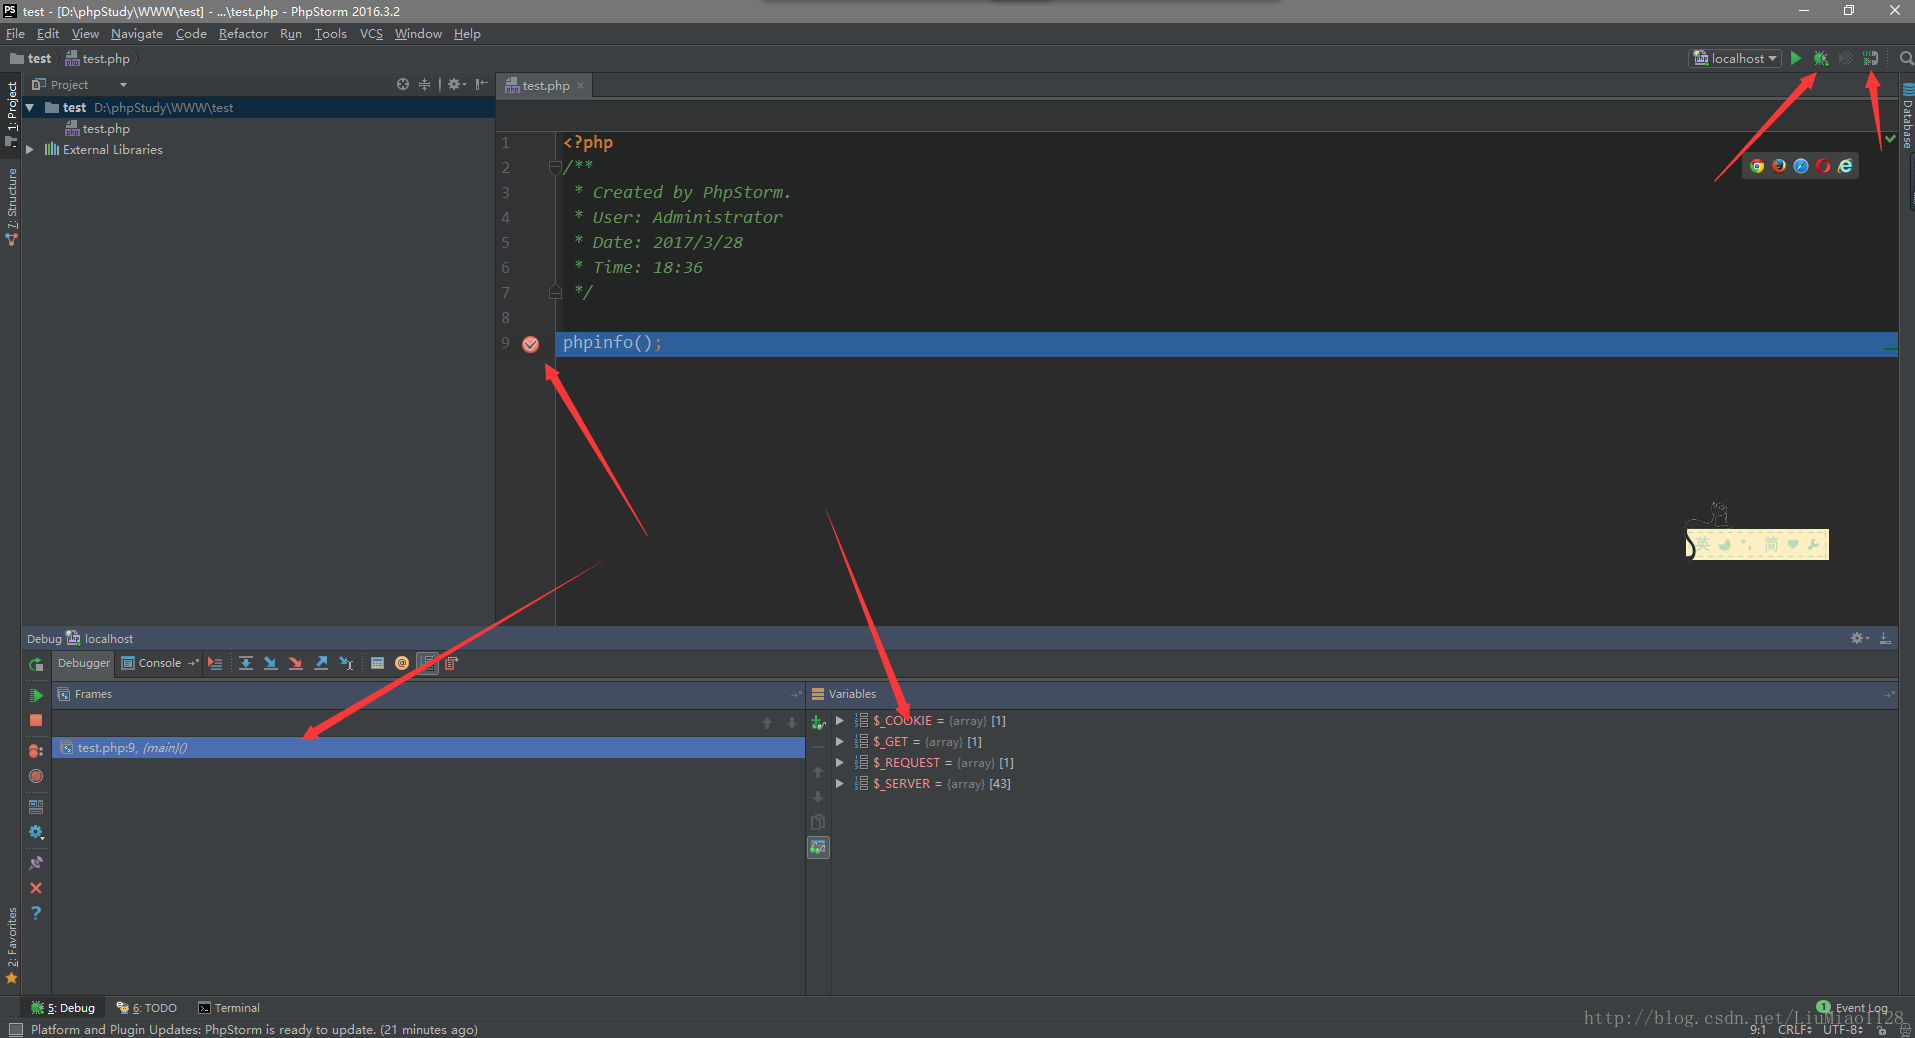
输出这个的调试信息,证明配置成功!祝各位小伙伴配置成功,遇到问题,欢迎留言