**
2020.3.10
内容与格式分离是latex文档本质
**
CteX与LaTeX有什么区别
1、导言区(进行全局设置)+正文区(有且只有一个document环境)
2、解决中文包问题 :用ctex宏包 ,在cmd中使用texdoc ctex可打开帮助文档集。同时保证为utf8编码。
3、可以在导言区使用\newcommand 定义新命令(如果命令比较长)
4、texdoc lshort-zh 打开一份latex排版说明文档。
5、宏包与文档类的关系:LaTeX里面的class指的是document class(文档类),宏包指的是package。一般情况下文档类的文件扩展名是.cls,宏包的扩展名是.sty。一般我们看LaTeX书初学,看到的三大件是article,book和report。不过,这三大类虽然是LaTeX不可动摇之基,但是不支持你敲汉字进去做排版的。以前的CJK做汉化已经不够用了。现在的会见到ctex文档类,含:ctexart
ctexbook
ctexbeamer
ctexrep
这对应着三大件以及beamer的中文化支持。在实现文档类的时候,有些会把一些子功能做成一个简单的package,方便维护。而另一方面,一些文档类因为要做hook,可能要调用一些package。两者的区别,在功能性上是有交集的,但是大方向上的,文档类相当于图书模板,包是功能上的小改。两者都是由LaTeX代码构成的纯文本文件,都能够进行宏的定义并对最终生成的pdf文档产生影响。一般情况下,一些宏定义的集合要被写成文档类还是宏包主要取决于这些宏定义是否依赖于某些具体的文档类。一般用户撰写中文文档时,都会使用ctexart的文档类。但是如果是期刊投稿,对方已经提供了模板文件,那么显然无法再使用这个文档类来获得中文支持,这个时候可以导入宏包ctex来输入中文字符。两种手段都能够获得中文支持,但是一个利用的是文档类,一个利用的是宏包。类与宏包没有太大的区别,一般模板文件都是类,而与具体类不相关的通用型代码都会被写成宏包。


latex字体设置
1、字体属性:字体编码,字体族,字体系列,字体形状、字体大小
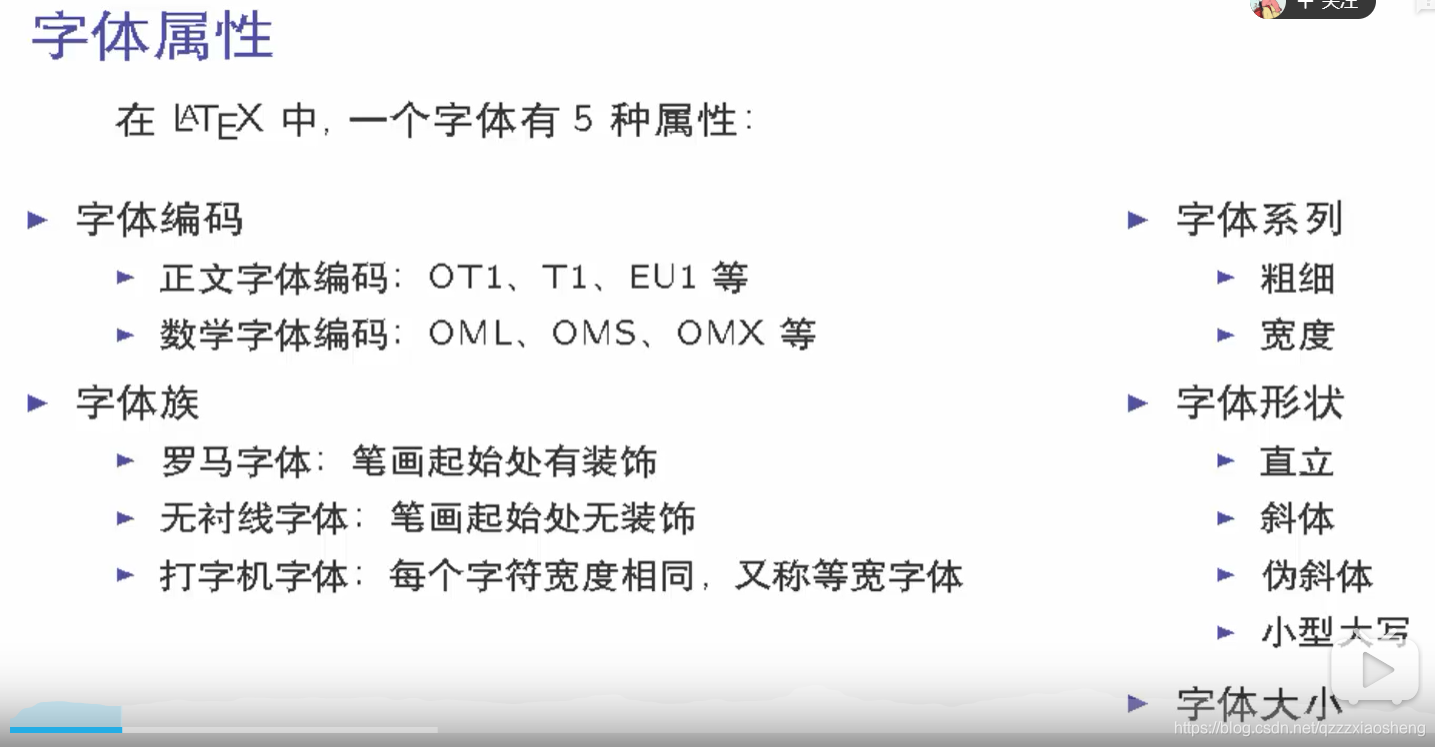
2、字体族:
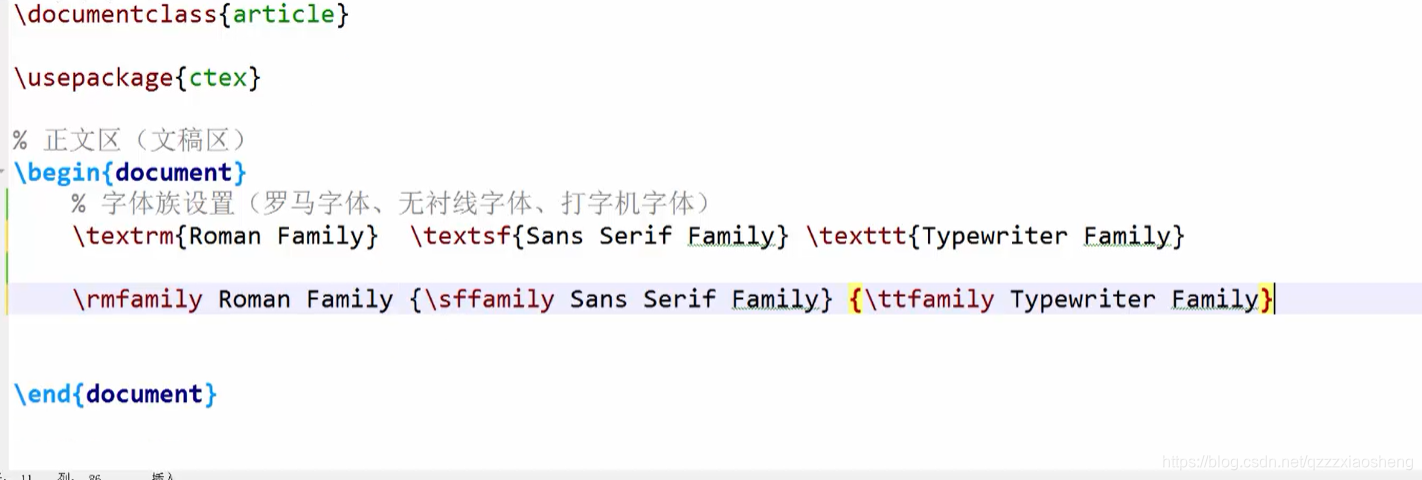
第一行是字体命令,第二行是字体声明,作用于后序的文本。可以使用大括号限定声明的范围,字体声明作用于后序所有的段落,知道遇到下一条字体声明。
3、字体系列设置

上面一般是设置英文字体,下面来讲解中文:
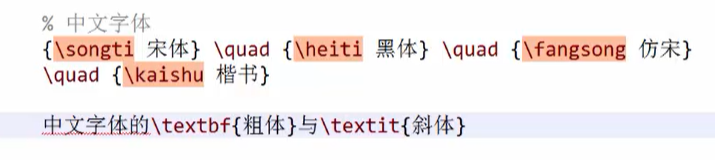
中文粗体用黑体表示,斜体使用楷书来表示。
字体大小的设置:
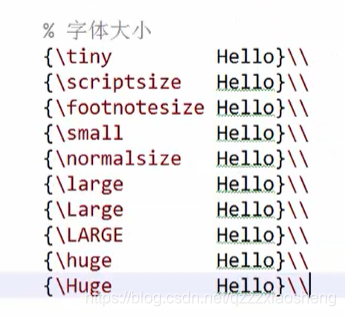
字体大小使用声明来完成,是相对标准值的,在导言区文档类参数设置:\documentclass[10pt]{article} 设置默认为10磅

latex篇章结构

设置标题与子标题与子子标题,哈哈哈;
中文时隔一个空行自动换行,多个空行效果一样。使用“\”可以换行,但是不缩进,使用“\par”命令换行,必须在与文本之中有空格。
在cmd中使用texdoc ctex查看中文文档很重要,可以设置一些格式。
特殊符号的处理


中英混排会自动在中英之间产生空格。

以上为自动控制空格大小的命令,下面为常用的已经自带的:
加\quad 油\qquad 加, 油\thinspace 加\enspace 油\ 加~油

2020.3.15
1、“\textbackslash” 用于生成反斜杠

2、\usepackage{ulem}-------\uline{共产党党员}生成下划线
3、设置标题的格式命令。
2020.3.22
1、不想用默认时间是用\data{}
2、所有标准文档类都提供了一个 \appendix 命令将正文和附录分开2,使用 \appendix 后,最高一级章节改为使用拉丁字母编号,
3、center、flushleft 和 flushright 环境分别用于生成居中、左对齐和右对齐的文本环境。
4、\bfseries命令在问中的实际含义是给字体加黑
2020.3.23
1、使用中文宏包文档类中页面风格是预定义的,但是可能不是我们所需要的。
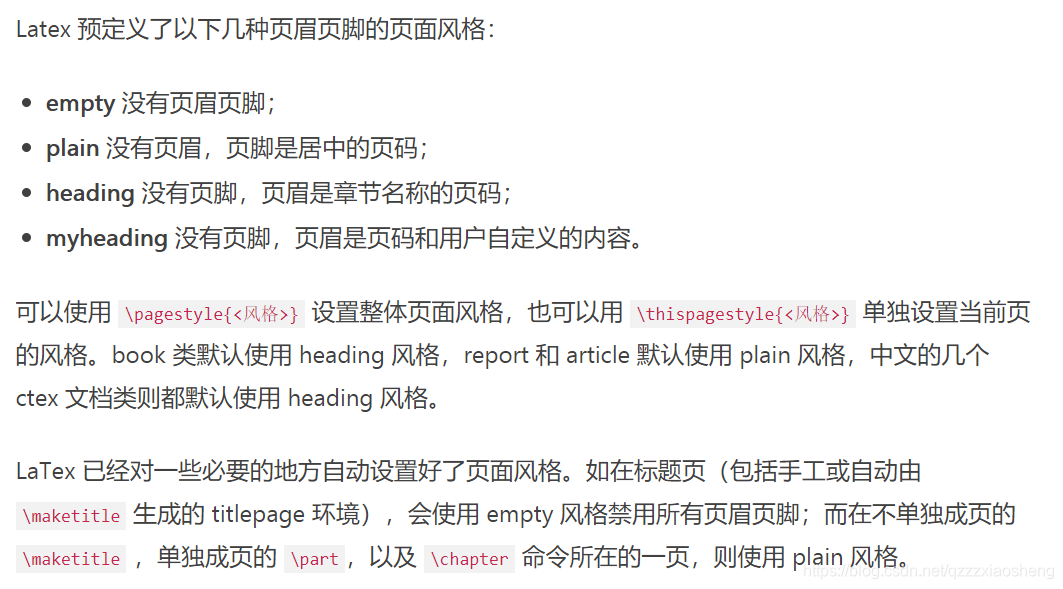

\thispagestyle{empty} %此页不显示页码数
\newpage %换页
多行公式
2020.3.24
花费将近六个小时时间写了第一篇完整的小论文,嘿嘿,作业一大堆没写,典型的有事儿找事儿型。
\documentclass[zihao=5]{

    ctexart}
\title{

    投资收益和风险}
\author{

    }
\date{

    }
\usepackage[left=15mm,right=15mm,top=15mm,bottom=15mm]{

    geometry}
\ctexset{

    section={

    name = {

    ,、},number = \chinese{

    section},aftername={

    }}}
\usepackage{

    enumerate}
\pagestyle{

    plain}  %设置页面风格
\usepackage{

    amsmath}  %数学公式
\usepackage{

    graphicx}  %插入图片
\usepackage{

    float}

\begin{

    document}
	\maketitle

  \begin{

    abstract}
	  本篇小论文主要针对投资的收益和风险问题进行建模和分析,提出此多目标优化问题的解决方案,并用matlab进行试验仿真。\par
	  \bigskip
	  \noindent {

    \bfseries 关键字:多目标优化\quad 单目标优化\quad 线性规划 \quad 非线性规划}
  \end{

    abstract}

   \section{

    问题描述与分析}
      对于此问题的目标是给公司设计一种合理的投资组合方案,给定资金M,有选择的购买若干种资产或存银利息,涉及到两个目标:
   一是使净收益尽可能大,二是使总体风险尽可能小,明显为一个多目标优化问题,因此我们可以将模型适当的简化,将多目标优化问题
   转变为针对投资者不同想法的单目标优化问题来求解。
   \section{

    符号说明}

       \begin{

    itemize}
       	 \item $s_i$\qquad\qquad 第i种投资项目,$i=0,1,\cdots,n$,其中$s_0$指存入银行
       	 \item $r_i$\qquad\qquad $s_i$的平均收益率
       	 \item $p_i$\qquad\qquad $s_i$的交易费率
       	 \item $q_i$\qquad\qquad $s_i$的风险损失率
       	 \item $u_i$\qquad\qquad $s_i$的交易定额
       	 \item $x_i$\qquad\qquad 投资项目$s_i$的资金
       	 \item $a$  \qquad\qquad 投资风险度
       	 \item $Q$  \qquad\qquad 总体收益
       \end{

    itemize}
    \section{

    模型假设}

     \begin{

    enumerate}[(1)]
     \item \quad 投资数额M非常大,为了方便计算,假设M=1
     \item \quad 投资越分散,总的风险越小
     \item \quad 总体风险投资用投资项目中$s_i$中最大的风险来度量
     \item \quad n+1种资产$s_i$之间是相互独立的
     \item \quad 在投资这一时期内,$r_i,p_i,q_i$为定值,不受意外因素的影响
     \item \quad 净收益和总体收益只受$r_i,p_i,q_i$的影响
    \end{

    enumerate}
   \section{

    模型的建立与求解}
      \subsection{

    模型一}
        在此模型中我们采用固定盈利水平,优化收益的方法。在实际投资中承受的风险程度不同,若给定一个风险界限a,使最大的一个风险
    $\frac{

    q_ix_i}{

    M}\le a$,可以找到相应的投资方案。这样就把多目标规划变成单目标线性规划。
         \begin{

    gather*}
         max~\sum_{

    i=0}^{

    n}(r_i-p_i)~x_i \\
         s.~t.~
         \begin{

    cases}
           \frac{

    q_ix_i}{

    M}\le a \\
           \sum_{

    i=0}^{

    n}(1+p_i)x_i=M,\quad x_i\ge 0,i=0,1,\cdots,n
         \end{

    cases}
        \end{

    gather*}
     如图所示为matlab代码仿真结果:\par
     \begin{

    figure}[htb]                               %插入图片
       	\centering
          \includegraphics[scale=0.5]{

    1.png}
     \caption{

    model 1
    	    }            %\label{

    straddltimeScale}
     \end{

    figure}
  \subsection{

    模型二}
   在此模型中我们采取固定盈利水平,极小化风险的方法的建模方法:
           \[ min~\{

    max\{

    q_ix_i\}\}, \]
           \[   s.t.~
             \begin{

    cases}
              \sum_{

    i=0}^{

    n}(r_i-p_i)x_i\ge k \\
            	\sum_{

    i=0}^{

    n}(1+p_i)x_i=M,\quad x_i\ge 0,i=0,1,\cdots,n
            \end{

    cases}   \]
  \par  如图所示为matlab仿真结果: \newpage
        \begin{

    figure}[htb]                               %插入图片
       	\centering
       	\includegraphics[scale=0.5]{

    2.png}
       	\caption{

    model 2
       	}            %\label{

    straddltimeScale}
       \end{

    figure}
   \subsection{

    模型三}
     投资者在权衡资产风险和预期收益两方面时,希望选择一个令自己满意的投资组合。因此对风险和收益分别赋予权重 s 和 1-s,s为投资偏好系数。
     \[min~s~\{

    max\{

    q_ix_i\}\}-(1-s)\sum_{

    i=0}^{

    n}(r_i-p_i)x_i  \] \par
     \[ s.t.~\sum_{

    i=0}^{

    n}(1+p_i)x_i=M,~x_i\ge 0,~i=0,1 2,\cdots,n                    \]
    在matlab中的仿真结果为: \par
       \begin{

    figure}[htb]                               %插入图片
      	\centering
      	\includegraphics[scale=0.4]{

    3.png}
      	\caption{

    model 3
      	}            %\label{

    straddltimeScale}
      \end{

    figure}

   \section{

    模型分析}
   \subsection{

    模型一}
     1、投资的风险越大,对应的收益也越大,投资越分散,风险越小。

     2、在a=0.06左右为一个转折点,在转折点左面投资风险增加,利润增加更快,在转折点右边,利润增加缓慢,故不想冒太大风险的人可以寻找此点作为最佳组合方案。
    \subsection{

    模型二}
     1、横坐标为固定的最小盈利,纵坐标为此时的风险系数,投资越大,风险越大。

     2、如果投资者不想承担更大的风险可以考虑在转折点0.35点的投资方案,这样既可以保证获利最大,又不至于承担过大风险。
     \subsection{

    模型三}
     1、收益随着s的增大而逐渐减小。

     2、可以考虑将拐点0.85最为s选择投资方案,获得比较符合大众的选择。
    \section{

    matlab代码}
   \subsection{

    模型一}
     \begin{

    verbatim}
     clc,clear
     a=0;
     hold on;
     while a<0.2
     c=[-0.05,-0.075,-0.153,-0.434,-0.224,-0.003,-0.106,-0.357,-0.281,-0.309,-0.339,-0.076,
     -0.033,-0.323,-0.049,-0.074];
     A=[zeros(15,1),diag([0.42,0.54,0.6,0.42,0.012,0.39,0.68,0.334,0.533,0.4,0.31,0.055,0.46
     ,0.053,0.23])];
     b=a*ones(15,1);
     Aeq=[1,1.021,1.032,1.06,1.015,1.076,1.034,1.056,1.031,1.027,1.029,1.051,1.057,1.027,1.045,1.076];
     Beq=1;
     LB=zeros(16,1);
     [x,Q]=linprog(c,A,b,Aeq,Beq,LB);
     Q=-Q;
     plot(a,Q,'.k');
     a=a+0.001;
     end
     xlabel=('a'),ylabel=('Q');
     \end{

    verbatim}
   \subsection{

    模型二}
    \begin{

    verbatim}
    k=0.15;
    while k<1
    c=[zeros(1,16),1];
    q=[-0.05,-0.075,-0.153,-0.434,-0.224,-0.003,-0.106,-0.357,-0.281,-0.309,-0.339,
    -0.076,-0.033,-0.323,-0.049,-0.074,0];
    a=[zeros(15,1),diag([0.42,0.54,0.6,0.42,0.012,0.39,0.68,0.334,0.533,0.4,0.31,
    0.055,0.46,0.053,0.23]),ones(15,1)*(-1)];
    a=[a;q];
    b=[zeros(15,1);-k];
    aeq=[1,1.021,1.032,1.06,1.015,1.076,1.034,1.056,1.031,1.027,1.029,1.051,1.057,1.027,1.045,1.076,0];
    beq=[1];
    lb=zeros(17,1);
    [x,Q]=linprog(c,a,b,aeq,beq,lb);
    plot(k,Q,'.r');
    k=k+0.005;
    hold on;
    grid on;
    end
    xlabel('k'),ylabel('Q')
     \end{

    verbatim}
   \subsection{

    模型三}
    \begin{

    verbatim}
     s=0;
    while s<1
    c=[-0.05,-0.075,-0.153,-0.434,-0.224,-0.003,-0.106,-0.357,-0.281,-0.309,-0.339,
    -0.076,-0.033,-0.323,-0.049,-0.074];
    c=[c*(1-s),s];
    a=[zeros(15,1),diag([0.42,0.54,0.6,0.42,0.012,0.39,0.68,0.334,0.533,0.4,0.31,
    0.055,0.46,0.053,0.23]),ones(15,1)*(-1)];
    b=zeros(15,1);
    aeq=[1,1.021,1.032,1.06,1.015,1.076,1.034,1.056,1.031,1.027,1.029,1.051,1.057,1.027,1.045,1.076,0];
    beq=[1];
    lb=zeros(17,1);
    ub=[ ];
    [x,Q]=linprog(c,a,b,aeq,beq,lb,ub);
    Q=-Q;
    plot(s,Q,'.r');
    hold on
    s=s+0.001;
    grid on;
    end
    xlabel('s'),ylabel('Q');

     \end{

    verbatim}
\end{

    document}
再接再厉。
4.10


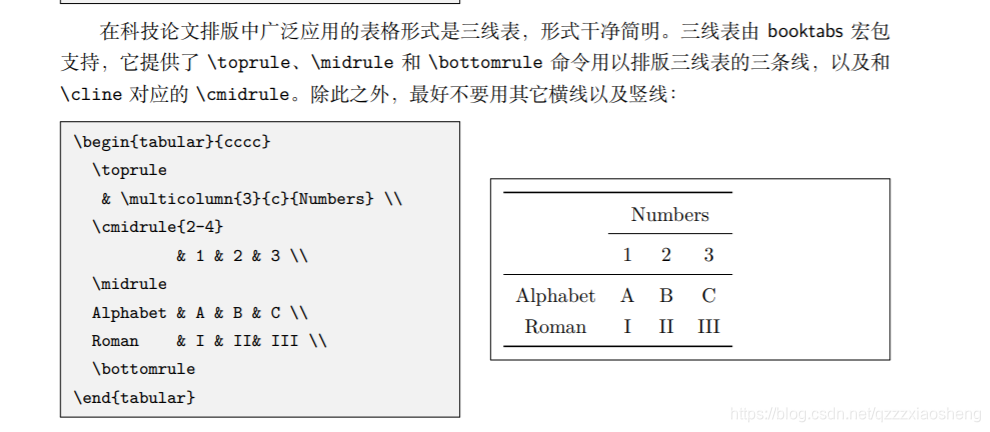
2、表格
引入浮动体的目的是灵活的使用图像和表格。将图片和表格放进相应的浮动体中,就可以使用浮动体中的专有命令进行排版。浮动体


\documentclass[a4paper,12pt]{
ctexart} %A4纸,小四号字体
\usepackage{
times} %使得英文默认字体都是Times New Roman
\usepackage{
abstract}
\renewcommand{
\abstractnamefont}{
\Large\bfseries} %定义摘要的格式
\title{
\heiti 灾情巡视路线建模}
\author{
}
\date{
}
\usepackage[left=15mm,right=15mm,top=15mm,bottom=15mm]{
geometry}
\ctexset{
section={
name = {
,、},number = \chinese{
section},aftername={
}}}
\usepackage{
enumerate}
\pagestyle{
plain} %设置页面风格,为了时自动生成的目录取消
\usepackage{
amsmath} %数学公式
\usepackage{
graphicx} %插入图片
\usepackage{
float} %浮动体中插入当前位置 R参数
\usepackage{
booktabs} %三线表
\usepackage{
multirow} %纵向合并单元格
\usepackage{
diagbox}%表格
%\usepackage{
pifont} % \ding{
172} \ding{
212} 打出来的序号会更漂亮一点
\begin{
document}
\maketitle
\begin{
abstract}
本篇小论文主要针数模选修课对98年数模竞赛中的灾情最优巡视路线问题进行数学建模,将灾情巡视问题转化为图论中的最佳旅行商回路问题进行求解。\par
综合对比网上的将最佳推销员回路问题转化为最佳哈密顿圈以及利用Floyd算法将权矩阵完备化然后利用模拟退火算法两种思路,认为第二种建模方法更加的可行与
科学。\par
针对问题一先随机初始化一个最短路权矩阵,然后利用Floyd算法将权矩阵完备化,将图中的六条主干路依据均衡性尽可能好分为三组,利用模拟退火算法求出最短路径\par
针对问题二,首先将第一问中的权矩阵处理得到最少花费时间矩阵,由题目
要求建立不等式,求解出需将公路分为四组.故在第一问的分类方法中增加时间考量,将公路分为四组.再用模拟退火算法求出各组最少花费时间路径,得到此
得到近似最优巡视路线。\par
\bigskip
\noindent {
\bfseries 关键字:\quad Floyd\quad 最佳旅行商问题\quad 模拟退火算法 \quad 均衡度}
\end{
abstract}
\section{
问题描述与分析}
本题给出了某县的公路网络图,要求的是求出在不同的条件下,灾情巡视的最分组方案和路线,将每个乡(镇)或村看作一个图的顶点,各乡镇、
村之间的公路看作此图对应顶点间的边,各条公路的长度(或行驶时间)看作对应边上的权,所给公路网就转化为加权网络图,而题目的前两问都可以
转化为多旅行商售货员问题,求分组巡视的最佳路线的本质就是求m条经过同一点(县政府)并覆盖所有其他的顶点使边权之和达到最小的闭环。\par
因为旅行商售货员问题属于NP完全问题,没有多项式时间算法,所以本篇小论文采用模拟退火这种近似算法求出问题的最优近似解。
\section{
符号说明}
\begin{
table}[htbp]
\begin{
center}
%产生一个表格,内容可以在&两边改,想要加行,可以仿照如下格式
% 内容 & 内容 \\
% \hline
\begin{
tabular}{
p{
2.5cm}<{
\centering} | p{
13.5cm}<{
\centering} }
\hline
$w_{
ij}$ & 公路图的权矩阵 \\
\hline
$x_{
ij}$ & 公路图的邻接矩阵 \\
\hline
$m_k$ & 第k组巡视乡镇个数 \\
\hline
$n_k$ & 第k组巡视农村个数 \\
\hline
$C_k$ & 第k组路径长度 \\
\hline
\end{
tabular}
\end{
center}
\end{
table}
\section{
模型假设}
\begin{
enumerate}[(1)]
\item \quad 假设图上标注的公路均未受水灾影响,仍可正常通过行,不影响巡查路线。
\item \quad 假设在各乡(镇)、村均能准时到达、准时离开。
\item \quad 假设各巡视内成员巡视行动一致,各成员巡视进度统一
\item \quad 假设汽车行驶速度不受外界因素影响,始终保持 35km/h 匀速行驶。
\item \quad 不考虑其他非正常情况
\end{
enumerate}
\section {
模型建立与求解}
\subsection{
问题一}
问题一要求划分三组路径,使得每组路径构成一个闭环,所有路径加起来可以覆盖图中的每一个点,并且使得权重之和最小,路线尽可能均衡。为简化模型设计,我们
暂且不考虑路线的均衡度。首先我们将图中的所有节点和权重进行输入,初始化一个最短路权矩阵,然后利用Floyd算法将任意两点间的最短路权矩阵求出,这样我们
就可以求出O点到图中所有其它顶点的最短路径。并将路线矩阵中没有标注的路去除,以达到简化网络图的作用。对简化的网络图分成6条干支,并进行标注如下图所示:
\begin{
figure}[H] %htb %插入图片
\centering
\includegraphics[scale=0.7]{
1.png}
\caption{
主干图
} %\label{
straddltimeScale}
\end{
figure}
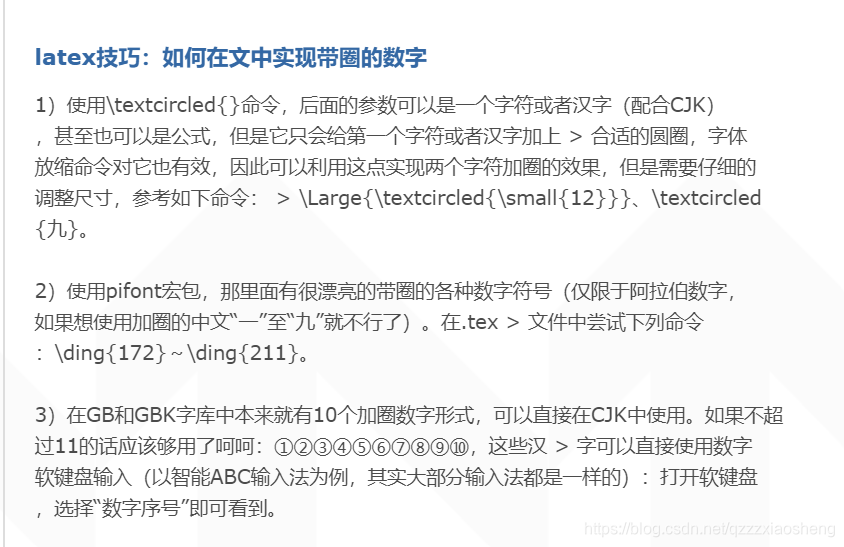
% \Large{
\textcircled{
\small{
12}}}
为使路线尽可能均衡,我们选择分组形式为:
\begin{
center}
(\textcircled{
\small 1},\textcircled{
\small 2}),(\textcircled{
\small 3},\textcircled{
\small 4}),(\textcircled{
\small 5},\textcircled{
\small 6})
\end{
center}
由此我们就成功的将多旅行商问题转化成为了单旅行商问题,建立的数学模型如下:
\begin{
gather*}
min~~C_k=\sum_{
i=1}^{
n}\sum_{
j=1}^{
n}x_{
ij}w_{
ij} \\
s.~t.~
\begin{
cases}
\displaystyle\sum_{
i=1}^{
n} x_{
ij}=1\\
\displaystyle\sum_{
j=1}^{
n} x_{
ij}=1\\
x_{
ij}=0,1
\end{
cases}
\end{
gather*}
\par 利用模拟退火算法最后得到的结果如下:
\begin{
table}[H]
\centering
\begin{
tabular}{
|c|c|c|}
\hline
小组名称 & 分组路线长度 & 总路线长度 \\
\hline
第一组 & 228.8 & \multirow{
3}{
*}{
511.25} \\ %列合并
\cline{
1-2}
第二组 & 183.2 & \\
\cline{
1-2}
第三组 & 99.25 & \\
\hline
\end{
tabular}
\end{
table}
\subsection{
问题二}
问题二是在问题一的基础上加了时间考量.故首先由时间限制对图二进行分组,这就将问题二转化成了问题一的单旅行商问题。计算得总共应该分为4组,得到的四组为 :
\begin{
center}
(\textcircled{
\small 6},\textcircled{
\small 1}),(\textcircled{
\small 2}),(\textcircled{
\small 3}),(\textcircled{
\small 5},\textcircled{
\small 4})}
\end{
center}
这样我们就将多旅行商问题转化成为了单旅行商问题,建立如下的数学模型:
\begin{
gather*}
min~~\sum_{
k=1}^{
4} \\
s.~t.~
\begin{
cases}
\displaystyle\sum_{
i=1}^{
n} x_{
ij}=1\\
\displaystyle\sum_{
j=1}^{
n} x_{
ij}=1\\
x_{
ij}=0,1
\end{
cases}
\end{
gather*}
其中$h_k=2*m_k+1*n_k+frac{
C_k}{
V} $
\section{
模型分析}
在模型一中我们成功的解决了分组问题,简化了数学模型,将路线分为三组,将多旅行商售货员问题转化为了单旅行商售货员问题,并且使用模拟退火算法
有效的解决了此NP完全问题,得到了近似解。
模型二同样与第一问的思路相同,将路线分为四组,加入了时间因素,利用模拟退火算法得到了近似解。
模型的建立存在一定的缺点为人为主观进行了分组,所以均衡度的科学性有待提高。
\section{
matab代码}
\begin{
verbatim}
function Floyd(w,router_direction,MAX)
len=length(w);
flag=zeros(1,len);
R=zeros(len,len);
for i=1:len
if router_direction==0
R(:,i)=ones(len,1)*i;
else
R(i,:)=ones(len,1)*i;
end
R(i,i)=0;
end
disp('');
14
disp('w(0)');
dispit(w,0);
disp('R(0)');
dispit(R,1);
for i=1:len
tmp=w(i,i)/2;
if tmp~=0
w(i,:)=w(i,:)+tmp;
w(:,i)=w(:,i)+tmp;
flag(i)=1;
w(i,i)=0;
end
end
for i=1:len
for j=1:len
if j==i || w(j,i)==MAX
continue;
end
for k=1:len
if k==i || w(j,i)==MAX
continue;
end
if w(j,i)+w(i,k)<w(j,k)
w(j,k)=w(j,i)+w(i,k);
if router_direction==0
R(j,k)=R(j,i);
else
R(j,k)=R(i,k);
end
end
end
end
disp(['w(',num2str(i),')'])
dispit(w,0);
disp(['R(',num2str(i),')'])
dispit(R,1);
end
[Center,index]=min(max(w'));
disp(['a',num2str(index)]);
[Middle,index]=min(sum(w'));
15
disp(['a',num2str(index)]);
end
function dispit(x,flag)
len=length(x);
s=[];
for j=1:len
if flag==0
s=[s sprintf('%5.2f\t',x(j,:))];
else
s=[s sprintf('%d\t',x(j,:))];
end
s=[s sprintf('\n')];
end
disp(s);
disp('---------------------------------------------------');
end
\end{
verbatim}
\begin{
verbatim}
function [f,T]=TSPSA(d,t0,tf)
[m,n]=size(d);
d=d/2;
L=100*n;
t=t0;
pi0=1:n;
min_f=0;
for k=1:n-1
min_f=min_f+d(pi0(k),pi0(k+1));
end
min_f=min_f+d(pi0(n),pi0(1));
p_min=pi0;
while t>tf
for k=1:L;
kk=rand;
[d_f,pi_1]=exchange_2(pi0,d);
r_r=rand;
if d_f<0
pi0=pi_1;
elseif exp(d_f/t)>r_r
16
pi0=pi_1;
else
pi0=pi0;
end
end
f_temp=0;
for k=1:n-1
f_temp=f_temp+d(pi0(k),pi0(k+1));
end
f_temp=f_temp+d(pi0(n),pi0(1));
if min_f>f_temp
min_f=f_temp;
p_min=pi0;
end
t=0.87*t;
end
f=min_f;
T=p_min;
function [d_f,pi_r]=exchange_2(pi0,d)
[m,n]=size(d);
clear m;
u=rand;
u=u*(n-2);
u=round(u);
if u<2
u=2;
end
if u>n-2
u=n-2;
end
v=rand;
v=v*(n-u+1);
v=round(v);
if v<1
v=1;
end
v=u+v;
if v>n
v=n;
end
pi_1(u)=pi0(v);
pi_1(v)=pi0(u);
if u>1
17
for k=1:u-1
pi_1(k)=pi0(k);
end
end
if v>(u+1)
for k=1:v-u-1
pi_1(u+k)=pi0(v-k);
end
end
if v<n
for k=(v+1):n
pi_1(k)=pi0(k);
end
end
d_f=0;
if v<n
d_f=d(pi0(u-1),pi0(v))+d(pi0(u),pi0(v+1));
for k=(u+1):n
d_f=d_f+d(pi0(k),pi0(k-1));
end
d_f=d_f-d(pi0(u-1),pi0(u))-d(pi0(v),pi0(v+1));
for k=(u+1):n
d_f=d_f-d(pi0(k-1),pi0(k));
end
else
d_f=d(pi0(u-1),pi0(v))+d(pi0(u),pi0(1))-d(pi0(u-1),pi0(u))-
d(pi0(v),pi0(1));
for k=(u+1):n
d_f=d_f+d(pi0(k),pi0(k-1));
end
for k=(u+1):n
d_f=d_f-d(pi0(k-1),pi0(k));
end
end
pi_r=pi_1;
\end{
verbatim}
\end{
document}
4.19
1、接近五一校赛,版面设置,论文套路,真头大,作业一箩筐没写。
\documentclass[a4paper,12pt]{

    ctexart} %A4纸,小四号字体
\usepackage{

    times} %使得英文默认字体都是Times New Roman
\usepackage{

    abstract}
\renewcommand{

    \abstractnamefont}{

    \Large\bfseries}  %定义摘要的格式
\title{

    \heiti \zihao{

    0} 灾情巡视路线建模}
\author{

    }
\date{

    }
\usepackage[left=15mm,right=15mm,top=15mm,bottom=15mm]{

    geometry}
\ctexset{

    section={

    name = {

    ,、},number = \chinese{

    section},aftername={

    }}}
\usepackage{

    enumerate}
\pagestyle{

    plain}  %设置页面风格,为了时自动生成的目录取消
\usepackage{

    amsmath}  %数学公式
\usepackage{

    graphicx}  %插入图片
\usepackage{

    float}    %浮动体中插入当前位置 R参数
\usepackage{

    booktabs}  %三线表
\usepackage{

    multirow}  %纵向合并单元格
\usepackage{

    diagbox}%表格
\usepackage{

    listings}
%\lstset{

    language=Matlab}
%\usepackage{

    pifont}     % \ding{

    172}    \ding{

    212}  打出来的序号会更漂亮一点
\usepackage[usenames,dvipsnames]{

    color}

\definecolor{

    DarkGreen}{

    rgb}{

    0.0,0.4,0.0}

\lstloadlanguages{

    Matlab}
\lstset{

    language=Matlab,
	frame=single,                           % single framed
	basicstyle=\small\ttfamily,
	keywordstyle=[1]\color{

    Blue}\bfseries,  % primitive funs in bold blue
	keywordstyle=[2]\color{

    Purple},         % args of funs in purple
	keywordstyle=[3]\color{

    Blue}\underbar,  % user funs in blue with underbar
	stringstyle=\color{

    Purple},             % strings in purple
	showstringspaces=false,
	identifierstyle=,
	commentstyle=\usefont{

    T1}{

    pcr}{

    m}{

    sl}\color{

    DarkGreen}\small,
	tabsize=4,
	% more standard MATLAB funcs
	morekeywords={

    sawtooth, square},
	% args of funcs
	morekeywords=[2]{

    on, off, interp},
	% user funcs
	morekeywords=[3]{

    FindESS, homework_example},
	morecomment=[l][\color{

    Blue}]{

    ...},     % line continuation (...) like blue comment
	numbers=left,
	numberstyle=\tiny\color{

    Blue},
	firstnumber=1,
	stepnumber=1
}
\documentclass[a4paper,12pt]{
ctexart} %A4纸,小四号字体
\usepackage{
times} %使得英文默认字体都是Times New Roman
\usepackage{
abstract}
\renewcommand{
\abstractnamefont}{
\Large\bfseries} %定义摘要的格式
\title{
\heiti 测试}
\author{
}
\date{
}
\usepackage[left=15mm,right=15mm,top=15mm,bottom=15mm]{
geometry}
\ctexset{
section={
name = {
,、},number = \chinese{
section},aftername={
}}}
\usepackage{
enumerate}
\pagestyle{
plain} %设置页面风格,为了时自动生成的目录取消
\usepackage{
amsmath} %数学公式
\usepackage{
graphicx} %插入图片
\usepackage{
float} %浮动体中插入当前位置 H 参数
\usepackage{
booktabs} %三线表
\usepackage{
multirow} %纵向合并单元格
\usepackage{
diagbox}%表格
%\usepackage{
pifont} % \ding{
172} \ding{
212} 打出来的序号会更漂亮一点
%\usepackage[table,xcdraw]{
xcolor}
%\usepackage{
longtable}%跨行表格
\usepackage[final]{
pdfpages}%插入pdf封面
\begin{
document}
\includepdf{
a.pdf}
\thispagestyle{
empty}
\newpage
\maketitle
\setcounter{
page}{
1}
\[ \begin{
bmatrix} %数学公式中的矩阵环境 \dots \vdots \ddots []方括号
x_{
11} & x_{
12} & \ldots & x_{
1n}\\
x_{
21} & x_{
22} & \ldots & x_{
2n}\\
\vdots & \vdots & \ddots & \vdots\\
x_{
n1} & x_{
n2} & \ldots & x_{
nn}\\
\end{
bmatrix}
\mathbf{
X} = \left(
\begin{
array}{
cccc} %只能是单行公式,一个矩阵是一个整体
x_{
11} & x_{
12} & \ldots & x_{
1n}\\
x_{
21} & x_{
22} & \ldots & x_{
2n}\\
\vdots & \vdots & \ddots & \vdots\\
x_{
n1} & x_{
n2} & \ldots & x_{
nn}\\
\end{
array} \right)
\]
$\mu, M \qquad
\mathbf{
\mu}, \mathbf{
M}$
\qquad {
\boldmath$\mu, M$} %可以使所有变成粗斜体,只能在公式外用
{
\boldmath$Z^+=(Z_1^+ + Z_2^+)$}
\begin{
table}[htp] %h:放在此处;t:放在顶端;;b:放在底端;p:在本页;如果是[htbp],意思就是优先放在此处,其次是每页的顶端,再次是底端
\caption{
vdgddfdfbc}
\resizebox{
\textwidth}{
!}{
\begin{
tabular}{
|c|c|c|c|c|c|c|c|c|c|c|c|c|} %longtable解决跨行
\hline
& \textbf{
\begin{
tabular}[c]{
@{
}c@{
}}人均国内\\ 生产总值(元)\end{
tabular}} & \textbf{
\begin{
tabular}[c]{
@{
}c@{
}}全社会消费品\\ 零售总额(亿元)\end{
tabular}} & \textbf{
\begin{
tabular}[c]{
@{
}c@{
}}全社会固定资产\\ 投资总额(亿元)\end{
tabular}} & \textbf{
\begin{
tabular}[c]{
@{
}c@{
}}运营公交\\ 车辆数(辆)\end{
tabular}} & \textbf{
\begin{
tabular}[c]{
@{
}c@{
}}公交营运\\ 总数(亿人次)\end{
tabular}} & \textbf{
\begin{
tabular}[c]{
@{
}c@{
}}城市交通干线\\ 噪音均值(分贝)\end{
tabular}} & \textbf{
\begin{
tabular}[c]{
@{
}c@{
}}公交车营运\\ 总里程(万公里)\end{
tabular}} & \textbf{
\begin{
tabular}[c]{
@{
}c@{
}}道路总\\ 长(公里)\end{
tabular}} & \textbf{
\begin{
tabular}[c]{
@{
}c@{
}}居民人均\\ 可支配收入(元)\end{
tabular}} & \textbf{
\begin{
tabular}[c]{
@{
}c@{
}}居民储蓄\\ 款余额(亿元)\end{
tabular}} & \textbf{
\begin{
tabular}[c]{
@{
}c@{
}}汽油(93号)\\ 年均价 (元/升)\end{
tabular}} & \textbf{
\begin{
tabular}[c]{
@{
}c@{
}}私人汽车\\ 拥有量(万辆)\end{
tabular}} \\ \hline
\textbf{
平均} & 48538.92 & 932.07 & 809.12 & 6397.25 & 10.30 & 86.34 & 33838.83 & 2368.58 & 23823.25 & 1908.29 & 7.76 & 52.98 \\ \hline
\textbf{
标准误差} & 4888.81 & 157.84 & 101.98 & 2376.97 & 1.22 & 17.26 & 5649.73 & 825.59 & 1304.63 & 342.48 & 1.88 & 33.49 \\ \hline
\textbf{
中位数} & 44687.00 & 886.99 & 737.26 & 3495.00 & 9.22 & 69.20 & 24639.50 & 1535.50 & 24242.50 & 1564.95 & 5.86 & 11.05 \\ \hline
\textbf{
标准差} & 16935.35 & 546.76 & 353.27 & 8234.07 & 4.22 & 59.79 & 19571.24 & 2859.92 & 4519.36 & 1186.38 & 6.52 & 116.02 \\ \hline
\textbf{
方差} & 286806034.27 & 298943.70 & 124797.96 & 67799859.11 & 17.79 & 3575.17 & 383033406.52 & 8179145.90 & 20424632.75 & 1407504.76 & 42.56 & 13461.51 \\ \hline
\textbf{
峰度} & -0.92 & -1.02 & -1.44 & 10.94 & -0.09 & 12.00 & -0.51 & 10.29 & -1.18 & -1.24 & 11.73 & 10.79 \\ \hline
\textbf{
偏度} & 0.49 & 0.48 & 0.21 & 3.26 & 1.06 & 3.46 & 0.96 & 3.12 & -0.13 & 0.57 & 3.41 & 3.24 \\ \hline
\textbf{
区域} & 52221.00 & 1607.68 & 1017.47 & 29433.00 & 12.87 & 208.00 & 54398.00 & 10454.00 & 13747.00 & 3208.71 & 23.42 & 411.00 \\ \hline
\textbf{
最小值} & 27000.00 & 297.35 & 327.53 & 2658.00 & 5.73 & 68.20 & 15948.00 & 737.00 & 16316.00 & 583.89 & 4.96 & 3.10 \\ \hline
\textbf{
最大值} & 79221.00 & 1905.03 & 1345.00 & 32091.00 & 18.60 & 276.20 & 70346.00 & 11191.00 & 30063.00 & 3792.60 & 28.38 & 414.10 \\ \hline
\textbf{
求和} & 582467.00 & 11184.83 & 9709.49 & 76767.00 & 123.63 & 1036.10 & 406066.00 & 28423.00 & 285879.00 & 22899.53 & 93.06 & 635.80 \\ \hline
\textbf{
观测数} & 12.00 & 12.00 & 12.00 & 12.00 & 12.00 & 12.00 & 12.00 & 12.00 & 12.00 & 12.00 & 12.00 & 12.00 \\ \hline
\textbf{
最大(1)} & 79221.00 & 1905.03 & 1345.00 & 32091.00 & 18.60 & 276.20 & 70346.00 & 11191.00 & 30063.00 & 3792.60 & 28.38 & 414.10 \\ \hline
\textbf{
最小(1)} & 27000.00 & 297.35 & 327.53 & 2658.00 & 5.73 & 68.20 & 15948.00 & 737.00 & 16316.00 & 583.89 & 4.96 & 3.10 \\ \hline
\textbf{
置信度(95.0\%)} & 10760.21 & 347.39 & 224.46 & 5231.68 & 2.68 & 37.99 & 12434.97 & 1817.11 & 2871.47 & 753.79 & 4.15 & 73.72 \\ \hline
\end{
tabular}
}
\end{
table}
\end{
document}

新使用了一个宏包,排版代码舒服多了。中文也可以正常显示。希望这黑色四月份赶快过去。困。。。。。。。。!
%一级标题用四号黑体字,并居中;二级、三级标题用小四号黑体字,左端对齐(不居中)
\documentclass[a4paper,12pt]{

    ctexart} %A4纸,小四号字体
\usepackage{

    times} %使得英文默认字体都是Times New Roman
%\usepackage{

    abstract}
%\renewcommand{

    \abstractnamefont}{

    \Large\bfseries}  %定义摘要的格式
\title{

    }
\author{

    }
\date{

    }
\usepackage[left=25mm,right=25mm,top=25mm,bottom=25mm]{

    geometry}  % 页边距
\ctexset{

    section={

    name = {

    ,、},number = \chinese{

    section},aftername={

    },format =\zihao{

    4}  \bfseries \centering}} % 一级标题
\ctexset{

    subsection={

    format =\zihao{

    -4}  \bfseries }}                                                            %  二级标题
\ctexset{

    subsubsection={

    format =\zihao{

    -4}  \bfseries}}                                                          %  三级标题
\usepackage{

    enumerate}
\pagestyle{

    plain}  %设置页面风格,为了时自动生成的目录取消
\usepackage{

    amsmath}  %数学公式
\usepackage{

    graphicx}  %插入图片
\usepackage{

    float}    %浮动体中插入当前位置 R参数
\usepackage{

    booktabs}  %三线表
\usepackage{

    multirow}  %纵向合并单元格
\usepackage{

    diagbox}%表格
\usepackage{

    listings} %用于matlab代码排版
%\usepackage{

    pifont}     % \ding{

    172}    \ding{

    212}  打出来的序号会更漂亮一点
\usepackage[usenames,dvipsnames]{

    color}
\definecolor{

    DarkGreen}{

    rgb}{

    0.0,0.4,0.0}
\lstloadlanguages{

    Matlab}
\lstset{

    language=Matlab,
	frame=single,                           % single framed
	basicstyle=\small\ttfamily,
	keywordstyle=[1]\color{

    Blue}\bfseries,  % primitive funs in bold blue
	keywordstyle=[2]\color{

    Purple},         % args of funs in purple
	keywordstyle=[3]\color{

    Blue}\underbar,  % user funs in blue with underbar
	stringstyle=\color{

    Purple},             % strings in purple
	showstringspaces=false,
	identifierstyle=,
	commentstyle=\usefont{

    T1}{

    pcr}{

    m}{

    sl}\color{

    DarkGreen}\small,
	tabsize=4,
	% more standard MATLAB funcs
	morekeywords={

    sawtooth, square},
	% args of funcs
	morekeywords=[2]{

    on, off, interp},
	% user funcs
	morekeywords=[3]{

    FindESS, homework_example},
	morecomment=[l][\color{

    Blue}]{

    ...},     % line continuation (...) like blue comment
	numbers=left,
	numberstyle=\tiny\color{

    Blue},
	firstnumber=1,
	stepnumber=1
}
%\usepackage[final]{

    pdfpages}%插入pdf封面
\begin{

    document}

	 \begin{

    center}
		\zihao{

    3}  \heiti  灾情巡视路线建模   %3号黑体居中
	\end{

    center}

   \begin{

    center}
   	 \zihao{

    4} \heiti 摘要
   \end{

    center}
   \zihao{

    -4}  %正文小4号宋体
   \songti   %正文宋体
    \par


	  \bigskip
	  \noindent {

    {

    \heiti 关键字:}\quad Floyd\quad 最佳旅行商问题\quad 模拟退火算法 \quad 均衡度}


   \section{

    问题重述}


   \section{

    问题分析}

     \section{

    模型假设}

   \begin{

    enumerate}[(1)]
   	\item \quad 假设图上标注的公路均未受水灾影响,仍可正常通过行,不影响巡查路线。
   	\item \quad 假设在各乡(镇)、村均能准时到达、准时离开。
   	\item \quad 假设各巡视内成员巡视行动一致,各成员巡视进度统一
   	\item \quad 假设汽车行驶速度不受外界因素影响,始终保持 35km/h 匀速行驶。
   	\item \quad 不考虑其他非正常情况

   \end{

    enumerate}

   \section{

    符号说明}

     \begin{

    table}[htbp]
     	\begin{

    center}

     		%产生一个表格,内容可以在&两边改,想要加行,可以仿照如下格式
     		%  内容 & 内容  \\
     		% \hline
     		\begin{

    tabular}{

      p{

    2.5cm}<{

    \centering} | p{

    13.5cm}<{

    \centering} }
     			\hline
     			$w_{

    ij}$  & 公路图的权矩阵  \\
     			\hline
     			$x_{

    ij}$ & 公路图的邻接矩阵   \\
     			\hline
     			$m_k$ & 第k组巡视乡镇个数   \\
     			\hline
     			$n_k$ & 第k组巡视农村个数   \\
     			\hline
     		   $C_k$ & 第k组路径长度   \\
     			\hline
     		\end{

    tabular}
     	\end{

    center}
     \end{

    table}


    \section {

    模型的建立与求解}


    \section {

    模型的评价与优化}

    \section {

    参考文献}

     \section {

    附录}


%    \section{

    matab代码}
%    \begin{

    lstlisting}
%
%    \end{

    lstlisting}
%
%    \begin{

    lstlisting}
%
%    \end{

    lstlisting}

\end{

    document}
按照校赛格式调版,封面用word转为了pdf直接插入
2020.7.13
比赛中插入pdf有问题,现已经改正,重新找到一种调整文档标题样式的方法。
\documentclass[a4paper,12pt]{

    ctexart} %A4纸,小四号字体
\usepackage{

    times} %使得英文默认字体都是Times New Roman
\title{

    }
\author{

    }
\date{

    }
\usepackage[left=25mm,right=25mm,top=25mm,bottom=25mm]{

    geometry}  % 页边距
\ctexset{

    section={

    name = {

    ,、},number = \chinese{

    section},aftername={

    },format =\zihao{

    4}  \bfseries \centering}} % 一级标题
\ctexset{

    subsection={

    format =\zihao{

    -4}  \bfseries }}                                                            %  二级标题
\ctexset{

    subsubsection={

    format =\zihao{

    -4}  \bfseries}}     %  三级标题
%\renewcommand{

    \thesection}{

    实验\chinese{

    section}}
\usepackage{

    enumerate}
\pagestyle{

    plain}  %设置页面风格,为了时自动生成的目录取消
\usepackage{

    amsmath}  %数学公式
\usepackage{

    graphicx}  %插入图片
\usepackage{

    float}    %浮动体中插入当前位置 R参数
\usepackage{

    booktabs}  %三线表
\usepackage{

    multirow}  %纵向合并单元格
\usepackage{

    diagbox}%表格
\usepackage{

    longtable}%跨行表格
\usepackage{

    listings} %用于matlab代码排版
\usepackage{

    bm}     %排版数学公式粗体
\usepackage{

    booktabs}
\usepackage{

    threeparttable}
\usepackage[table,xcdraw]{

    xcolor}   %表格用到了上色
\usepackage{

    subfigure}  %并排放图
%\usepackage{

    zhnumber} % change section number to chinese
%\renewcommand\thesection{

    \zhnum{

    section}}
%\usepackage{

    titlesec}   %改变标题样式红包,和  \titleformat  配套
%\titleformat{

    \section}{

    \centering\Huge\bfseries}{

    第\,\thesection\,章}{

    1em}{

    }
%\titleformat{

    \section}{

    \zihao{

    4}\heiti\centering}{

    \zhnum{

    section} \,、}{

    0em}{

    }
%\usepackage{

    pdfpages}   用来插入pdf
\begin{

    document}
%\includepdf[pages={

    1,2,3}]{

    a.pdf}     %必须包含页数
% \thispagestyle{

    empty}
%\newpage
%\setcounter{

    page}{

    1}                  %重置页数,一切ok
\end{

    document}
并排插四图的方法:
 \begin{

    figure}[H]
           	\centering
           	\subfigure[$\theta_1 $改变]{


           		\includegraphics[width=5.5cm]{

    7.png}
           		%\caption{

    fig1}
           	}
           	\quad
           	\subfigure[$\theta_2 $改变]{


           		\includegraphics[width=5.5cm]{

    8.png}
           	}
           	\quad
           	\subfigure[$\theta_3 $改变]{


           		\includegraphics[width=5.5cm]{

    9.jpg}
           	}
           	\quad
           	\subfigure[$\theta_4 $改变]{


           		\includegraphics[width=5.5cm]{

    10.jpg}
           	}
           	\quad
           	\caption{

     $\theta_i$异号时灵敏度分析}
           \end{

    figure}
继续加油吧,害。
2021年2月11日:
在latex写作中总结一些必要的技巧很重要,可以随时调用,习惯的方法是备用一些常用的符号以及表格图片代码,排版表格习惯上使用excel先把内容处理好然后复制到网站:https://www.tablesgenerator.com/之后再复制到已有的三线表代码中进行排版与微调。
以下是比赛过程中总结的一些常用代码,仅做参考!
%常用符号
$\cdots$ 省略号
一般的根式使用 $\sqrt{
2}$;表示 n 次方根时写成$ \sqrt[3 ]{
2}$
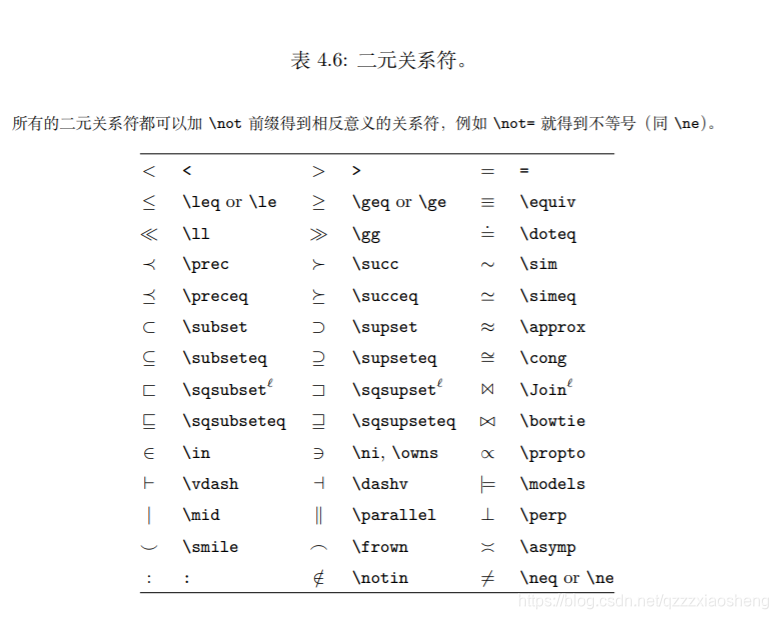
\[ \ne \ge \le \approx \equiv \] %等于,大于小于,小于等于,约等于,等价
\partial 偏导 \in 属于 \vdots \begin{
bmatrix} \rho 如 \partial 偏导 \textcelsius 摄氏度
$\delta$ \Delta 小三角 \approx 约等于
%表格
\begin{
table}[H]
\begin{
center}
\begin{
tabular}{
|c|c|c|c|c|}
\hline
日期 & 1.21-2.7 & 2.8-2.23 & 2.24-3.30 & 4.1-4.30 \\ \hline
民众关注度 & 0.1 & 0.6 & 0.85 & 0.9 \\ \hline
\end{
tabular}
\end{
center}
\end{
table}
\begin{
gather*}
\begin{
cases}
\widetilde{
x}_1 = \alpha_{
11} F_1 ~+~\cdots + \alpha_{
1m}F_m & \\
\qquad \qquad \qquad \vdots & \\
\widetilde{
x}_{
11} = \alpha_{
41} F_1 ~+~\cdots + \alpha_{
4m}F_m & \\
\end{
cases} \\
\end{
gather*}
\begin{
figure}[H] %htb %插入图片
\centering
\includegraphics[scale=0.6]{
10.png}
\caption{
stata主因子回归图
} %\label{
straddltimeScale}
\end{
figure}
\begin{
figure}[H]
\centering
\subfigure[$\theta_1 $改变]{
\includegraphics[width=5.5cm]{
7.png}
%\caption{
fig1}
}
\quad
\subfigure[$\theta_2 $改变]{
\includegraphics[width=5.5cm]{
8.png}
}
\quad
\subfigure[$\theta_3 $改变]{
\includegraphics[width=5.5cm]{
9.jpg}
}
\quad
\subfigure[$\theta_4 $改变]{
\includegraphics[width=5.5cm]{
10.jpg}
}
\quad
\caption{
$\theta_i$异号时灵敏度分析}
\end{
figure}
\begin{
verbatim}
\end{
verbatim}
%表格
\begin{
table}[H]
\resizebox{
\textwidth}{
!}{
\begin{
tabular}{
|c|c|c|c|c|c|c|c|c|c|c|}
\hline
原始值 & 4.9300 & 4.9300 & 4.9300 & 4.9300 & 4.9300 & 4.9300 & 4.9300 & 4.9300 & 4.9300 & 4.9300 \\ \hline
预测值 & 4.9300 & 3.7140 & 4.1235 & 4.5781 & 5.0828 & 5.6432 & 6.2654 & 6.9562 & 7.7232 & 8.5747 \\ \hline
相对误差 & 0.0000\% & 59.3982\% & 6.5493\% & 5.2433\% & 23.3358\% & 21.0736\% & 16.6746\% & 8.8609\% & 1.1119\% & 2.6906\% \\ \hline
级比偏差 & -1.3494 & 0.3315 & 0.0122 & 0.2715 & -0.0296 & -0.4784 & 0.0669 & 0.0915 & -0.0386 & \\ \hline
\end{
tabular}
}
\end{
table}
%代码环境 {
verbatim} 没有颜色,就是最初始用的那种 可以使用
\begin{
table}[H] % \toprule \midrule \bottomrule
\begin{
center}
\caption{
优先选择光伏电池}
\begin{
tabular}{
cccccc}
\\ \bottomrule
\end{
tabular}
\end{
center}
\end{
table}
\begin{
table}[H] % \toprule \midrule \bottomrule
\begin{
center}
\caption{
优先选择光伏电池}
\begin{
tabular}{
ccccccc}
\toprule
& \textbf{
型号} & \textbf{
第一年总发电量} & \textbf{
单位面积发电量} & \textbf{
单位面积利润} & \textbf{
单位发电量费用} & \textbf{
排名} \\ \midrule
\textbf{
南斜面} & B3 & 2158.69 & 1468.35 & -1051.36 & 128.49 & 1 \\
\textbf{
北斜面} & B3 & 1661.64 & 1130.26 & -1220.41 & 98.91 & 1 \\
\textbf{
正南面} & B3 & 1988.60 & 1352.66 & -1109.21 & 118.37 & 1 \\
\textbf{
正北面} & C7 & 8.21 & 74.14 & -136.37 & 9.85 & 1 \\
\textbf{
正西面} & B3 & 1569.12 & 1067.33 & -1251.88 & 93.40 & 1 \\
\textbf{
正东面} & B7 & 1096.68 & 657.48 & -1544.76 & 54.83 & 1
\\ \bottomrule
\end{
tabular}
\end{
center}
\end{
table}
\begin{
equation}
\beta=
\begin{
cases}
\arccos B &\in [0,180\degree] \\
360\degree -\arccos B &\in [180\degree,360\degree] \\
\end{
cases} \\
\end{
equation}
\begin{
lstlisting}
\end{
lstlisting}