Mapbox
对于区域图层颜色过滤
代码操作
let fillColor = ['match', ['get', 'name'],'杭州市','red','yellow']
let fillOpacity: any = ['match', ['get', 'name'],'杭州市',0.5, 0]
// 最后一位 yellow 和 0分别代表没有标记的城市默认颜色和默认透明的
if (window.glMap.getLayer('county-boundary')) {


        window.glMap.setPaintProperty('county-boundary', 'fill-color', fillColor)
        window.glMap.setPaintProperty('county-boundary', 'fill-opacity', fillOpacity)
        // 当然必须设置图层为visible(显示),不然如果是none就不会显示了
         window.glMap.setLayoutProperty('county-boundary', 'visibility','visible')
} else {


    window.glMap.addLayer(
        {


            id: 'county-boundary',
            source: 'water_bou',
            'source-layer': 'hy_water_bou',
            type: 'fill',
            paint: {


                'fill-color': fillColor,
                'fill-opacity': fillOpacity,
                "fill-outline-color": "red"// 边框线颜色
            }
        },
        'JN1'
    ) //JN1为style文件中的第一个点图层,确保面图层在点图层下面
}
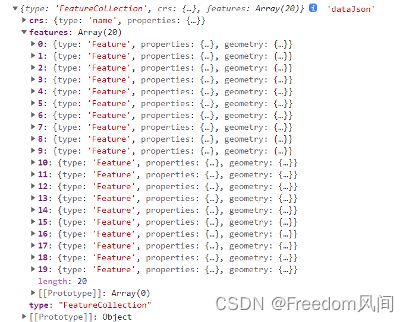
Json文件
当然在地图的json文件内会有相应的该图层的信息
"town_bou": {


      "type": "vector",
      "tiles": [
"https://gis-dev.fpi-inc.site/fpi-geo-server/gwc/service/wmts?layer=fpi-inc:hy_town_bou&style=&tilematrixset=EPSG:4490&Service=WMTS&Request=GetTile&Version=1.0.0&Format=application/vnd.mapbox-vector-tile&TileMatrix={z}&TileCol={x}&TileRow={y}"
      ]
    },
{


      "id": "county-boundary", // 图层名称
      "source": "town_bou", // 资源
      "type": "fill", // 类型也有line类型
      "source-layer": "hy_town_bou",
      "layout": {


        "visibility": "visible"
      },
      "paint": {


        "fill-color": "rgba(158,175,139, 0)",
        "fill-opacity": 1,
        "fill-outline-color": "rgba(151, 151, 151, 1)"
      }
    },
如果是线型可以这么配置:
{


    "id": "county-boundary",
    "source": "town_bou",
    "type": "line",
    "source-layer": "hy_town_bou",
    "paint": {


    "line-color": "rgba(151, 151, 151, 1)",
    "line-width": {


        "base": 2,
        "stops": [
            [ 4, 0.4 ],
            [5, 1 ],
            [12, 1.8 ]
        ]
    },
    "line-dasharray": [ 5, 1 ]
},
    "layout": {


        "line-join": "round",
        "visibility": "visible"
    }
},
或者
map.addLayer({


    'id': 'states-layer-outline',
    'type': 'line',
    'source': {


        'type': 'geojson',
        'data': 'test.js'
    },
    'paint': {


        'line-color': 'rgba(255, 0, 0, 1)',
        'line-width': 4
    }
});
监听地图点击事件 判断是点击了图层还是点击了地图点位
window.glMap.on('click', e => {


    const layers = ['site-around-symbol-2','site-around-symbol-1',' site-around-symbol-3']
    const features = window.glMap.queryRenderedFeatures(e.point,{


        // 对图层进行过滤防止因为没有这个图层而报错
        layers: layers.filter(layer =>window.glMap.getLayer(layer))
    })
    // 如何点击的不是以上layers数组内的图层则features为[]如果是则是有长度的
    if (!features.length) this.curAroundSite = null
})
层级控制
window.glMap.moveLayer(a, b). 将b放于a之上
// 将点位图层放在 区划边界之上
if (window.glMap.getLayer(MAP_BOUNDARY_LINE) && window.glMap.getLayer(MAP_BOUNDARY_SHADOW)) {


    if (window.glMap.getLayer(MAP_COMMON_POINT)) {


        window.glMap.moveLayer(MAP_BOUNDARY_LINE,MAP_COMMON_POINT)
        window.glMap.moveLayer(MAP_BOUNDARY_SHADOW,MAP_COMMON_POINT)
    }
    if (window.glMap.getLayer(ANALYSIS_DISTANCE_POINT)) {


        window.glMap.moveLayer(MAP_BOUNDARY_LINE,ANALYSIS_DISTANCE_POINT)
        window.glMap.moveLayer(MAP_BOUNDARY_SHADOW,ANALYSIS_DISTANCE_POINT)
    }
}

`Addlayer方法`
map.addLayer({


    id:MAP_BOUNDARY_LINE,
    type: 'line',
    source: {


        type: 'geojson',
        data: dataJson
    },
    layout: {


        'line-join': 'round',
        'line-cap': 'round',
        'visibility': 'visible'
    }
}, beforeLayerId) // 用于在什么图层之上
添加mark
let el = document.createElement('div')
el.className = 'my-street-marker'
el.innerHTML = '<span class="street-number">' + item.displayName +
'</span><span class="street-number" style="color:
green;margin-left: 20px;">' + item.compositeIndex + '</span>'
// 清空window下的marker
if (!window.rankMarkers) window.rankMarkers = {

    }
let marker = window.rankMarkers[item.name]
if (marker) {


   marker.remove()
   marker = null
}
window.rankMarkers[item.name] = new mapboxgl.Marker(el)
.setLngLat([item.longitude, item.latitude])
.addTo(window.glMap)
// window.glMap是地图对象,longitude,latitude是坐标参数如: 112,115
// 还有其他参数比如:
window.clickPointMarker = new mapboxgl.Marker({


   element: el,
   anchor: 'bottom',
   // offset: [0, 8],
}).setLngLat(coordinates).addTo(window.glMap)
添加图层
添加资源
MapUtil._addSourceToMap('gas-station', dataJson)
window.glMap.addLayer(
{
id: 'mask-layer',
type: 'fill',
source: ' gas-station ',
layout: {
visibility: 'visible' },
paint: {
'fill-color': 'rgba(0, 0, 0, 1)',
'fill-opacity': 0.5,
},
},
'', // 第二个参数代表在指定图层之上
)
{
id: 'province-station-layer',
type: 'symbol',
source: 'gas-station',
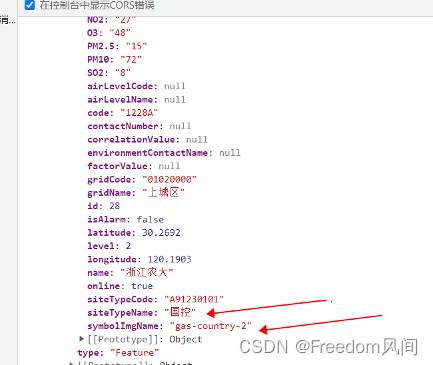
filter: ['all', ['==', 'siteTypeName', '省控']], // 过滤数据
layout: {
'icon-image': '{symbolImgName}',
'icon-size': 0.65,
'icon-ignore-placement': true,
},
},
'country-station-layer', // 第二个参数代表在指定图层之上
地图移动到指定位置
window.glMap.easeTo({


 center: [112, 50],
 speed: 0.6,
 curve: 1.0,
})
打开弹窗
window.glMap.on('click', layername, function(e) {


let subPopup = Vue.extend(popup) // popup引入的vue组件
let popContent = new subPopup({

     // 设置组件内props参数
propsData: {


      map: window.map,
      properties: e.features[0].properties,
    },
})
// 打开弹窗
if (window.glPopup) window.glPopup.remove()
window.glPopup = new mapboxgl.Popup({


    className: 'blue-popup',
    closeOnClick: true,
    closeButton: false,
    offset: offset,
})
    .setLngLat(coordinates) // coordinates坐标数组
    .setDOMContent(popContent.$mount().$el)
    .setMaxWidth('none')
    .addTo(window.glMap)