蓝桥杯第十三届Web组国赛天气趋势A详细题解
介绍
日常生活中,气象数据对于人们的生活具有非常重要的意义,数据的表现形式多种多样,使用图表进行展示使数据在呈现上更加直观。
本题请实现一个 Y 城 2022 年的天气趋势图。
准备
开始答题前,需要先打开本题的项目代码文件夹,目录结构如下:
├── css
│   └── style.css
├── effect-1.gif
├── effect-2.gif
├── index.html
└── js
    ├── axios.js
    ├── echarts.min.js
    ├── vue.min.js
    └── weather.json
其中:
- css/style.css 是样式文件。
- index.html 是主页面。
- js/axios.js 是 axios 文件。
- js/vue.min.js 是 vue2.x 文件。
- js/echarts.min.js 是 echarts 文件。
- js/weather.json 是请求需要用到的天气数据。
- effect-1.gif 是当月和未来七天切换的效果图。
- effect-2.gif 是最终完成的效果图。
文件下载地址
在浏览器中预览 index.html 页面效果如下: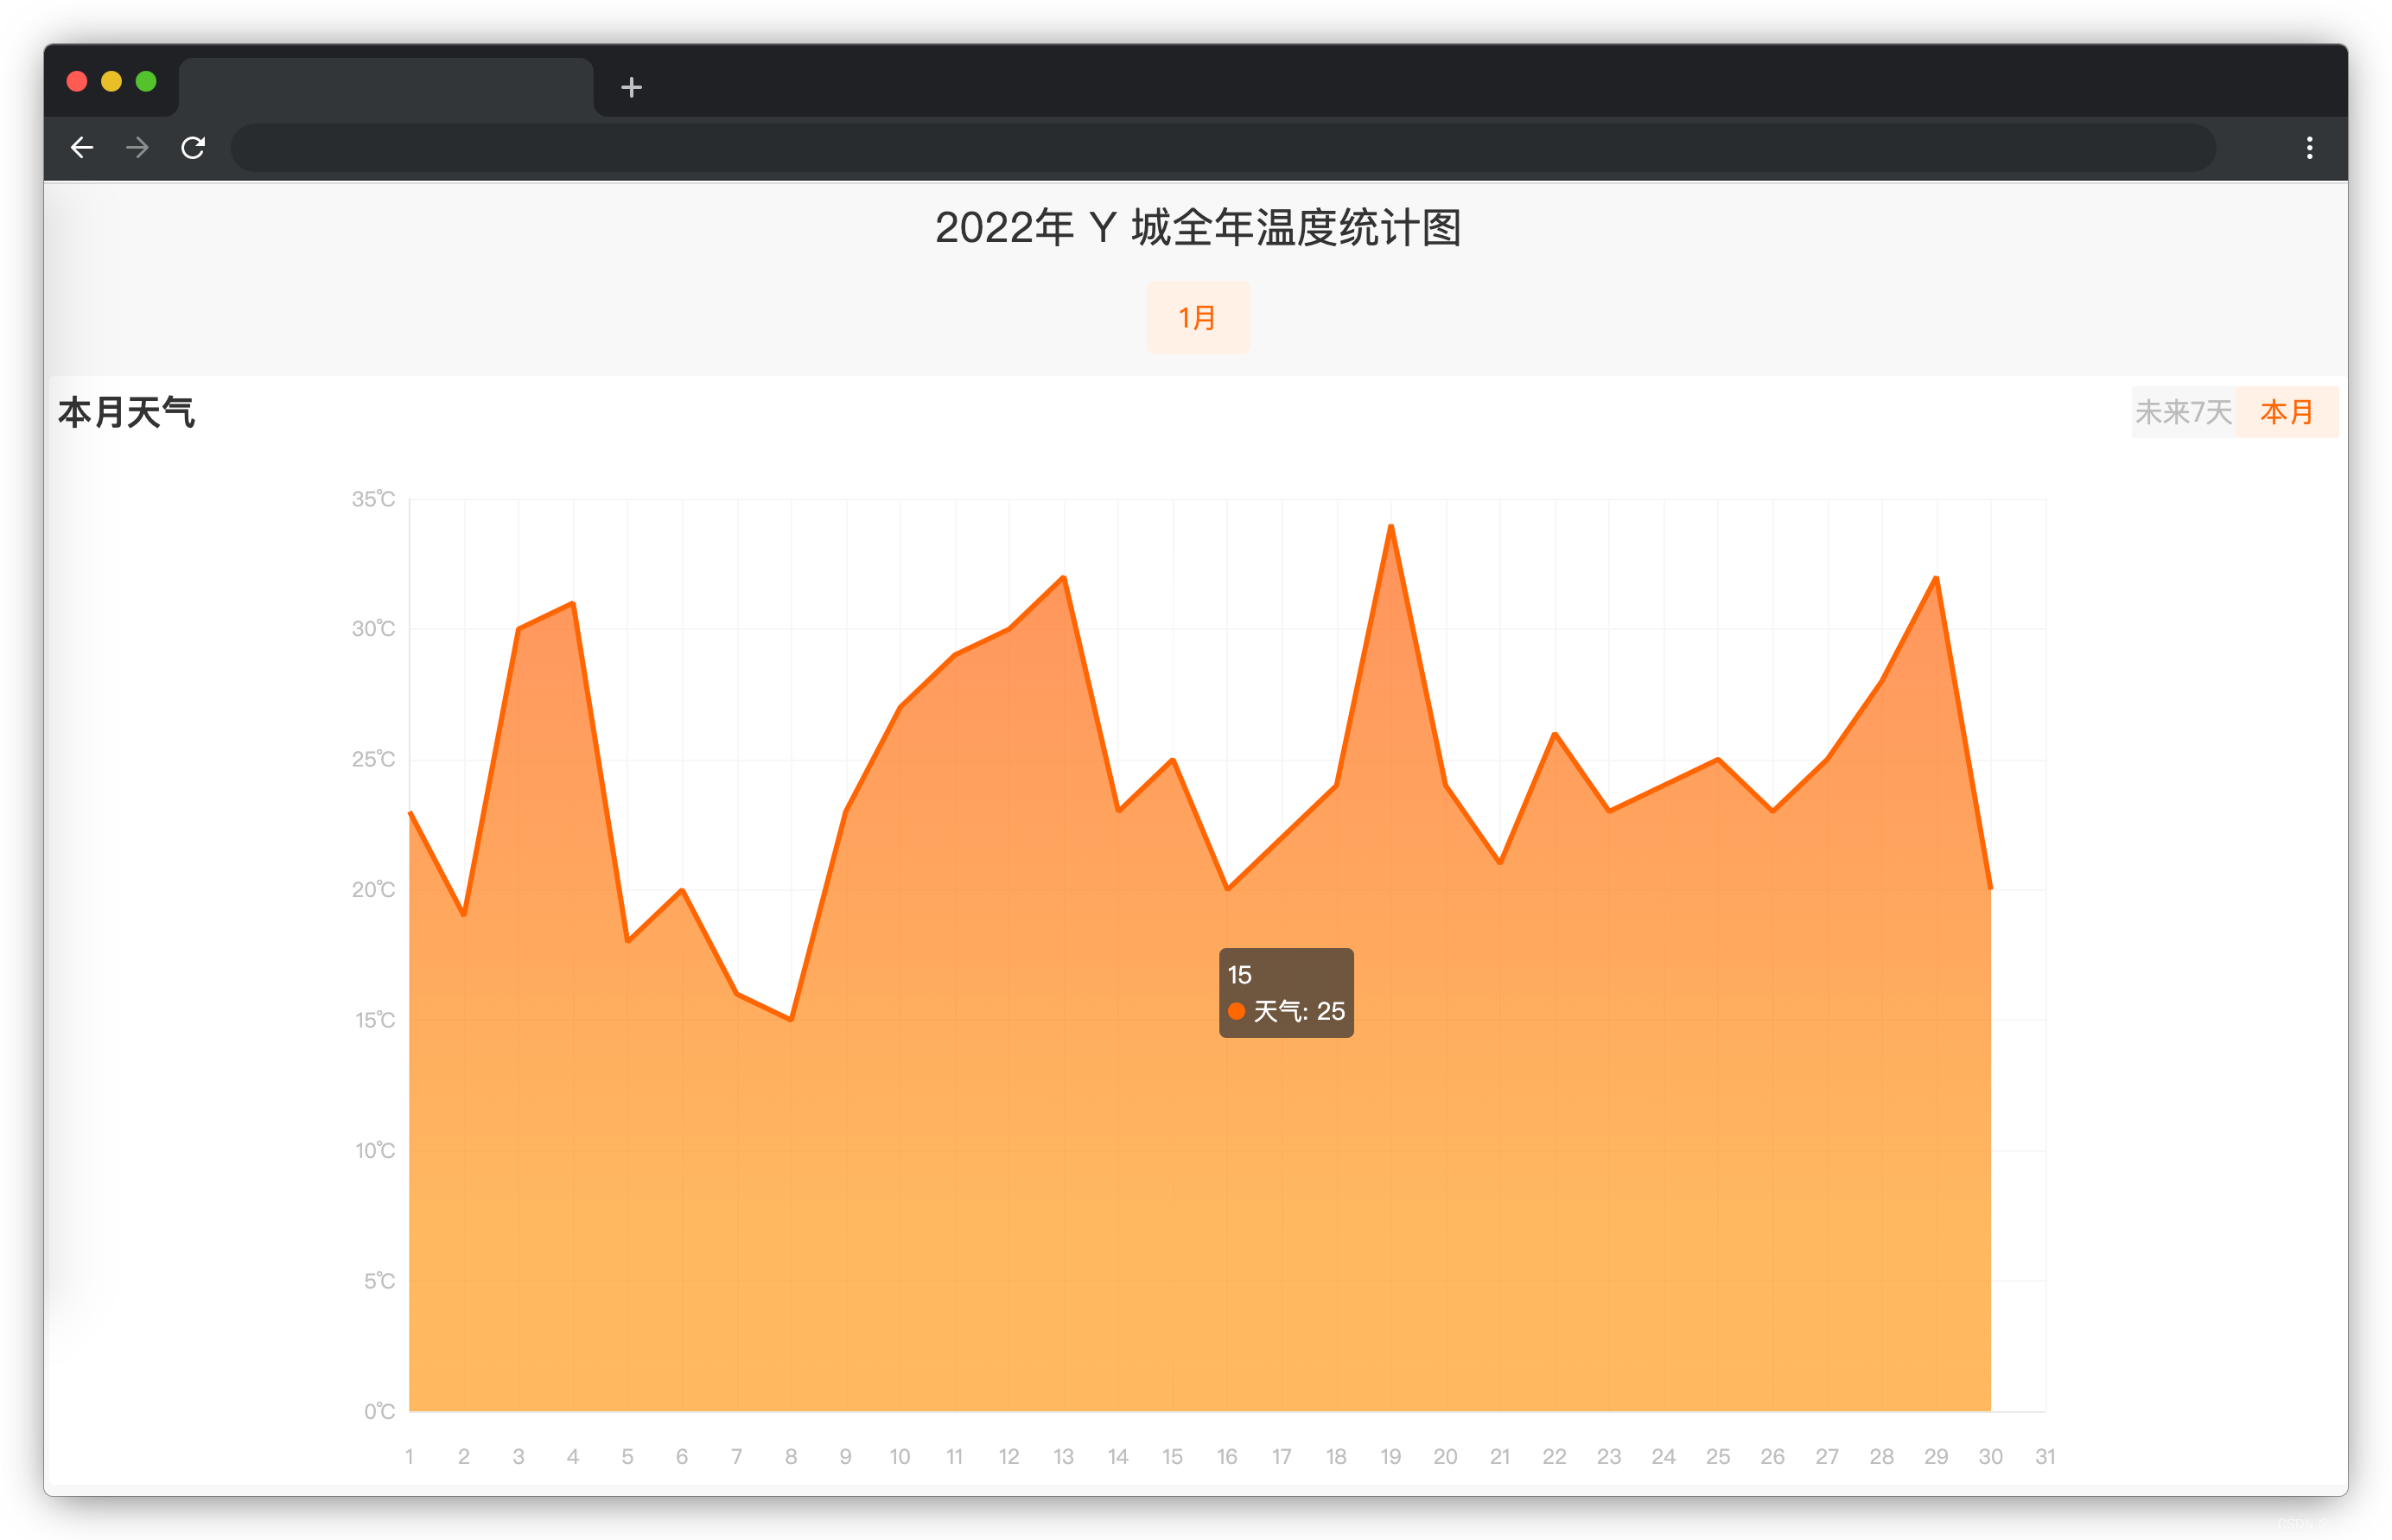
目标
请在 index.html 文件中补全代码,具体需求如下:
- 完成数据请求(数据来源 ./js/weather.json),weather.json 中存放的数据为 12个月对应的温度数据。在项目目录下已经提供了 axios,考生可自行选择是否使用。注意:调试完成后请将请求地址写死为./js/weather.json。
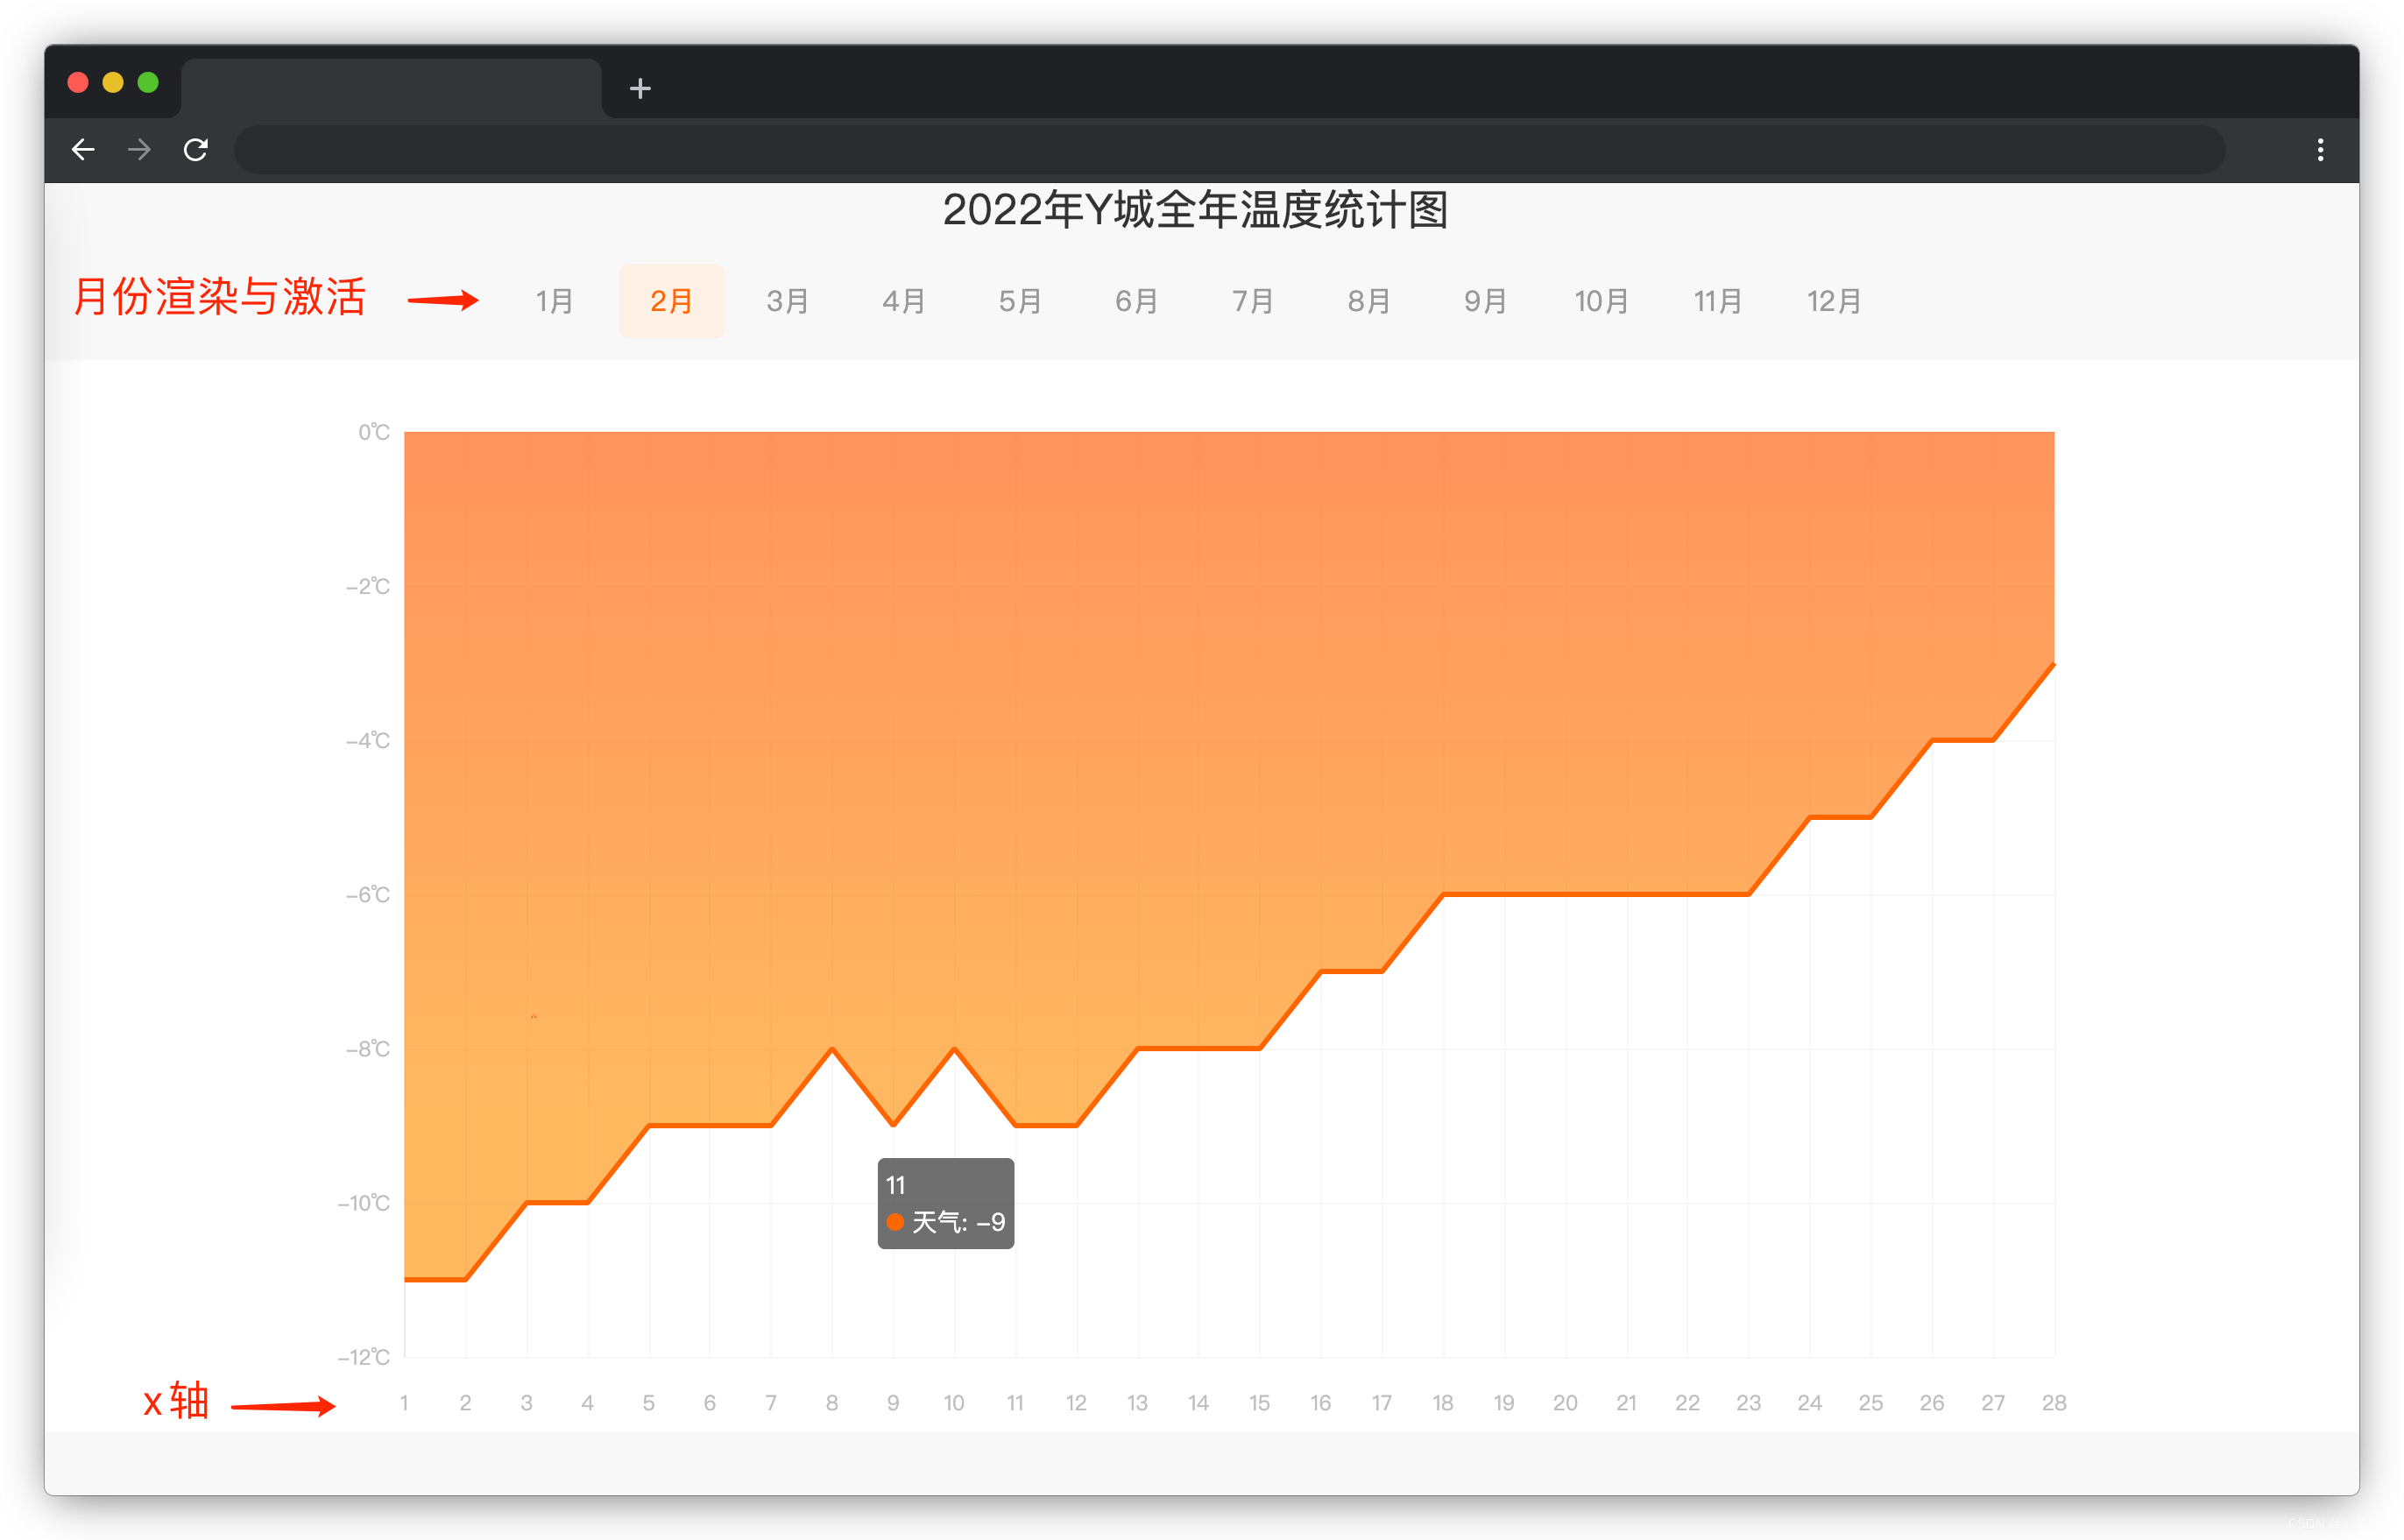
- 把 data 中的月份数据 monthList, 在 class=month 标签下面的 li上完成渲染,点击月份则切换对应月份的温度数据同时被点击的月份会变成激活状态( .active 类),x 轴为日期,y 轴为温度,默认显示 1 月份数据。
- 如果点击的月份是当天(通过时间函数动态获取的时间)所在月份,本月和未来七天切换的 tab (即 id=currentMonth元素)显示,其他月份 currentMonth 元素不显示。
- 默认显示本月数据。
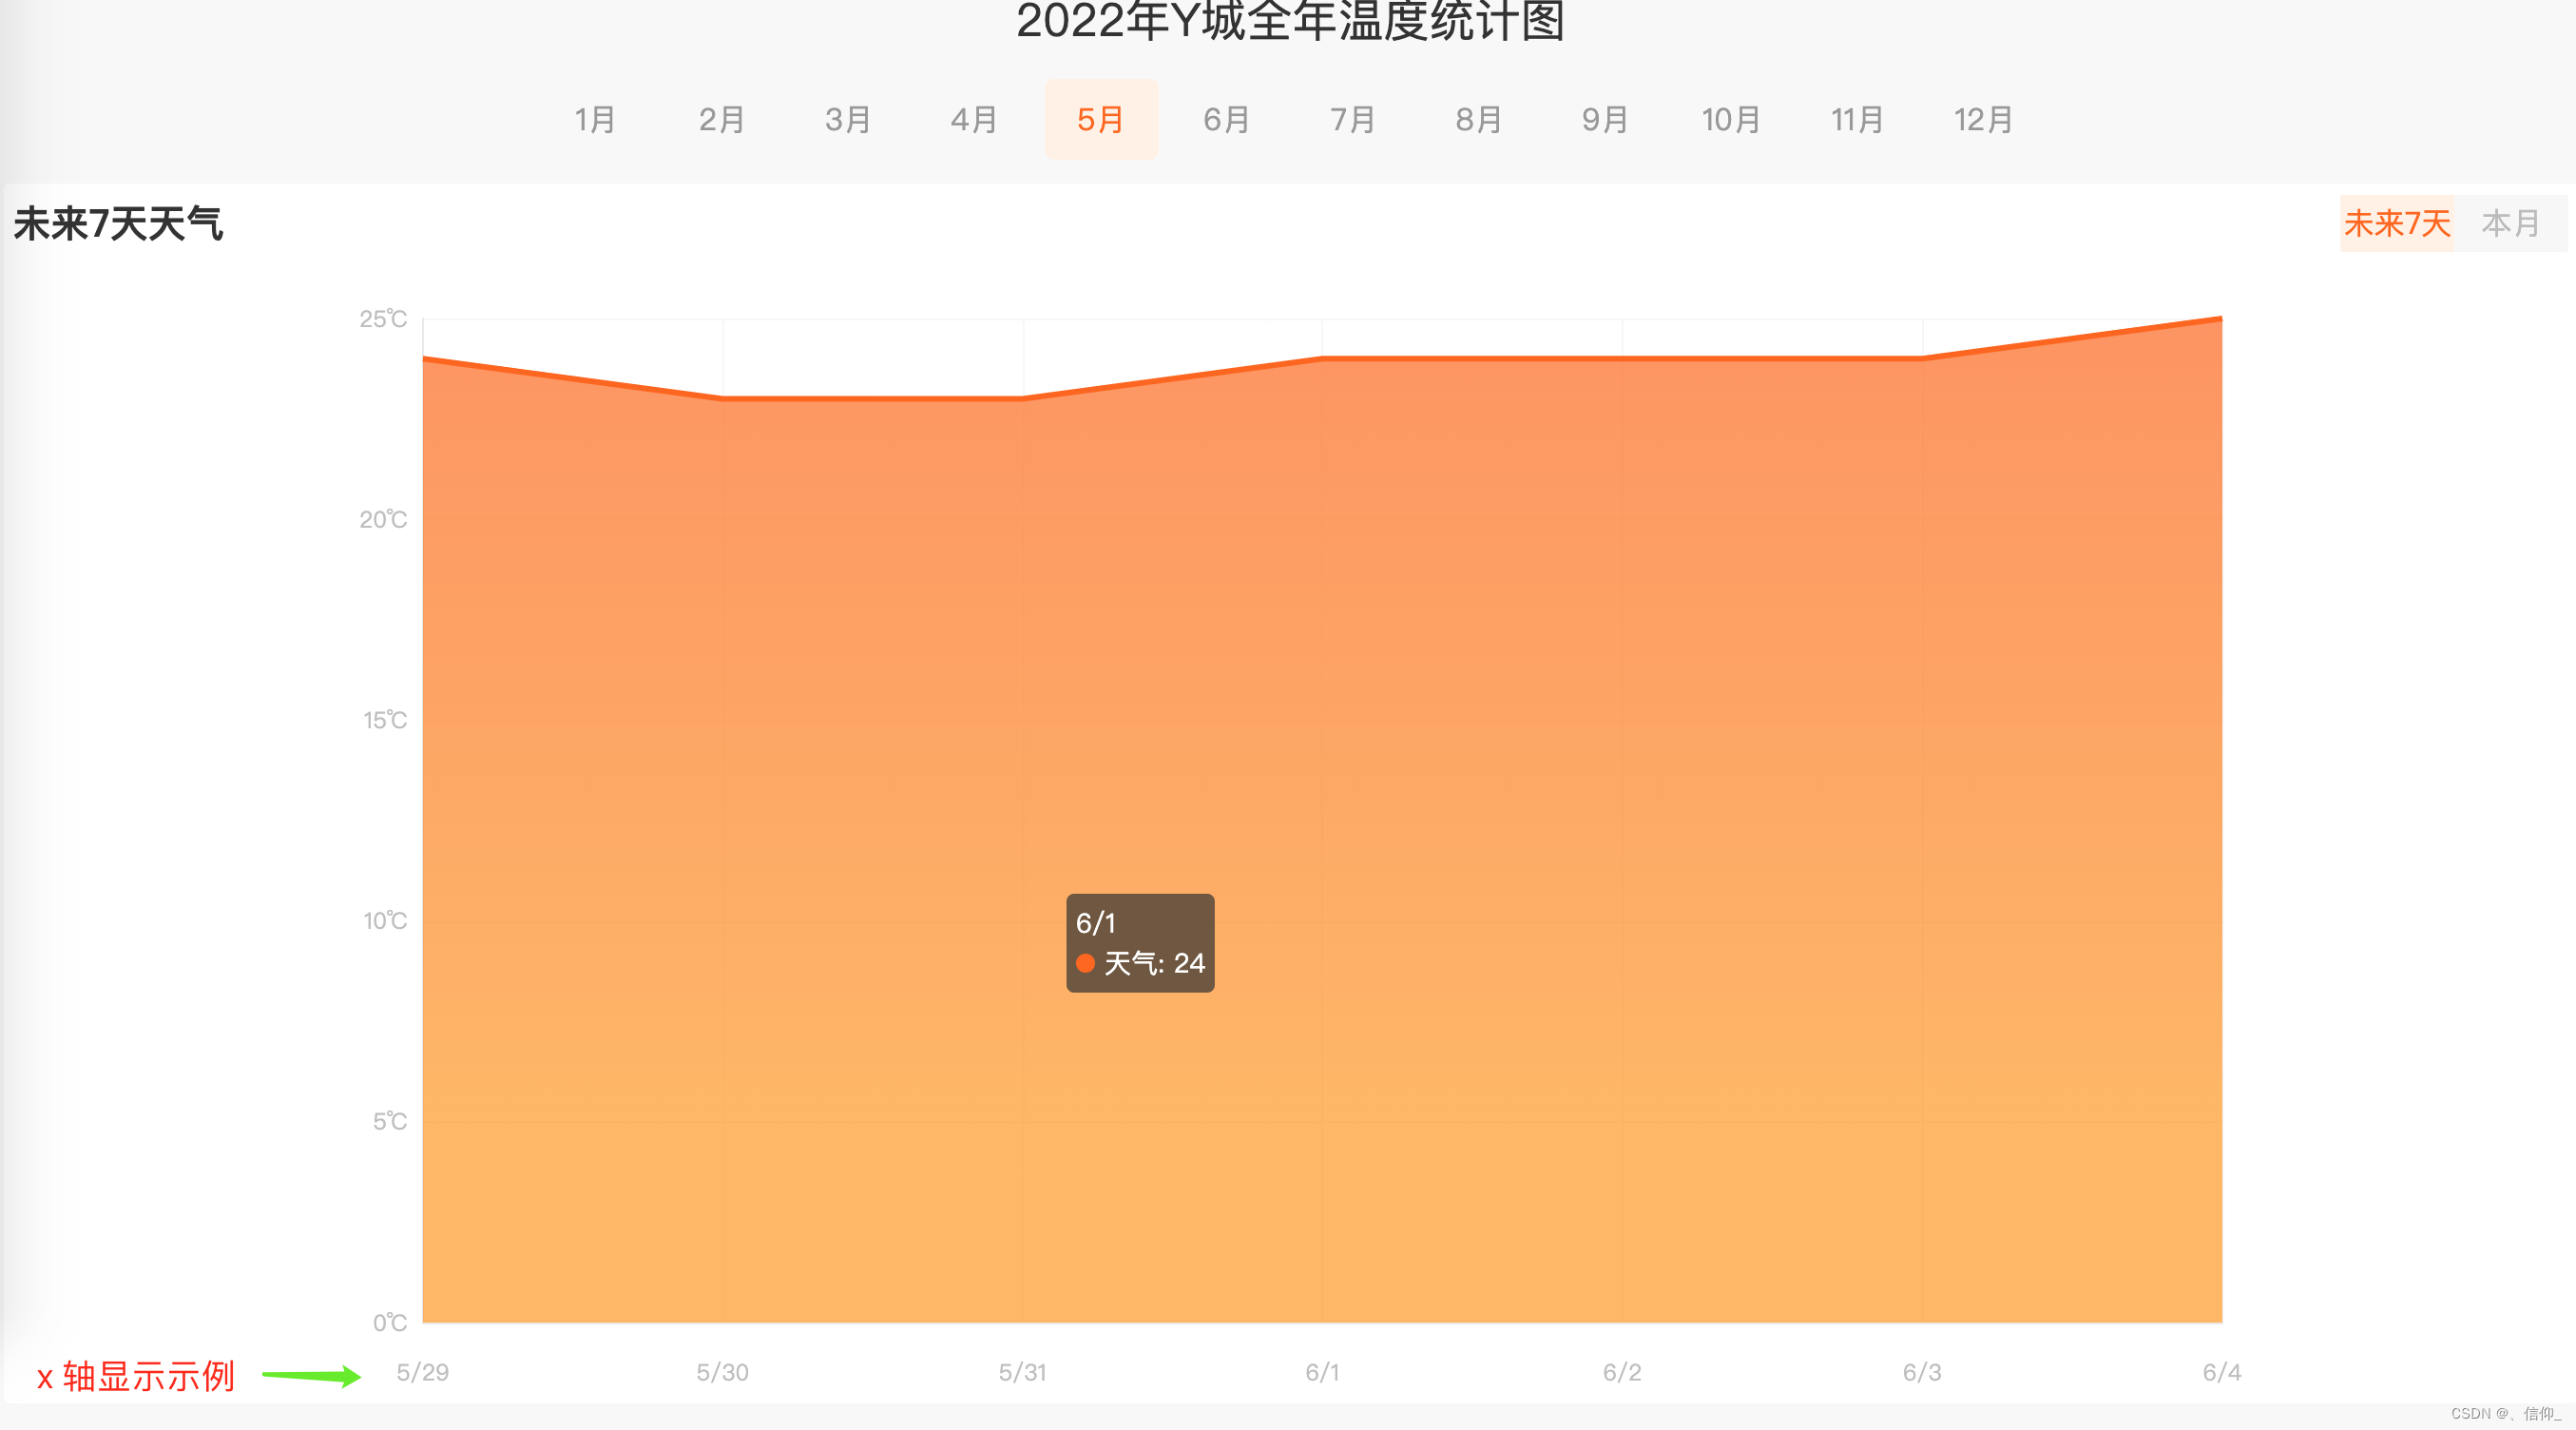
- 点击本月显示当月数据,点击未来七天显示从当天(包含当天)开始未来七天的数据,当显示未来七天数据时 x 轴需要显示为月/日格式。
- 点击 tab 上本月和未来七天会切换激活状态(.active)。
以当天为 5 月 29 号为例,未来七天 x 轴显示示例(即 x 轴显示成:5/29,5/30,5/31,6/1,6/2,6/3,6/4):
本月和未来七天 切换效果见文件夹下 effect-1.gif。
最终效果见文件夹下面的 gif 图,图片名称为 effect-2.gif(提示:可以通过 VS Code 或者浏览器预览 gif 图片)
规定
- 请求地址为./js/weather.json,切勿写成其他地址格式,以免造成无法判题通过。
- 请严格按照考试步骤操作,切勿修改考试默认提供项目中的文件名称、文件夹路径、class 名、id 名、图片名等,以免造成无法判题通过。
判分标准
- 完成目标 1,得 5 分。
- 完成目标 2,得 10 分。
- 完成目标 3,得 10 分。
详细题解
<!DOCTYPE html>
<html>

<head>
  <meta charset="UTF-8" />
  <title>天气趋势</title>
  <meta name="viewport" content="width=device-width,initial-scale=1,minimum-scale=1,maximum-scale=1,user-scalable=no" />
  <link rel="stylesheet" type="text/css" href="css/style.css" />
  <script src="./js/axios.js"></script>
  <script src="js/vue.min.js" type="text/javascript" charset="utf-8"></script>
  <script src="js/echarts.min.js" type="text/javascript" charset="utf-8"></script>
</head>

<body>
  <div id="app">
    <div class="top-bar">2022年 Y 城全年温度统计图</div>
    <!-- 主体 -->
    <div class="container">
      <!-- 月份 -->
      <div class="month">
        <ul>
          <!-- TODO:待补充代码 在下面的 li 标签中完成 12个月份 (即 monthList) 的渲染  -->
          <li :class="month==index? 'active':'' " v-for="(item,key,index ) in monthList " @click="changeIndex(index)">
            {

   {item}}</li>
        </ul>
      </div>
      <div class="chart">
        <!-- TODO:待补充代码  -->
        <!-- currentMonth  未来七天和本月 tab 切换,只有当前月才显示 -->
        <div id="currentMonth" v-show="nowMonth==month">
          <div class="title">
            <h3>{

   {type?'本月天气':'未来7天天气'}}</h3>
            <div class="type" @click="changeType($event)">
              <span id="seven" :class="type?'':'active' ">未来7天</span>
              <span id="current" :class="type?'active':'' ">本月</span>
            </div>
          </div>
        </div>
        <div id="chart"></div>
      </div>
    </div>
  </div>
</body>

</html>
<script>
  // TODO:待补充代码
  var vm = new Vue({


    el: "#app",
    data: {


      chart: null, // 图表
      chartOptions: null, // 图表配置项
      typeTitle: "本月天气",
      monthList: {


        January: "1月",
        February: "2月",
        March: "3月",
        April: "4月",
        May: "5月",
        June: "6月",
        July: "7月",
        August: "8月",
        September: "9月",
        October: "10月",
        November: "11月",
        December: "12月",
      },
      weatherList: [],//12个月的温度信息
      xData: [],//用于存储切换月份时echarts渲染的x轴数据
      yData: [],//用于存储切换月份时echarts渲染的y轴数据
      month: 0,//当前遍历到的月份
      nowMonth: (new Date).getMonth(),//现在的月份
      type: 1,//用于 未来七天天气 和 本月天气 的切换 1表示本月天气 0表示未来七天提前
      xSevenDate: [],//用于存储未来七天天气的 x轴数据
      ySevenDate: [],//用于存储未来七天天气的 y轴数据
    },
    mounted: function () {


      // 初始化 echarts
      axios.get("./js/weather.json").then(res => {


        // console.log(res.data);
        // 最后得到的this.weatherList 是只有温度数据的二维数组[[...],[...]]
        this.weatherList = res.data.map(item => {


          // console.log(item);

          for (let key in item) {


            // key 是像January February 这样的数据
            //item[key] 是 January February 它们后面的数组
            return item[key]
          }
        })
        // console.log(this.weatherList);
        this.updateXY()
      })
      this.$nextTick(() => {


        this.initChart();
      });
    },
    methods: {


      initChart() {


        // 初始化图表
        this.chart = echarts.init(document.getElementById("chart"));
        // 配置项
        this.chartOptions = {


          grid: {


            top: 35,
            bottom: 5,
            left: 10,
            right: 10,
            containLabel: true,
          },
          tooltip: {


            trigger: "axis",
            axisPointer: {


              lineStyle: {


                color: {


                  type: "linear",
                  x: 0,
                  y: 0,
                  x2: 0,
                  y2: 1,
                  colorStops: [
                    {


                      offset: 0,
                      color: "rgba(255,255,255,0)",
                    },
                    {


                      offset: 0.5,
                      color: "rgba(255,255,255,1)",
                    },
                    {


                      offset: 1,
                      color: "rgba(255,255,255,0)",
                    },
                  ],
                  global: false,
                },
              },
            },
          },
          xAxis: [
            {


              type: "category",
              boundaryGap: false,
              axisLabel: {


                formatter: "{value}",
                fontSize: 12,
                margin: 20,
                textStyle: {


                  color: "#bfbfbf",
                },
              },
              axisLine: {


                lineStyle: {


                  color: "#e9e9e9",
                },
              },
              splitLine: {


                show: true,
                lineStyle: {


                  color: "#f7f7f7",
                },
              },
              axisTick: {


                show: false,
              },
              // x 轴显示的数据,日期
              data: this.xData,
            },
          ],
          yAxis: [
            {


              boundaryGap: false,
              type: "value",
              axisLabel: {


                textStyle: {


                  color: "#bfbfbf",
                },
                formatter: `{value}\u2103`,
              },
              nameTextStyle: {


                color: "#fff",
                fontSize: 12,
                lineHeight: 40,
              },
              splitLine: {


                lineStyle: {


                  color: "#f7f7f7",
                },
              },
              axisLine: {


                show: true,
                lineStyle: {


                  color: "#e9e9e9",
                },
              },
              axisTick: {


                show: false,
              },
            },
          ],
          series: [
            {


              name: "天气",
              type: "line",
              smooth: false,
              showSymbol: false,
              symbolSize: 0,
              zlevel: 3,
              itemStyle: {


                color: "#ff6600",
                borderColor: "#a3c8d8",
              },
              lineStyle: {


                normal: {


                  width: 3,
                  color: "#ff6600",
                },
              },
              areaStyle: {


                normal: {


                  color: new echarts.graphic.LinearGradient(
                    0,
                    0,
                    0,
                    1,
                    [
                      {


                        offset: 0,
                        color: "#ff6600",
                      },
                      {


                        offset: 0.8,
                        color: "#ff9900",
                      },
                    ],
                    false
                  ),
                },
              },
              //  Y 轴显示的数据,即温度数据
              data: this.yData,
            },
          ],
        };

        // 调用此方法设置 echarts 数据
        this.chart.setOption(this.chartOptions);
      },

      //  更新X和Y轴数据的方法
      updateXY() {


        this.yData = this.weatherList[this.month]
        //map方法获取x轴的数据
        this.xData = this.yData.map((value, index) => index + 1)
        this.initChart();
      },
      //每次点击月份后调用该方法 重新设置需要渲染的月份
      changeIndex(index) {


        this.month = index
        this.type = 1
        this.updateXY()

      },
      //未来七天天气 和本月天气切换的方法
      changeType(e) {


        if (e.target.id === 'seven') {


          this.type = 0
          this.set7day()
        } else {


          this.type = 1
          this.updateXY()

        }
      },
      //设置未来七天的数据
      set7day() {


        //每次调用的时候先置为空 否则 每次调用都会再次基础上push一遍 那样的话this.xseventDate就变成 [this.xseventDate,this.xseventDate]
        this.xSevenDate = []
        this.ySevenDate = []
        //获取当前时间对象
        let date = new Date
        for (let i = 0; i < 7; i++) {


          /***
           * date.getMonth()获取当前月份 但是它的返回值是0-11 所以需要+1
           * date.getDate() 获取当前日期 返回值是  1至当前月份的最大天数 不需要+1
           ***/
          this.xSevenDate.push(`${
        date.getMonth() + 1}/${
        date.getDate()}`)

          /***
           * this.weatherList存储的数据是类似于这的二维数组 [[-13, -13, -13 ],[-11, -11, -10]]
           *  恰好getMonth()是从零开始计数的 this.weatherList[date.getMonth()]恰好是当前整个月份的温度的数据
           *
           * 对于  this.weatherList[date.getMonth()][date.getDate() - 1] 是过去当天的温度数据
           *  因为getDate()从一开始计数  数组下标从0开始计数  所以需要减一
           ***/
          this.ySevenDate.push(`${
        this.weatherList[date.getMonth()][date.getDate() - 1]}`)
          /***
           * date.getTime()是获取 1970 年 1 月 1 日至今的毫秒数。
           * 1000 * 60 * 60 * 24 是一天的毫秒数
           * 在for循环下 每次循环都加一天 这样就可以获得从今天到未来七天的温度数据了
           ***/
          date.setTime(date.getTime() + 1000 * 60 * 60 * 24)
          // console.log(date);
        }
        this.xData = this.xSevenDate
        this.yData = this.ySevenDate
        this.initChart()

      }
    },

  });
</script>
运行结果