import torch
import matplotlib. pyplot as plt
import torch. nn. functional as F
from sklearn. datasets import load_iris
from torch. autograd import Variable
from torch. optim import SGD
use_cuda = torch. cuda. is_available( )
print ( use_cuda)
False
iris = load_iris( )
print ( iris. keys( ) )
dict_keys(['data', 'target', 'frame', 'target_names', 'DESCR', 'feature_names', 'filename'])
x = iris[ 'data' ]
y = iris[ 'target' ]
print ( x. shape)
print ( y. shape)
x = torch. FloatTensor( x)
y = torch. LongTensor( y)
x, y = Variable( x) , Variable( y)
print ( x, y)
(150, 4)
(150,)
tensor([[5.1000, 3.5000, 1.4000, 0.2000],
        [4.9000, 3.0000, 1.4000, 0.2000],
        ................................
        [6.2000, 3.4000, 5.4000, 2.3000],
        [5.9000, 3.0000, 5.1000, 1.8000]]) tensor([0, 0, 0, 0, 0, 0, 0, 0, 0, 0, 0, 0, 0, 0, 0, 0, 0, 0, 0, 0, 0, 0, 0, 0,
        0, 0, 0, 0, 0, 0, 0, 0, 0, 0, 0, 0, 0, 0, 0, 0, 0, 0, 0, 0, 0, 0, 0, 0,
        0, 0, 1, 1, 1, 1, 1, 1, 1, 1, 1, 1, 1, 1, 1, 1, 1, 1, 1, 1, 1, 1, 1, 1,
        1, 1, 1, 1, 1, 1, 1, 1, 1, 1, 1, 1, 1, 1, 1, 1, 1, 1, 1, 1, 1, 1, 1, 1,
        1, 1, 1, 1, 2, 2, 2, 2, 2, 2, 2, 2, 2, 2, 2, 2, 2, 2, 2, 2, 2, 2, 2, 2,
        2, 2, 2, 2, 2, 2, 2, 2, 2, 2, 2, 2, 2, 2, 2, 2, 2, 2, 2, 2, 2, 2, 2, 2,
        2, 2, 2, 2, 2, 2])
class Net ( torch. nn. Module) :
def __init__ ( self, n_feature, n_hidden, n_hidden1, n_output) :
super ( Net, self) . __init__( )
self. hidden = torch. nn. Linear( n_feature, n_hidden)
self. hidden1 = torch. nn. Linear( n_hidden, n_hidden1)
self. predict = torch. nn. Linear( n_hidden1, n_output)
def forward ( self, x) :
x = F. sigmoid( self. hidden( x) )
x = self. predict( x)
out = F. log_softmax( x, dim = 1 )
return out
net = Net( n_feature= 4 , n_hidden= 5 , n_hidden1= 5 , n_output= 4 )
print ( net)
Net(
  (hidden): Linear(in_features=4, out_features=5, bias=True)
  (hidden1): Linear(in_features=5, out_features=5, bias=True)
  (predict): Linear(in_features=5, out_features=4, bias=True)
)
if use_cuda:
x = x. cuda( )
y = y. cuda( )
net = net. cusa( )
optimizer = SGD( net. parameters( ) , lr= 0.5 )
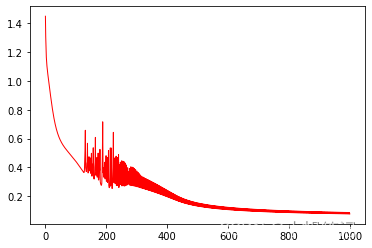
px, py = [ ] , [ ]
for i in range ( 1000 ) :
prediction = net( x)
loss = F. nll_loss( prediction, y)
optimizer. zero_grad( )
loss. backward( )
optimizer. step( )
print ( i, "loss" , loss. data. item( ) )
px. append( i)
py. append( loss. data. item( ) )
0 loss 1.448301076889038
1 loss 1.3052066564559937
..............
998 loss 0.0880339965224266
999 loss 0.07817251980304718
plt. plot( px, py, 'r-' , lw = 1 )
plt. show( )