0x01. 背景
在这个例子中,我们知道三个观察变量的因果结构,我们想得到一些反事实的问题,例如“如果我采用了医生的不同建议,会发生什么?”
更具体地说,患有严重眼干症的爱丽丝决定使用远程在线医疗平台,因为她无法在自己居住的地方看眼科医生。她通过报告自己的病史来判断爱丽丝是否患有罕见的过敏症,平台最后为她推荐了两种可能的眼药水,成分略有不同(“选项1”和“选项2”)。
爱丽丝在网上快速搜索了一下,她发现选项1有很多积极的评价。尽管如此,她还是决定使用第二种方法,因为她的母亲过去也使用过这种方法,而且效果很好。几天后,爱丽丝的视力好多了,症状也开始消失。然而,她很好奇,如果她使用了非常流行的选项1,甚至什么都不做,会发生什么。
该平台为用户提供了反事实问题的可能性,只要他们报告他们所遵循的选项的结果。
0x02. 模拟数据
我们描述SCM框架如下, f p 1 , p 2 f_{p1,p2} fp1,p2是对模型增加的噪声,表示为: V i s i o n = V n + f p 1 , p 2 ( T r e a t m e n t , C o n d i t i o n ) Vision=V_n+f_{p1,p2}(Treatment, Condition) Vision=Vn+fp1,p2(Treatment,Condition)。我们对三个观测变量的原始特征 N T , N C , N V N_T,N_C,N_V NT,NC,NV加噪声进行采样,目标变量的Vision则是 N V N_V NV加上其输入节点的噪声。
T r e a t m e n t = N T Treatment=N_T Treatment=NT~0,1或2的概率分别为33%:33%的用户什么都不做,33%的用户选择选项1,33%的用户选择选项2。这与患者是否患有罕见疾病无关。
C o n d i t i o n = N C Condition=N_C Condition=NC~伯努利(0.01):患者是否有罕见病。
V i s i o n = N V + f p 1 , p 2 ( T r e a t m e n t , C o n d i t i o n ) = N V − P 1 ( 1 − C o n d i t i o n ) ( 1 − T r e a t m e n t ) ( 2 − T r e a t m e n t ) + 2 P 2 ( 1 − C o n d i t o n ) T r e a t m e n t ( 2 − T r e a t m e n t ) + P 2 ( 1 − C o n d i t i o n ) ( 3 − T r e a t m e n t ) ( 1 − T r e a t m e n t ) T r e a t m e n t − 2 P 2 C o n d i t o n T r e a t m e n t ( 2 − T r e a t m e n t ) − P 2 C o n d i t o n ( 3 − T r e a t m e n t ) ( 1 − T r e a t m e n t ) T r e a t m e n t Vision=N_V+f_{p1,p2}(Treatment, Condition)=N_V-P_1(1-Condition)(1-Treatment)(2-Treatment)+2P_2(1-Conditon)Treatment(2-Treatment)+P_2(1-Condition)(3-Treatment)(1-Treatment)Treatment-2P_2ConditonTreatment(2-Treatment)-P_2Conditon(3-Treatment)(1- Treatment)Treatment Vision=NV+fp1,p2(Treatment,Condition)=NV−P1(1−Condition)(1−Treatment)(2−Treatment)+2P2(1−Conditon)Treatment(2−Treatment)+P2(1−Condition)(3−Treatment)(1−Treatment)Treatment−2P2ConditonTreatment(2−Treatment)−P2Conditon(3−Treatment)(1−Treatment)Treatment
P 1 P_1 P1是一个常数,在患者没有罕见的情况下,原始视力会下降,他没有服用任何药物。
P 2 P_2 P2是一个常数,根据患者是否患有这种疾病以及他们将使用的滴剂类型,原始视力将相应地增加或减少。更具体地说:
If Condition = 0 and Treatment = 1 then Vision = N_V + P_2

elIf Condition = 0 and Treatment = 2 then Vision = N_V - P_2

elIf Condition = 1 and Treatment = 1 then Vision = N_V - P_2

elIf Condition = 1 and Treatment = 2 then Vision = N_V + P_2

elIf Condition = 0 and Treatment = 0 then Vision = N_V - P_1

elif Condition = 1 and Treatment = 0 then Vision = N_V - P3
对于这样的罕见事件,比如有条件(condition =1,有1%的低概率),需要有大量的样本来训练模型,以便准确地反映这些罕见事件。这就是为什么我们在这里使用10000个样本来生成患者数据库。
生成正常数据:
from scipy.stats import bernoulli, norm, uniform
import numpy as np
from random import randint
import pandas as pd

n_unobserved = 10000
unobserved_data = {


   'N_T': np.array([randint(0, 2) for p in range(n_unobserved)]),
   'N_vision': np.random.uniform(0.4, 0.6, size=(n_unobserved,)),
   'N_C': bernoulli.rvs(0.01, size=n_unobserved)
}
P_1 = 0.2
P_2 = 0.15

def create_observed_medical_data(unobserved_data, name):
    observed_medical_data = {

    }
    observed_medical_data['Condition'] = unobserved_data['N_C']
    observed_medical_data['Treatment'] = unobserved_data['N_T']
    observed_medical_data['Vision'] = unobserved_data['N_vision'] + (-P_1)*(1 - observed_medical_data['Condition'])*(1 - observed_medical_data['Treatment'])*(2 - observed_medical_data['Treatment']) + (2*P_2)*(1 - observed_medical_data['Condition'])*(observed_medical_data['Treatment'])*(2 - observed_medical_data['Treatment']) + (P_2)*(1 - observed_medical_data['Condition'])*(observed_medical_data['Treatment'])*(1 - observed_medical_data['Treatment'])*(3 - observed_medical_data['Treatment']) + 0*(observed_medical_data['Condition'])*(1 - observed_medical_data['Treatment'])*(2 - observed_medical_data['Treatment']) + (-2*P_2)*(unobserved_data['N_C'])*(observed_medical_data['Treatment'])*(2 - observed_medical_data['Treatment']) + (-P_2)*(observed_medical_data['Condition'])*(observed_medical_data['Treatment'])*(1 - observed_medical_data['Treatment'])*(3 - observed_medical_data['Treatment'])
    dfs = pd.DataFrame(observed_medical_data)
    dfs.to_csv(name, index=False)
    return pd.DataFrame(observed_medical_data)

medical_data = create_observed_medical_data(unobserved_data, 'patients_database.csv')
生成异常数据:
num_samples = 1
original_vision = np.random.uniform(0.4, 0.6, size=num_samples)
def generate_specific_patient_data(num_samples):
    return create_observed_medical_data({


    'N_T': np.full((num_samples,), 2),
    'N_C': bernoulli.rvs(1, size=num_samples),
    'N_vision': original_vision,
})

specific_patient_data = generate_specific_patient_data(num_samples, "newly_come_patients")
0x03. 读取正常数据
我们有一个由三个观察变量组成的数据库:一个从0到1的连续变量,表示视力质量(“Vision”),一个二元变量,表示患者是否患有罕见疾病(即过敏)(“condition”),以及一个类别变量(“Treatment”),可以取三个值(0:“什么都不做”,1:“选项1”或2:“选项2”)。数据如下:
import pandas as pd

medical_data = pd.read_csv('patients_database.csv')
medical_data.head()
数据如下:
| Condition | Treatment | Vision | |
|---|---|---|---|
| 0 | 0 | 2 | 0.223475 |
| 1 | 0 | 2 | 0.197306 |
| 2 | 0 | 0 | 0.101252 |
| 3 | 0 | 1 | 0.703056 |
| 4 | 0 | 0 | 0.020249 |
medical_data.iloc[0:100].plot(figsize=(15, 10))
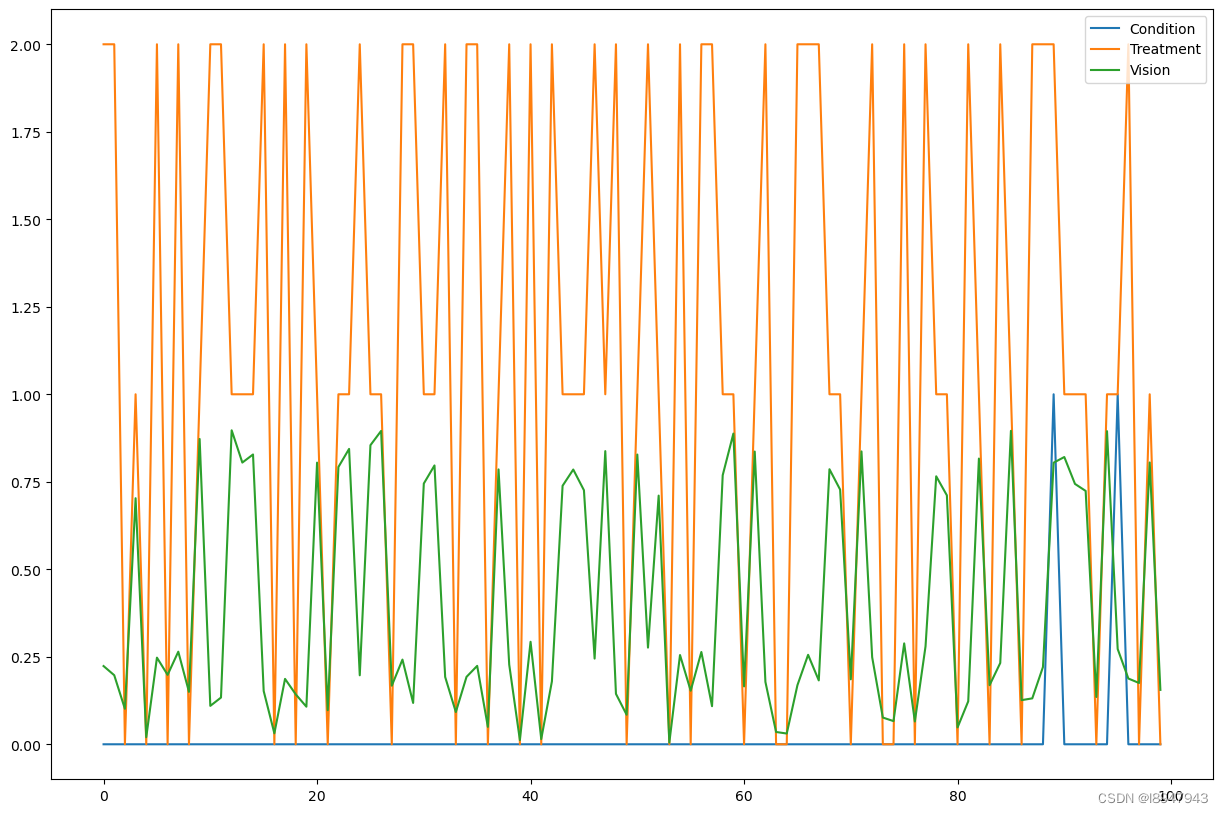
数据集反映了患者在采取三种治疗方案之一后的视力,这是基于他们是否患有罕见疾病。请注意,数据集没有关于治疗前患者原始视力的信息(即vision变量的噪声)。正如我们将在下面看到的,只要我们有后非线性模型(例如ANM),视觉的噪声部分就会被反事实算法恢复。
0x04. 建模
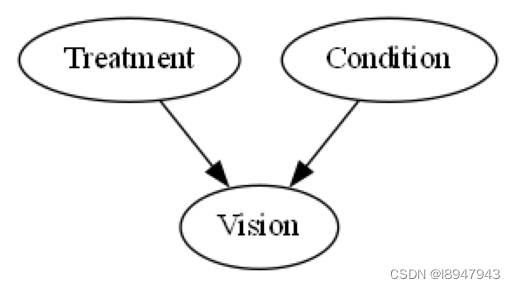
我们知道“治疗”节点和“条件”节点导致了视觉,但我们不知道结构上的因果模型。然而,我们可以从观测数据中了解到它。我们假设这个图表正确地代表了因果关系,并且我们假设没有隐藏的混杂因素(因果充足性)。根据给定的图表和数据,我们可以拟合因果模型,并开始回答反事实的问题。
import networkx as nx
import dowhy.gcm as gcm

causal_model = gcm.InvertibleStructuralCausalModel(nx.DiGraph([('Treatment', 'Vision'), ('Condition', 'Vision')]))
gcm.auto.assign_causal_mechanisms(causal_model, medical_data)

gcm.util.plot(causal_model.graph)

gcm.fit(causal_model, medical_data)
0x05. 读取异常数据
specific_patient_data = pd.read_csv('newly_come_patients.csv')
specific_patient_data.head()
输出如下:
| Condition | Treatment | Vision | |
|---|---|---|---|
| 0 | 1 | 2 | 0.857103 |
0x06. 回答爱丽丝的反事实问题
如果我们想要检查一个假设的结果,如果一个事件没有发生,或者发生的方式不同,我们会使用所谓的基于结构性因果模型的反事实逻辑。考虑到-我们知道爱丽丝的治疗方案是第二种。爱丽丝患有罕见的过敏(条件=1)。治疗方案2后,爱丽丝视力为0.78(视力=0.78)。-我们能够根据学习到的结构因果模型恢复噪声。
如果治疗节点不同,我们现在可以检查她的视觉的反事实结果。在下面,我们来看看如果爱丽丝没有接受任何治疗(治疗=0),如果她服用了其他眼药水(治疗=1),爱丽丝的视力的反事实值。
counterfactual_data1 = gcm.counterfactual_samples(causal_model,
                                                  {

    'Treatment': lambda x: 1},
                                                  observed_data = specific_patient_data)

counterfactual_data2 = gcm.counterfactual_samples(causal_model,
                                                  {

    'Treatment': lambda x: 0},
                                                  observed_data = specific_patient_data)


import matplotlib.pyplot as plt

df_plot2 = pd.DataFrame()
df_plot2['Vision after option 2'] = specific_patient_data['Vision']
df_plot2['Counterfactual vision (option 1)'] = counterfactual_data1['Vision']
df_plot2['Counterfactual vision (No treatment)'] = counterfactual_data2['Vision']

df_plot2.plot.bar(title="Counterfactual outputs")
plt.xlabel('Alice')
plt.ylabel('Eyesight quality')
plt.legend()
效果如下:
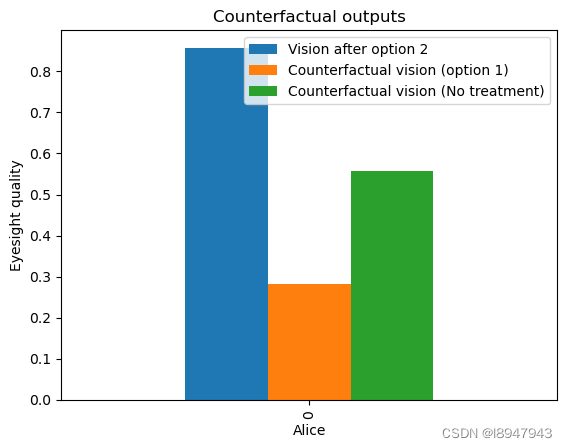
我们在这里看到的是,如果Alice选择了选项1,她的视力会比选项2更差。因此,她意识到她在病史中报告的罕见情况(条件=1)可能会导致对流行选项1的过敏反应。爱丽丝还可以看到,如果她没有选择任何推荐的选项,她的视力会比她选择的选项2更差(变量Vision导致的相对值更小)。