环境:openvino22.01、tensorflow2.5
1、分类
测试模型下载
omz_downloader --name mobilenet-v3-small-1.0-224-tf
模型转换
omz_converter --name mobilenet-v3-small-1.0-224-tf生成模型

测试:
import cv2
import matplotlib
import matplotlib.pyplot as plt
import numpy as np
from openvino.runtime import Core

matplotlib.use('TkAgg')
ie = Core()
model = ie.read_model(model="model/mobilenet-v3-small-1.0-224-tf/FP16/mobilenet-v3-small-1.0-224-tf.xml")
compiled_model = ie.compile_model(model=model, device_name="CPU")

output_layer = compiled_model.output(0)
# The MobileNet model expects images in RGB format.
image = cv2.cvtColor(cv2.imread(filename="data/dog.jpg"), code=cv2.COLOR_BGR2RGB)

# Resize to MobileNet image shape.
input_image = cv2.resize(src=image, dsize=(224, 224))

# Reshape to model input shape.
input_image = np.expand_dims(input_image, 0)
# plt.imshow(image)
# plt.show()

result_infer = compiled_model([input_image])[output_layer]
result_index = np.argmax(result_infer)
# Convert the inference result to a class name.
imagenet_classes = open("data/imagenet_2012.txt").read().splitlines()

# The model description states that for this model, class 0 is a background.
# Therefore, a background must be added at the beginning of imagenet_classes.
imagenet_classes = ['background'] + imagenet_classes

print("predict:",imagenet_classes[result_index])
输出结果
predict: n02099601 golden retriever2、分割
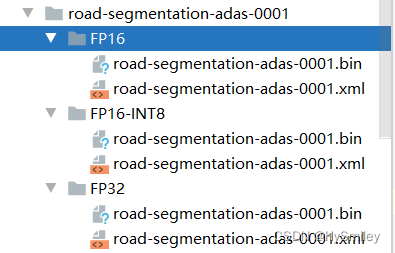
下载模型
omz_downloader --name road-segmentation-adas-0001
测试
import cv2
import matplotlib.pyplot as plt
import numpy as np
import sys
from openvino.runtime import Core
import matplotlib
matplotlib.use('TkAgg')
# sys.path.append("../utils")
# from notebook_utils import segmentation_map_to_image
def segmentation_map_to_image(
result: np.ndarray, colormap: np.ndarray, remove_holes: bool = False
) -> np.ndarray:
"""
Convert network result of floating point numbers to an RGB image with
integer values from 0-255 by applying a colormap.
:param result: A single network result after converting to pixel values in H,W or 1,H,W shape.
:param colormap: A numpy array of shape (num_classes, 3) with an RGB value per class.
:param remove_holes: If True, remove holes in the segmentation result.
:return: An RGB image where each pixel is an int8 value according to colormap.
"""
if len(result.shape) != 2 and result.shape[0] != 1:
raise ValueError(
f"Expected result with shape (H,W) or (1,H,W), got result with shape {result.shape}"
)
if len(np.unique(result)) > colormap.shape[0]:
raise ValueError(
f"Expected max {colormap[0]} classes in result, got {len(np.unique(result))} "
"different output values. Please make sure to convert the network output to "
"pixel values before calling this function."
)
elif result.shape[0] == 1:
result = result.squeeze(0)
result = result.astype(np.uint8)
contour_mode = cv2.RETR_EXTERNAL if remove_holes else cv2.RETR_TREE
mask = np.zeros((result.shape[0], result.shape[1], 3), dtype=np.uint8)
for label_index, color in enumerate(colormap):
label_index_map = result == label_index
label_index_map = label_index_map.astype(np.uint8) * 255
contours, hierarchies = cv2.findContours(
label_index_map, contour_mode, cv2.CHAIN_APPROX_SIMPLE
)
cv2.drawContours(
mask,
contours,
contourIdx=-1,
color=color.tolist(),
thickness=cv2.FILLED,
)
return mask
ie = Core()
model = ie.read_model(model="model/road-segmentation-adas-0001/FP16/road-segmentation-adas-0001.xml")
compiled_model = ie.compile_model(model=model, device_name="CPU")
input_layer_ir = compiled_model.input(0)
output_layer_ir = compiled_model.output(0)
# The segmentation network expects images in BGR format.
image = cv2.imread("data/empty_road_mapillary.png")
rgb_image = cv2.cvtColor(image, cv2.COLOR_BGR2RGB)
image_h, image_w, _ = image.shape
# N,C,H,W = batch size, number of channels, height, width.
N, C, H, W = input_layer_ir.shape
# OpenCV resize expects the destination size as (width, height).
resized_image = cv2.resize(image, (W, H))
# Reshape to the network input shape.
input_image = np.expand_dims(
resized_image.transpose(2, 0, 1), 0
)
plt.imshow(rgb_image)
# Run the inference.
result = compiled_model([input_image])[output_layer_ir]
# Prepare data for visualization.
segmentation_mask = np.argmax(result, axis=1)
plt.imshow(segmentation_mask.transpose(1, 2, 0))
# Define colormap, each color represents a class.
colormap = np.array([[68, 1, 84], [48, 103, 141], [53, 183, 120], [199, 216, 52]])
# Define the transparency of the segmentation mask on the photo.
alpha = 0.3
# Use function from notebook_utils.py to transform mask to an RGB image.
mask = segmentation_map_to_image(segmentation_mask, colormap)
resized_mask = cv2.resize(mask, (image_w, image_h))
# Create an image with mask.
image_with_mask = cv2.addWeighted(resized_mask, alpha, rgb_image, 1 - alpha, 0)
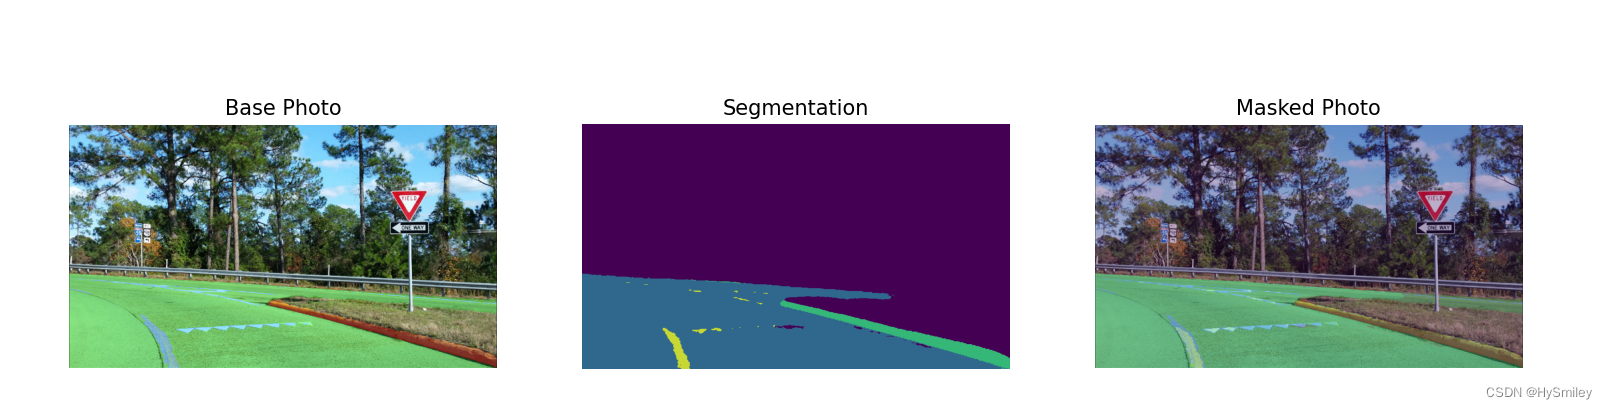
# Define titles with images.
data = {"Base Photo": rgb_image, "Segmentation": mask, "Masked Photo": image_with_mask}
# Create a subplot to visualize images.
fig, axs = plt.subplots(1, len(data.items()), figsize=(15, 10))
# Fill the subplot.
for ax, (name, image) in zip(axs, data.items()):
ax.axis('off')
ax.set_title(name)
ax.imshow(image)
# Display an image.
plt.show()
输出结果
3、检测(水平-文本检测)
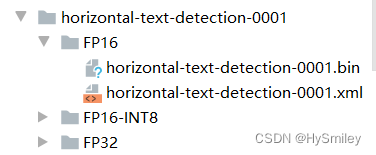
模型下载
omz_downloader --name horizontal-text-detection-0001
测试
import cv2
import matplotlib.pyplot as plt
import numpy as np
from openvino.runtime import Core

import matplotlib
matplotlib.use('TkAgg')

ie = Core()

model = ie.read_model(model="model/horizontal-text-detection-0001/FP16/horizontal-text-detection-0001.xml")
compiled_model = ie.compile_model(model=model, device_name="CPU")

input_layer_ir = compiled_model.input(0)
output_layer_ir = compiled_model.output("boxes")

# Text detection models expect an image in BGR format.
image = cv2.imread("data/test.jpg")

# N,C,H,W = batch size, number of channels, height, width.
N, C, H, W = input_layer_ir.shape

# Resize the image to meet network expected input sizes.
resized_image = cv2.resize(image, (W, H))

# Reshape to the network input shape.
input_image = np.expand_dims(resized_image.transpose(2, 0, 1), 0)

plt.imshow(cv2.cvtColor(image, cv2.COLOR_BGR2RGB))

# Create an inference request.
boxes = compiled_model([input_image])[output_layer_ir]

# Remove zero only boxes.
boxes = boxes[~np.all(boxes == 0, axis=1)]


# For each detection, the description is in the [x_min, y_min, x_max, y_max, conf] format:
# The image passed here is in BGR format with changed width and height. To display it in colors expected by matplotlib, use cvtColor function
def convert_result_to_image(bgr_image, resized_image, boxes, threshold=0.3, conf_labels=True):
    # Define colors for boxes and descriptions.
    colors = {"red": (255, 0, 0), "green": (0, 255, 0)}

    # Fetch the image shapes to calculate a ratio.
    (real_y, real_x), (resized_y, resized_x) = bgr_image.shape[:2], resized_image.shape[:2]
    ratio_x, ratio_y = real_x / resized_x, real_y / resized_y

    # Convert the base image from BGR to RGB format.
    rgb_image = cv2.cvtColor(bgr_image, cv2.COLOR_BGR2RGB)

    # Iterate through non-zero boxes.
    for box in boxes:
        # Pick a confidence factor from the last place in an array.
        conf = box[-1]
        if conf > threshold:
            # Convert float to int and multiply corner position of each box by x and y ratio.
            # If the bounding box is found at the top of the image,
            # position the upper box bar little lower to make it visible on the image.
            (x_min, y_min, x_max, y_max) = [
                int(max(corner_position * ratio_y, 10)) if idx % 2
                else int(corner_position * ratio_x)
                for idx, corner_position in enumerate(box[:-1])
            ]

            # Draw a box based on the position, parameters in rectangle function are: image, start_point, end_point, color, thickness.
            rgb_image = cv2.rectangle(rgb_image, (x_min, y_min), (x_max, y_max), colors["red"], 3)

            # Add text to the image based on position and confidence.
            # Parameters in text function are: image, text, bottom-left_corner_textfield, font, font_scale, color, thickness, line_type.
            if conf_labels:
                rgb_image = cv2.putText(
                    rgb_image,
                    f"{conf:.2f}",
                    (x_min, y_min - 10),
                    cv2.FONT_HERSHEY_SIMPLEX,
                    0.8,
                    colors["red"],
                    1,
                    cv2.LINE_AA,
                )

    return rgb_image

plt.figure(figsize=(10, 6))
plt.axis("off")
plt.imshow(convert_result_to_image(image, resized_image, boxes, conf_labels=False));
plt.show()
输出
