在 《看完这篇文章,我再也不用担心线上出现CPU性能问题了(上)》中,咸鱼给大家介绍了 CPU 常见的性能指标,当生产环境出现 CPU 性能瓶颈的时候,优先观察这些指标有没有什么异常的地方,能解决大部分情况
但是仅掌握了 CPU 的性能指标还远远不够,我们还需要知道怎么样去获取这些指标,用什么工具去获取
“君子生非异也,善假于物也”,只要掌握一些常见的 CPU 性能工具,我相信处理 CPU 性能问题也就事半功倍了
对于每个工具的使用方法,不需要完全记下使用参数,你只需要知道有哪些工具、以及这些工具的基本功能是什么就足够了
真正要用到的时候,通过 man 手册或者 --help 命令查阅就可以了
平均负载
uptime
看下 man 手册关于 uptime 命令描述
uptime gives a one line display of the following information. The current time, how long the system has been running, how many users are currently logged on, and the system load averages for the past 1, 5, and 15 minutes.
可以看到,uptime 命令可以输出系统过去1分钟、5分钟、15分钟之内的平均负载
我们看一下 uptime 命令的输出,重点关注 load averages
# uptime
10:38:46 up 20 days,  9:25,  1 user,  load average: 0.00, 0.01, 0.05
top
看下 man 手册关于 top 命令的描述
The top program provides a dynamic real-time view of a running system. It can display system summary information as well as a list of processes or threads currently being managed by the Linux kernel. The types of system summary information shown and the types, order and size of information displayed for processes are all user configurable and that configuration can be made per‐sistent across restarts.
The program provides a limited interactive interface for process manipulation as well as a much more extensive interface for personal configuration – encompassing every aspect of its operation. And while top is referred to throughout this document, you are free to name the program anything you wish. That new name, possibly an alias, will then be reflected on top’s display and used when reading and writing a configuration file.
除了 uptime 之外,top 命令也可以显示出系统过去1分钟、5分钟、15分钟之内的平均负载
# top
top - 10:39:56 up 20 days,  9:26,  1 user,  load average: 0.00, 0.01, 0.05
不但如此,top 命令更为强大,能够展示更为全面的性能指标(例如 CPU 使用率、进程数等等)
CPU 使用率
top
top 命令是 Linux 下常用的性能分析工具,能够实时显示系统中各个进程的资源占用状况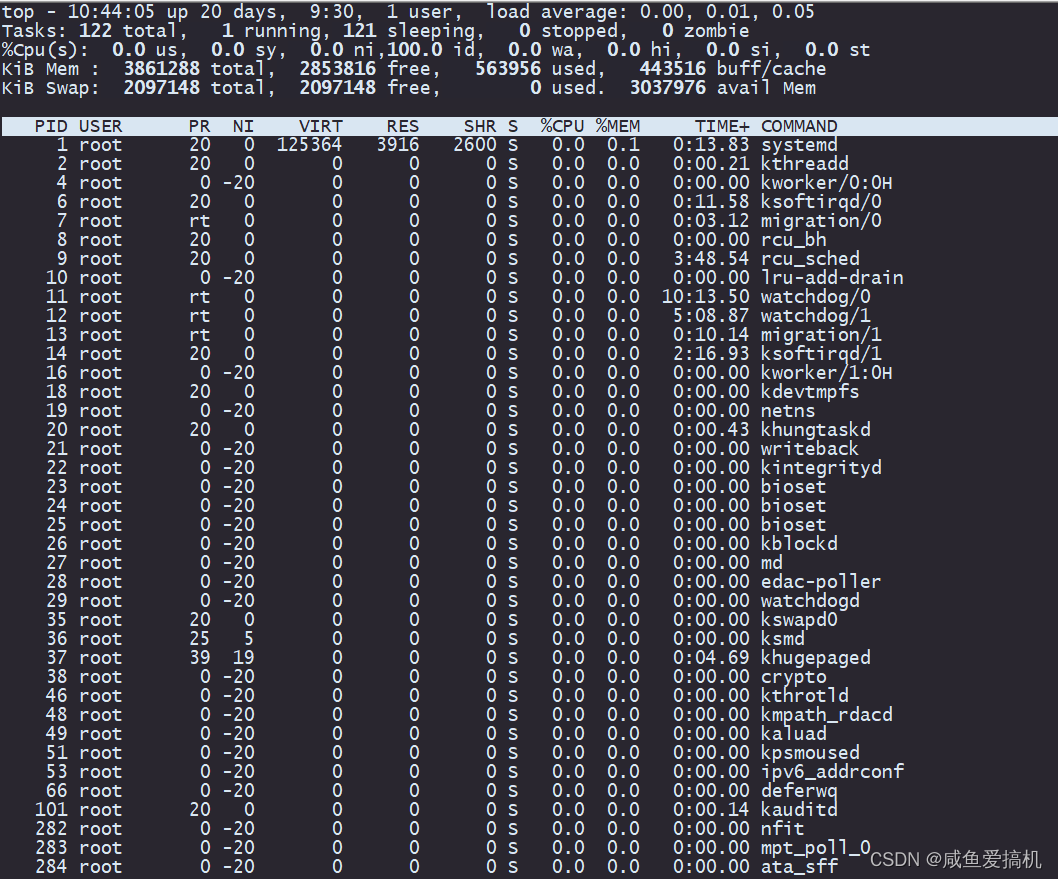
我们可以将输出内容分成两部分:
第一部分:(系统资源的整体使用情况)

我们直接来看第三行,第三行内容是系统整体 CPU 使用率
%Cpu(s): 0.0 us, 0.0 sy, 0.0 ni,100.0 id, 0.0 wa, 0.0 hi, 0.0 si, 0.0 st
从左到右依次是:用户 CPU 使用率、系统 CPU 使用率、低优先级用户 CPU 使用率、空闲 CPU 使用率、等待 I/O CPU 使用率、硬中断 CPU 使用率、软中断 CPU 使用率、系统被其他虚拟机占用的 CPU 使用率
第二部分:各进程 CPU 使用率
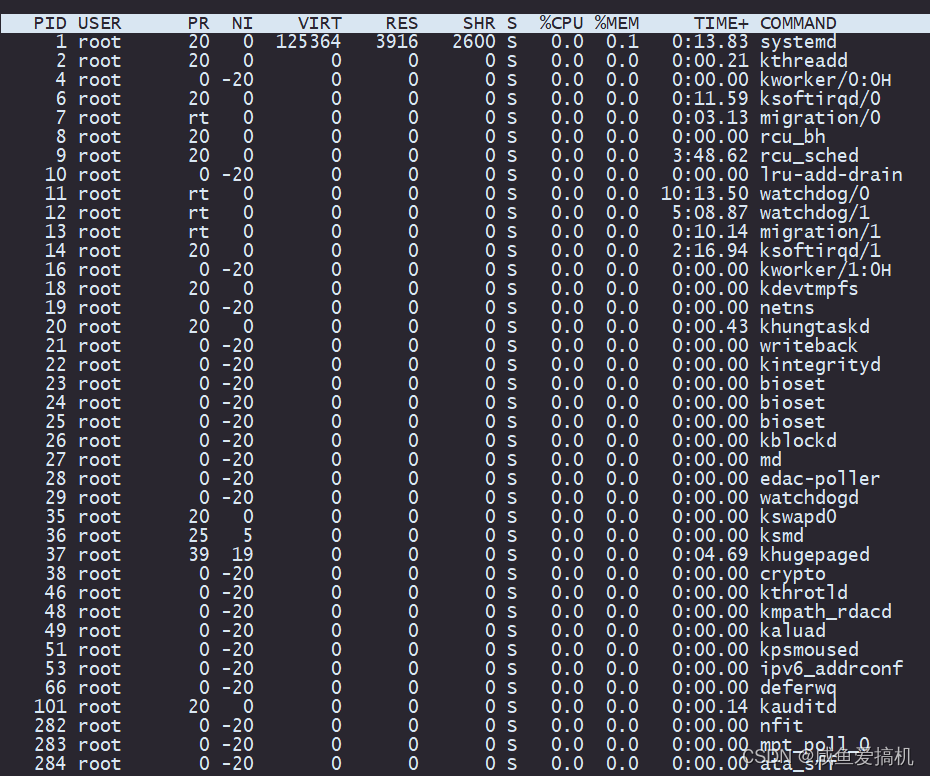
通过 top 命令,我们就能观察到系统整体 CPU 使用率以及各个进程的 CPU 使用率
mpstat
mpstat 是 sysstat 工具的一个命令
man 手册关于 mpstat 命令的描述
   The  mpstat  command writes to standard output activities for each available processor, processor 0 being the first one.  Global
   average activities among all processors are also reported.  The mpstat command can be used both on SMP and UP machines,  but  in
   the latter, only global average activities will be printed. If no activity has been selected, then the default report is the CPU utilization report
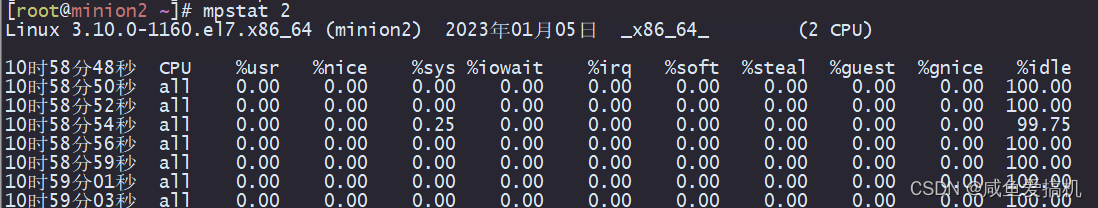
mpstat 是一个常用的多核 CPU 性能分析工具,用来实时查看每个 CPU 的性能指标,以及所有 CPU 的平均指标
mpstat 显示的信息存放在 /proc/stat 中
关于 mpstat 的详细使用,可以参考 man 手册
man mpstat
例子:每两秒更新一次
pidstat
pidstat是sysstat工具的一个命令
man 手册关于 pidstat 命令的描述
The pidstat command is used for monitoring individual tasks currently being managed by the Linux kernel. It writes to standard
output activities for every task selected with option -p or for every task managed by the Linux kernel if option -p ALL has been
used. Not selecting any tasks is equivalent to specifying -p ALL but only active tasks (tasks with non-zero statistics values)
will appear in the report.The pidstat command can also be used for monitoring the child processes of selected tasks. Read about option -T below.
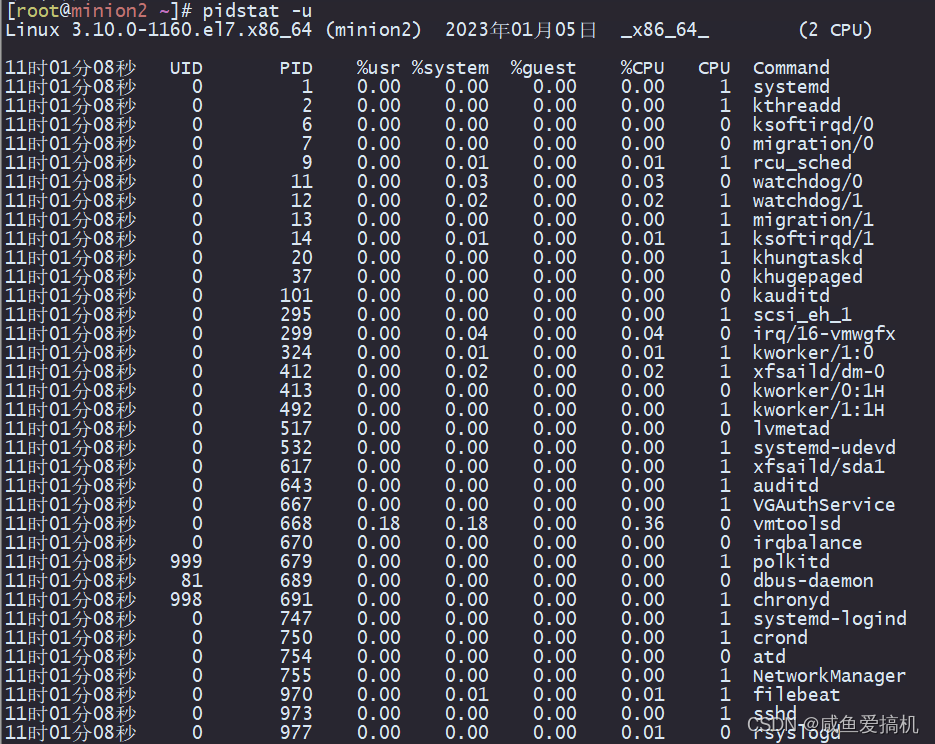
pidstat 是一个常用的进程性能分析工具,用来实时查看进程的 CPU、内存、I/O 以及上下文切换等性能指标
关于 pidstat 的详细使用,可以参考 man 手册
man pidstat
例子:每两秒更新一次(cpu使用情况统计)
进程上下文切换
我们可以使用 vmstat 这个工具,来查询系统的上下文切换情况
vmstat
man 手册关于vmstat 命令的描述
vmstat reports information about processes, memory, paging, block IO, traps, disks and cpu activity.
The first report produced gives averages since the last reboot. Additional reports give information on a sampling period of
length delay. The process and memory reports are instantaneous in either case
vmstat 是一个常用的系统性能分析工具,主要用来分析系统的内存使用情况,也常用来分析 CPU 上下文切换和中断的次数
比如,下面就是一个 vmstat 的使用示例:
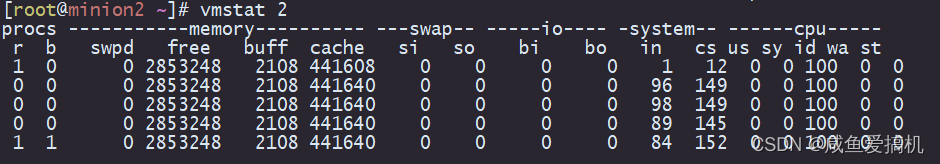
我们来着重看一下其中四列的含义:
- cs(context switch)是每秒上下文切换的次数
- in(interrupt)则是每秒中断的次数
- r(Running or Runnable)是就绪队列的长度,也就是正在运行和等待 CPU 的进程数
- b(Blocked)则是处于不可中断睡眠状态的进程数。
pidstat
vmstat 只给出了系统总体的上下文切换情况
要想查看每个进程的详细情况,就需要使用到上面介绍过的 pidstat,加上 -w 选项,就可以查看每个进程上下文切换的情况了
举个例子:
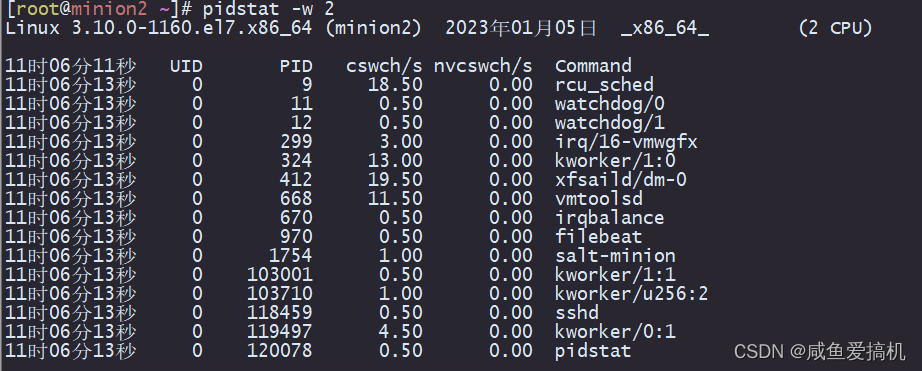
输出内容里面我们需要着重关注两列:
- cswch:表示每秒自愿上下文切换(voluntary context switches)的次数
- nvcswch:表示每秒非自愿上下文切换(non voluntary context switches)的次数
什么是自愿上下文切换什么是非自愿上下文切换呢?
自愿上下文切换,是指进程无法获取所需资源而导致的上下文切换,比如说进程所需内存不足时发生的上下文切换
非自愿上下文切换,则是指进程由于 CPU 分配的时间片已到等原因,被系统强制调度等导致的上下文切换,比如说大量进程在抢夺 CPU,就很容易发生非自愿上下文切换
补充
除了上面的性能工具,我再补充几个
dstat
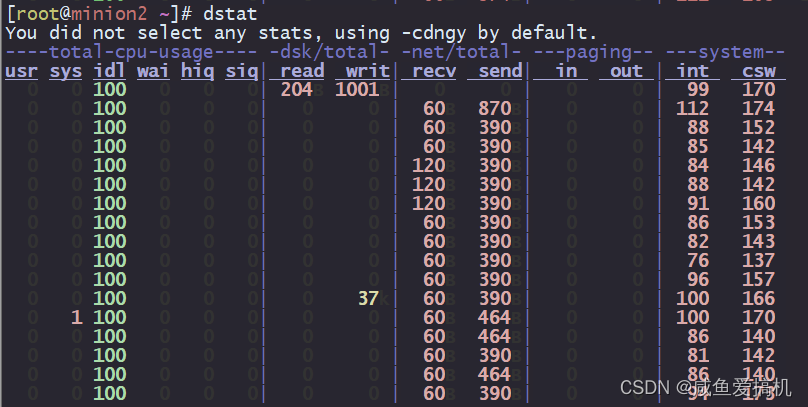
dstat 是一个可以取代 vmstat,iostat,netstat 和 ifstat 这些命令的多功能产品
man 手册关于dstat 命令的描述
Dstat is a versatile replacement for vmstat, iostat and ifstat. Dstat overcomes some of the limitations and adds some extra features.
Dstat allows you to view all of your system resources instantly, you can eg. compare disk usage in combination with interrupts from your IDE controller, or compare the network bandwidth numbers directly with the disk throughput (in the same interval).
Dstat also cleverly gives you the most detailed information in columns and clearly indicates in what magnitude and unit the output is displayed. Less confusion, less mistakes, more efficient.
Dstat is unique in letting you aggregate block device throughput for a certain diskset or network bandwidth for a group of interfaces, ie. you can see the throughput for all the block devices that make up a single filesystem or storage system.
Dstat allows its data to be directly written to a CSV file to be imported and used by OpenOffice, Gnumeric or Excel to create graphs
dstat 可以让你实时地看到所有系统资源,以列表的形式展现
#安装 dstat
yum install -y dstat
举个例子:
perf top
首先来介绍一下 perf
perf 是Linux的一款性能分析工具。它以性能事件采样为基础,不仅可以分析系统的各种事件和内核性能,还可以用来分析指定应用程序的性能问题
#安装
yum install -y perf
perf top 类似于 top,但与 top 不同的是 perf top 能够实时显示占用 CPU 时钟最多的函数或者指令
man 手册关于perf top 命令的描述
This command generates and displays a performance counter profile in real time
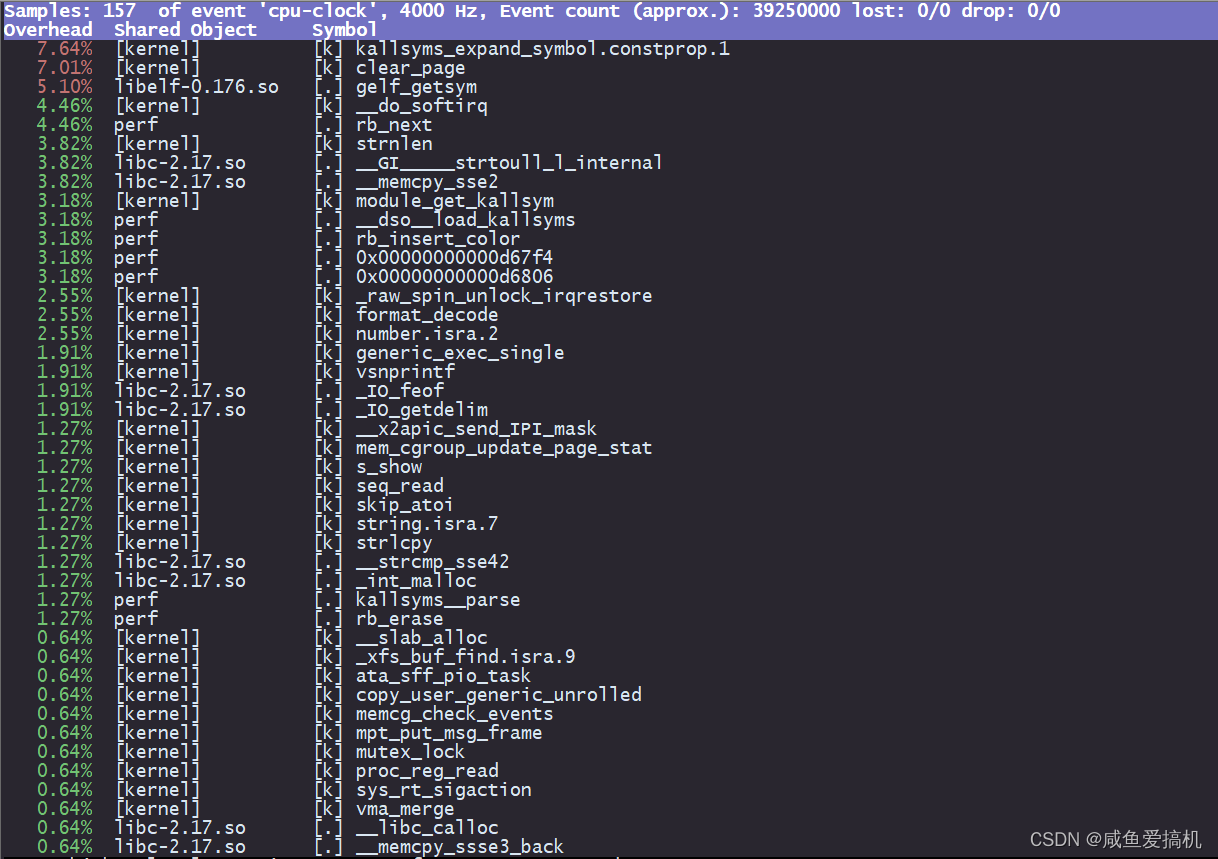
我们先看第一行,从左到右依次是:
- Samples:采样数
- event:事件类型
- Event count:事件总数
再往下看是一个表格样式的数据,每一行有四列,分别是:
- Overhead:表示该函数的性能事件在所有采样中的比例,用百分比来表示
- Shared:表示该函数或者命令所在的动态共享对象(Dynamic Shared Object),如内核、进程名、动态链接库名,内核模块名等
- Object:表示动态共享对象的类型。比如 [.] 表示用户空间的可执行程序、或者动态链接库,而 [k] 则表示内核空间
- Symbol:符号名,也就是函数名。当函数名未知时,用十六进制的地址来表示
perf record & perf report
perf top 虽然实时展示了系统的性能信息,但它的缺点是并不保存数据,也就无法用于离线或者后续的分析。
而 perf record 则提供了保存数据的功能,保存后的数据,需要你用 perf report 解析展示
man 手册关于perf record 命令的描述
This command runs a command and gathers a performance counter profile from it, into perf.data - without displaying anything.
This file can then be inspected later on, using perf report
# perf record(然后按Ctrl+C终止采样)
^C[ perf record: Woken up 1 times to write data ]
[ perf record: Captured and wrote 0.472 MB perf.data (2641 samples) ]

# perf report
sar
sar 命令是一个很强大,分析系统性能的重要工具之一,通过该命令可以全面地获取系统的 CPU、运行队列、磁盘读写(I/O)、分区(交换区)、内存、CPU 中断和网络等性能数据
#安装
yum install -y sysstat
总结
本篇文章介绍了一些常用的 CPU 性能观察工具,不知道你们是不是跟我一样,看到这里已经快晕了
这么多性能工具,该怎么区分?在什么场景下用?如何将多种工具结合起来?
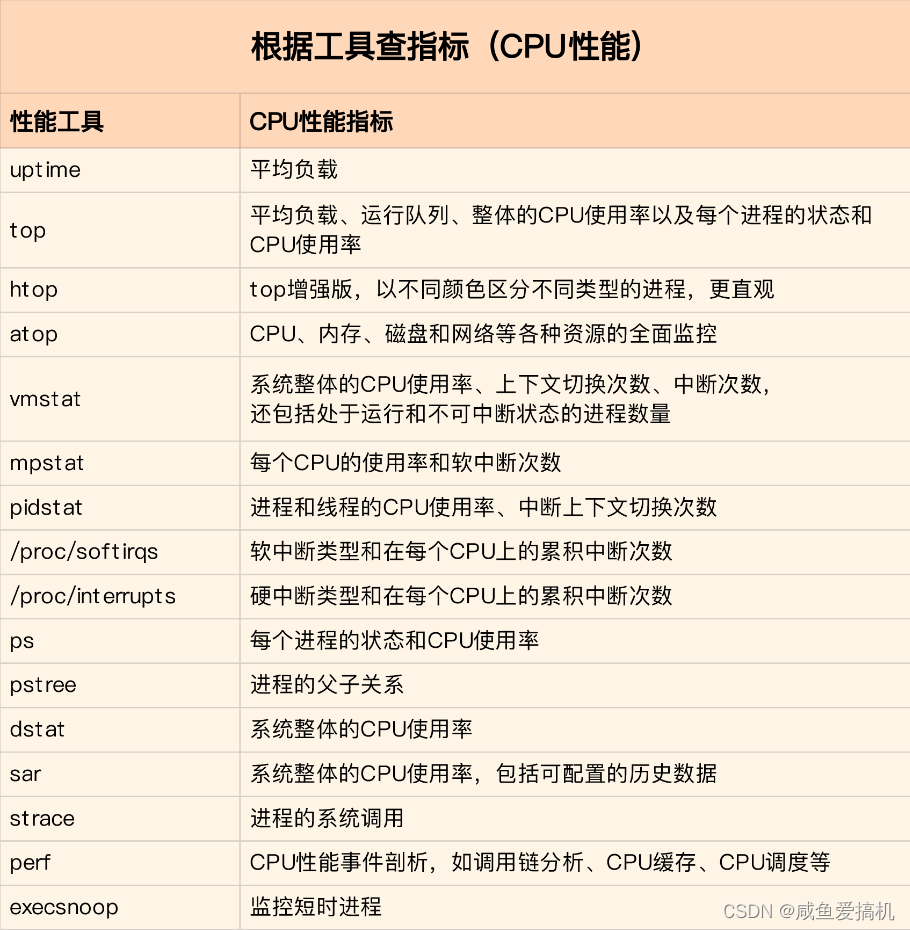
第一,掌握哪些工具能够观察具体性能指标
当你想要查看某个性能指标时,要清楚哪些工具可以做到
举个例子:
当你想要观察系统平均负载的时候就会想到用 uptime 命令;当你想要看系统整体的一些资源使用情况的时候你就会想到用 top 命令;当你想要观察某一进程的资源使用情况的时候你就会想到用mpstat、sar 等命令
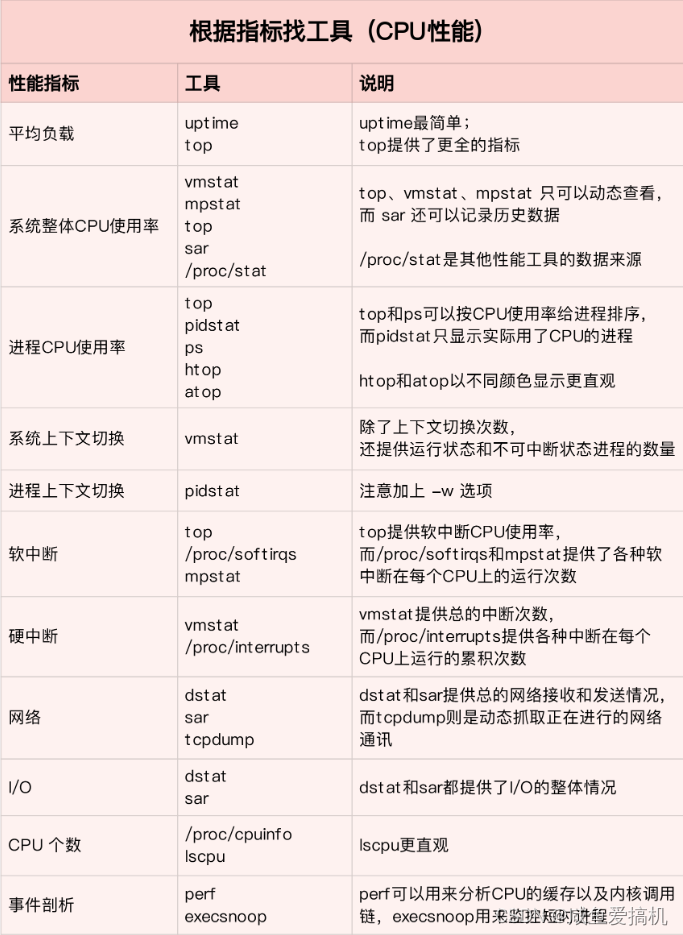
根据想要观察的性能指标来挑选性能工具,这样在实际排查的时候你就可以清楚知道,什么工具可以提供你想要的指标,而不是毫无根据地挨个尝试,撞运气
为此我搬运了倪鹏飞老师课程里面的图片,分享给大家
第二,掌握常见性能工具的适用场景以及使用方法
不需要要求你把工具的所有参数以及配置选项给背下来,你只需要知道你现在拥有的这些工具的基本功能是什么、适用于哪些场景就行了
等你具体使用的时候,通过查询 man 手册或者 --help 命令就行了
这在实际生产环境中是非常重要的,因为大部分情况下你并没有权限安装新的工具包,生产环境下的机器很多都是在内网中,你只能最大化的利用现有的工具