Approximate Cross Channel Color Mapping from Sparse Color Correspondences
本文提出了一种颜色映射方法,它可以补偿具有共同语义内容的图像之间的颜色差异,例如从不同视点拍摄的场景的多个视图。
颜色映射模型可以通过 点的匹配 作为前提。
本文将颜色映射分为两个步骤:第一,非线性各通道映射,比如gamma;第二,线性跨通道映射, 比ccm。此外,该方法从稀疏匹配中估计模型,并且不需要密集的几何对应,并显示出良好的性能。
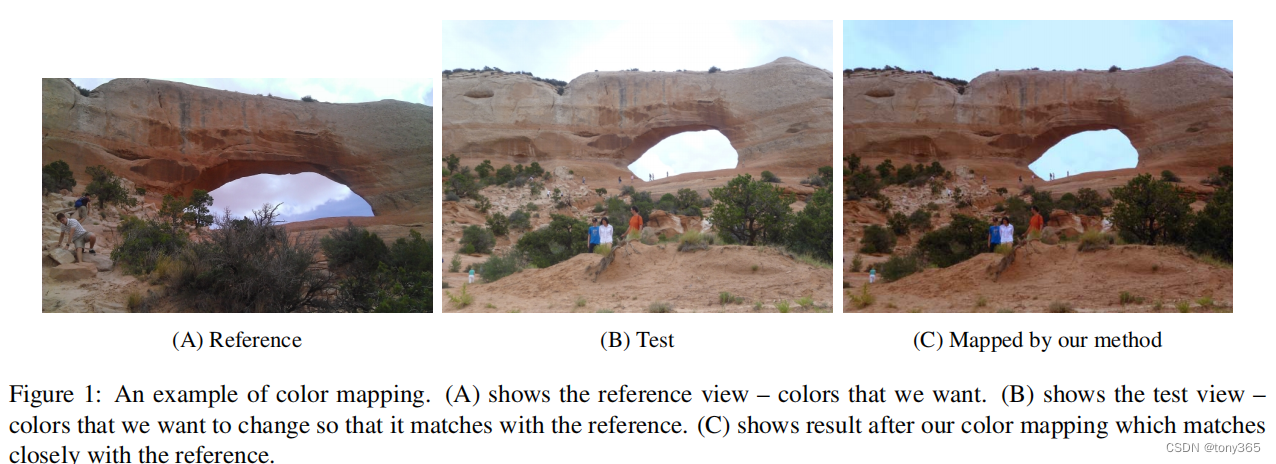
一个典型的应用效果:
原理
如图:
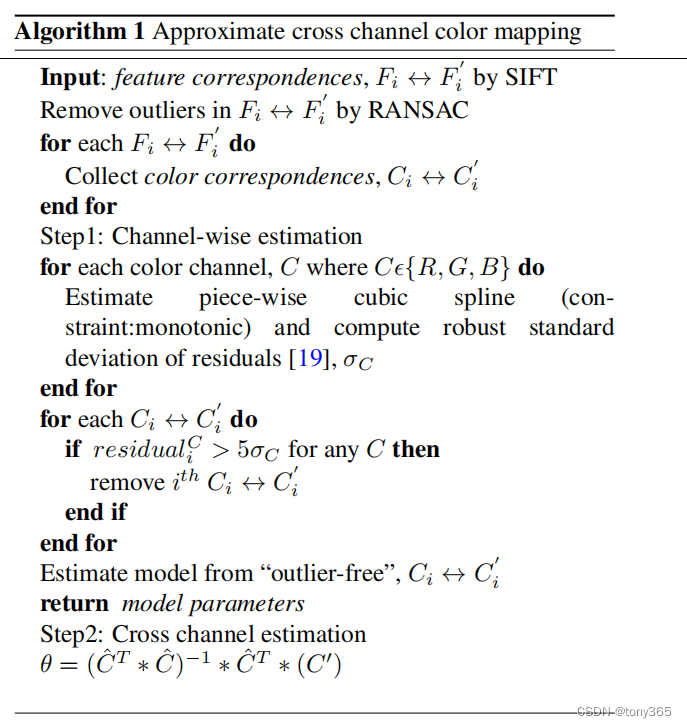
1) 找到特征点
收集特征点附近的颜色。如何对应呢?patch match?
2)各通道非线性拟合(利用HMM方法得到一个lut 或者 拟合一个方程,应该差不多)
3)求ccm
代码(未完善,效果不是很好)
import math
import os

import cv2
import cv2 as cv
import numpy as np
from numpy import linalg, random
from scipy.interpolate import griddata, Rbf

import matplotlib.pyplot as plt
from scipy.optimize import leastsq, least_squares, minimize
from scipy.signal import savgol_filter


def detect_and_match(im1, im2):
    '''
    :param im1: BGR uint8 image
    :param im2: BGR uint8 image
    :return: matched keypoints
    '''
    print('detect keypoints:\n')
    sift = cv.SIFT_create()
    gray1 = cv.cvtColor(im1, cv.COLOR_BGR2GRAY)
    kp1, ds1 = sift.detectAndCompute(gray1, None)
    gray2 = cv.cvtColor(im2, cv.COLOR_BGR2GRAY)
    kp2, ds2 = sift.detectAndCompute(gray2, None)
    print('    point and dsc number', np.array(kp1).shape, np.array(ds1).shape, np.array(kp2).shape, np.array(ds2).shape)


    print('match keypoints:\n')
    FLANN_INDEX_KDTREE = 1
    index_params = dict(algorithm=FLANN_INDEX_KDTREE, trees=5)
    search_params = dict(checks=50)
    flann = cv.FlannBasedMatcher(index_params, search_params)
    matches = flann.knnMatch(ds1, ds2, k=2) # k=2:为每个点找到最佳的两个匹配
    # print(type(matches), len(matches), type(matches[0]), len(matches[0]))
    # print(matches[0][0], matches[0][0].queryIdx, matches[0][0].trainIdx, matches[0][0].distance, )
    # print(matches[0][1], matches[0][1].queryIdx, matches[0][1].trainIdx, matches[0][1].distance, )
    # store all the good matches as per Lowe's ratio test
    good = []
    for m, n in matches:
        if m.distance < 0.8 * n.distance: # 第一距离足够小
            good.append([m.queryIdx, m.trainIdx])

    srcpoints = np.float32([kp1[m[0]].pt for m in good])
    dstpoints = np.float32([kp2[m[1]].pt for m in good])
    print('    good matches number:', srcpoints.shape)
    return srcpoints, dstpoints

def cal_homography(srcpoints, dstpoints):
    '''
    :param srcpoints: n * 2 (x, y) points np.float32
    :param dstpoints: n * 2 (x, y) points np.float32
    :return:
    '''
    H, status = cv2.findHomography(srcpoints, dstpoints, cv2.RANSAC)
    print('opencv H:\n', H, np.sum(status))
    return H, status

def draw_matches(im1, im2, kp1, kp2, inliners=None):
    '''
    展示 ransac 前后的匹配点
    :param im1:
    :param im2:
    :param p1: p1 和 p2是匹配点
    :param p2:
    :param inliners: 过滤后的匹配索引, inliners red, outliers green
    :return:
    '''
    out = np.hstack((im1, im2))
    h, w, c = im1.shape

    p1 = kp1.copy().astype(np.int32)
    p2 = kp2.copy().astype(np.int32)
    # Draw a small circle at both co-ordinates
    for i in range(len(p1)):
        cv2.circle(out, p1[i], 4, (255, 0, 0), 1)
        cv2.circle(out, p2[i] + (w, 0), 4, (255, 0, 0), 1)
    for i in range(len(p1)):
        if inliners is not None and inliners[i]:
            cv2.line(out, p1[i], p2[i] + (w, 0), (0, 0, 255), 1)
        else:
            cv2.line(out, p1[i], p2[i] + (w, 0), (0, 255, 0), 1)
    return out

def cell(m, n=None): # mat
    a = []
    for i in range(m):
        a.append([])
        if n is None:
            for j in range(m):
                a[i].append(None)
        else:
            for j in range(n):
                a[i].append(None)
    return a

def cal_hist(img):
    '''

    :param img: single channel image
    :return: hist
    '''
    hist, hist_edge = np.histogram(img, bins=256, range=[0, 256])
    # for i in range(256):
    #     hist[i] = np.count_nonzero(img==i)
    # print(hist_edge)
    return hist
def cal_cum_hist(hist):
    cum_hist = np.zeros_like(hist)
    for i in np.arange(1, 256):
        cum_hist[i] = cum_hist[i-1] + hist[i]
    return cum_hist
def cal_noisy_index(hist1, h1, w1):
    '''找出 噪声的 index,这些值需要重新插值'''
    ts = [] # remove noise index

    sort_index = np.argsort(hist1)
    #print('sort value:', hist1[sort_index])
    s = 0
    for i in range(len(sort_index)):
        t = sort_index[i]
        s += hist1[t]
        if s < 0.05 * (h1 * w1):
            ts.append(t)
    #print('ts num:', len(ts))
    return ts
def cal_hist_map(img, tgt_img):
    h1, w1 = img.shape
    h2, w2 = tgt_img.shape

    hist1 = cal_hist(img)
    cum_hist1 = cal_cum_hist(hist1)

    hist2 = cal_hist(tgt_img)
    cum_hist2 = cal_cum_hist(hist2)

    lut1 = 255 * cum_hist1 / (h1 * w1)
    lut1 = (lut1 + 0.5).astype(np.uint8)
    lut2 = 255 * cum_hist2 / (h2 * w2)
    lut2 = (lut2 + 0.5).astype(np.uint8)

    # print('lut2:', lut2)
    lut_invert = np.ones_like(lut2) * -1
    for i in range(0, 256):
        i = 255 - i # lut2[i]可能对应很多重复的i, 赋值为第一个。
        lut_invert[lut2[i]] = i
    # lut_invert 可能会有一些空缺点, 通过插值填充。
    if lut_invert[0] == -1:
        lut_invert[0] = lut_invert.min()
    if lut_invert[255] == -1:
        lut_invert[255] = lut_invert.max()
    xx = []
    yy = []
    xxx = []
    for i in range(0, 256):
        if lut_invert[i] != -1:
            xx.append(i)
            yy.append(lut_invert[i])
        else:
            xxx.append(i)
    lut_invert[lut_invert == -1] = np.interp(xxx, xx, yy)
    # 通过插值填充 或这 直接赋值
    # for i in range(1, 256):
    #     if lut_invert[i] == -1:
    #         lut_invert[i] = lut_invert[i-1]

    lut = np.zeros_like(lut1)
    for i in range(256):
        lut[i] = lut_invert[lut1[i]]

    # min_val = tgt_img.min()
    # max_val = tgt_img.max()
    # lut = np.clip(lut, min_val, max_val)


    '''找出 噪声的 index,这些值需要重新插值'''
    ts = cal_noisy_index(hist1, h1, w1)
    ts += cal_noisy_index(hist2, h2, w2)
    ts = np.unique(ts)

    xx = []
    yy = []
    xx.append(0)
    yy.append(lut[0]) # xx, yy的选择也很重要, 可以设为0
    lut_ret = lut.copy()
    for i in range(1, 255):
        if i not in ts:
            xx.append(i)
            yy.append(lut[i])
    xx.append(255)
    yy.append(lut[-1])  # xx, yy的选择也很重要, 也可以设为255看下效果

    lut_ret[ts] = np.interp(ts, xx, yy )
    lut_ret2 = (np.array(lut_ret).astype(np.int16) + np.array(lut)) / 2 + 0.5
    lut_ret = lut_ret.astype(np.uint8)
    # for i in range(len(lut)):
    #     print(lut[i], lut_ret[i])
    plt.figure()
    x = range(256)
    plt.title('origin lut and interp lut')
    plt.plot(x, lut, 'r.', x, lut_ret, 'b-', x, ((lut_ret.astype(np.int16) + lut) / 2), 'y')
    plt.show()
    # smooth with savgol_filter
    lut_ret = savgol_filter(lut_ret, 15, 1)

    out = lut_ret[img]

    return out, lut_ret, xx, yy
if __name__ == "__main__":
    file1 = r'D:\code_color\lut-ccm\data\Snipaste_2023-03-11_12-07-24.png'
    file2 = r'D:\code_color\lut-ccm\data\Snipaste_2023-03-11_12-07-19.png' # 效果不错

    file1 = r'D:\code_color\lut-ccm\data\Snipaste_2023-03-11_13-11-38.png'
    file2 = r'D:\code_color\lut-ccm\data\Snipaste_2023-03-11_13-11-32.png'

    file1 = r'D:\code_color\lut-ccm\data\Snipaste_2023-03-11_13-11-06.png'
    file2 = r'D:\code_color\lut-ccm\data\Snipaste_2023-03-11_13-11-15.png'

    im1 = cv2.imread(file1, 1)[..., ::-1]
    im2 = cv2.imread(file2, 1)[..., ::-1]
    h, w, c = im1.shape
    im2 = cv2.resize(im2, (w, h))
    print(im1.shape, im2.shape)

    # 1. 特征点检测和匹配
    p1, p2 = detect_and_match(im1, im2)
    H, status = cv2.findHomography(p1, p2, cv2.RANSAC, 120)
    print('opencv H:\n', H, np.sum(status) , status.shape)
    status = status.reshape(-1)
    p3, p4 = p1[status==1], p2[status==1]

    pic = draw_matches(im1, im2, p1, p2, inliners=status)
    plt.figure()
    plt.imshow(pic)
    plt.show()

    # 2. channel wise correct
    img1 = im1.copy()
    img2 = im2.copy()

    out1, lut0, xx0, yy0 = cal_hist_map(img1[..., 0], img2[..., 0])
    out2, lut1, xx1, yy1 = cal_hist_map(img1[..., 1], img2[..., 1])
    out3, lut2, xx2, yy2 = cal_hist_map(img1[..., 2], img2[..., 2])

    print(out2.shape, out2.dtype, out2.min(), out2.max())
    img1_hist = cv2.merge([out1,out2, out3])
    img1_hist = np.clip(img1_hist+0.5, 0, 255).astype(np.uint8)
    plt.figure()
    plt.imshow(np.hstack((img1, img2, img1_hist)))
    plt.show()

    # 3. ccm
    print(p1.shape, p3.shape)
    p1_int = np.round(p3).astype(np.int16)
    p2_int = np.round(p4).astype(np.int16)
    x1, y1 = p1_int[..., 0], p1_int[..., 1]
    x2, y2 = p2_int[..., 0], p2_int[..., 1]
    print(img1[y1, x1].shape, img2[y2, x2].shape)

    v1 = img1[y1, x1]
    v1_h = img1_hist[y1, x1]
    v2 = img2[y2, x2]
    # solve v1 @ x =v2
    def cal_ccm(raw_rgb, linear_srgb):
        return (np.linalg.inv(raw_rgb.T @ raw_rgb)) @ (raw_rgb.T @ linear_srgb)


    ccm = cal_ccm(v1.reshape(-1, 3)/ 255, v2.reshape(-1, 3)/ 255)
    ccm = ccm / np.sum(ccm, 0)
    print('ccm:', ccm)
    img1_ccm = (img1.reshape(-1, 3) @ ccm).reshape(h, w, c)

    ccm = cal_ccm(v1_h.reshape(-1, 3)/255, v2.reshape(-1, 3)/255)
    ccm = ccm / np.sum(ccm, 0)
    print('ccm hist:', ccm)
    img1_hist_ccm = (img1_hist.reshape(-1, 3) @ ccm).reshape(h, w, c)

    img1_ccm = np.clip(img1_ccm+0.5, 0, 255).astype(np.uint8)
    img1_hist_ccm = np.clip(img1_hist_ccm + 0.5, 0, 255).astype(np.uint8)

    plt.figure()
    plt.subplot(231)
    plt.imshow(img1)
    plt.subplot(232)
    plt.imshow(img2)
    plt.subplot(233)
    plt.imshow(img1_hist)
    plt.subplot(234)
    plt.imshow(img1_ccm)
    plt.subplot(235)
    plt.imshow(img1_hist_ccm)
    plt.show()

    # 根据特征点拟合曲线
    print(p1.shape, p3.shape)
    p1_int = np.round(p3).astype(np.int16)
    p2_int = np.round(p4).astype(np.int16)
    x1, y1 = p1_int[..., 0], p1_int[..., 1]
    x2, y2 = p2_int[..., 0], p2_int[..., 1]
    print(im1[y1, x1].shape, im2[y2, x2].shape)

    v1 = im1[y1, x1]
    v2 = im2[y2, x2]

    r1 = [0]
    r2 = [0]
    r1 += list(v1[..., 0])
    r2 += list(v2[..., 0])
    r1 += [255]
    r2 += [255]

    r3 = np.zeros(256)
    r4 = np.zeros(256)
    for i in range(len(r1)):
        r3[r1[i]] += 1
        r4[r1[i]] += r2[i]
    r4[r3>0] = r4[r3>0] / r3[r3>0]
    r33 = np.arange(256)
    r33 = r33[r3 > 0]

    r4 = r4[r3 > 0]
    r3 = r33
    print(r4, len(r4))

    r1 = np.array(r1) / 255
    r2 = np.array(r2) / 255
    r3 = np.array(r3) / 255
    r4 = np.array(r4) / 255
    print(r1, r2)

    r_x = np.array(range(256)) / 255
    z1 = np.polyfit(r3, r4, 3) # 用3次多项式拟合,输出系数从高到0
    p1 = np.poly1d(z1)  # 使用次数合成多项式
    r_y = p1(r_x)
    plt.figure()
    plt.plot(r_x, r_y, 'r-', r1, r2, 'gx', r3, r4, 'b+')
    plt.show()
    print(r_y)
    '''
    gamma函数拟合, 不一定拟合的很好,因为实际的映射关系不一定是gamma样式
    '''
    def func(gamma, x, y):
        t = y - (x ** gamma)
        #t += t[0]*4
        #t += t[-1] * 4
        return t.reshape(-1)

    gamma = 1/2.0
    res = least_squares(func, gamma, bounds=(-1, 3), args=( r1, r1),  verbose=0)
    if res.success:
        gamma = res.x
        print(gamma)
        plt.figure()
        plt.plot(r_x, r_x ** gamma, 'r-', r1, r2, 'gx')
        plt.show()

    def p(coef, x):
        l = len(coef)
        s = 0
        for i in range(l):
            s += coef[i] * (x**i)
        return s
    def func2(coef, x, y):
        t = y - p(coef, x)
        t += t[0]* 2
        t += t[-1] * 20

        mono = np.zeros_like(t)
        mono[:-1] = t[:-1] - t[1:]
        mono[-1] = t[-2] - t[-1]

        t = np.abs(t) + 0.0*np.arange(len(t))*(np.maximum(0, mono))

        return t.reshape(-1)


    '''
    多项式函数拟合, 加入单调性
    '''
    coef = [0, 0, 0, 0, ]
    res = least_squares(func2, coef, bounds=(-1, 3), args=(r3, r4), verbose=0)
    if res.success:
        coef = res.x
        print(coef)
        plt.figure()
        plt.plot(r_x, p(coef, r_x), 'r-', r3, r4, 'gx')
        plt.show()

    # # generate lut
    # def func3(lut, x, y, lamda, b):
    #     lut = (lut * 255 + 0.5).astype(np.uint8)
    #     x = (x * 255 + 0.5).astype(np.uint8)
    #
    #     t = y - lut[x] / 255
    #     t += t[0] * 2
    #     t += t[-1] * 20
    #
    #     mono = np.zeros_like(t)
    #     mono[:-1] = t[:-1] - t[1:]
    #     mono[-1] = t[-2] - t[-1]
    #
    #     t = np.sum(t**2)**b + lamda*np.sum(np.maximum(0, mono))
    #
    #     return t
    # lut = np.random.randn(256)
    #
    # x_min = 0
    # x_max = 1
    # # cons = ({'type': 'eq', 'fun': lambda x: x[0] + x[3] + x[6] - 1},
    # #         {'type': 'eq', 'fun': lambda x: x[1] + x[4] + x[7] - 1},
    # #         {'type': 'eq', 'fun': lambda x: x[2] + x[5] + x[8] - 1},
    # #         {'type': 'ineq', 'fun': lambda x: -x[0] + x_max},
    # #         {'type': 'ineq', 'fun': lambda x: x[0] - x_min},
    # #         {'type': 'ineq', 'fun': lambda x: -x[1] + x_max},
    # #         {'type': 'ineq', 'fun': lambda x: x[1] - x_min},
    # #         {'type': 'ineq', 'fun': lambda x: -x[2] + x_max},
    # #         {'type': 'ineq', 'fun': lambda x: x[2] - x_min},
    # #         {'type': 'ineq', 'fun': lambda x: -x[3] + x_max},
    # #         {'type': 'ineq', 'fun': lambda x: x[3] - x_min},
    # #         {'type': 'ineq', 'fun': lambda x: -x[4] + x_max})
    # fun = lambda x: func3(lut, r3, r4, lamda=0, b=1)
    # res = minimize(fun, lut)  # method='L-BFGS-B',
    # print(res)
    #
    #
    #
    #