目录
1.2.1 VirtualService 主要由以下部分组成
3.5.1 安装 'monitoring.coreos.com/v1' API 组
一、istio 核心资源解读
1.1 Gateway
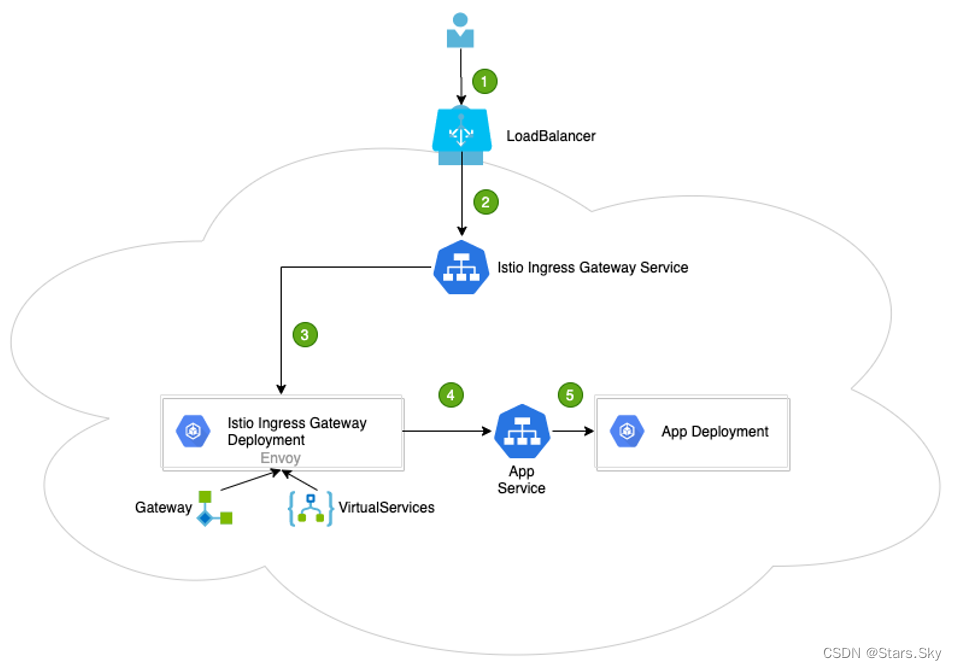
在 Kubernetes 环境中,Ingress controller 用于管理进入集群的流量。在 Istio 服务网格中 Istio Ingress Gateway 承担相应的角色,它使用新的配置模型(Gateway 和 VirtualServices)完成流量管理的功能。
通过下图做一个总的描述:
-
用户向某端口发出请求;
-
负载均衡器监听端口,并将请求转发到集群中的某个节点上。Istio Ingress Gateway Service 会监听集群节点端口的请求;
-
Istio Ingress Gateway Service 将请求交给 Istio Ingress Gateway Pod 处理;IngressGateway Pod 通过 Gateway 和 VirtualService 配置规则处理请求。其中,Gateway 用来配置端口、协议和证书;VirtualService 用来配置一些路由信息(找到请求对应处理的服务App Service);
-
Istio Ingress Gateway Pod 将请求转给 App Service;
-
最终的请求会交给 App Service 关联的 App Deployment 处理。
[root@k8s-master1 istio-1.13.1]# pwd
/root/istio/istio-1.13.1

[root@k8s-master1 istio-1.13.1]# cat samples/bookinfo/networking/bookinfo-gateway.yaml
apiVersion: networking.istio.io/v1alpha3
kind: Gateway
metadata:
  name: bookinfo-gateway
spec:
  selector:
    istio: ingressgateway # use istio default controller
  servers:
  - port:
      number: 80
      name: http
      protocol: HTTP
    hosts:
    - "*"
······
网关是一个运行在网格边缘的负载均衡器,用于接收传入或传出的 HTTP/TCP 连接。主要工作是接受外部请求,把请求转发到内部服务。网格边缘的 Ingress 流量,会通过对应的 Istio IngressGateway Controller 进入到集群内部。
在上面这个 yaml 里我们配置了一个监听 80 端口的入口网关,它会将 80 端口的 http 流量导入到集群内对应的 Virtual Service 上。
总结:
Gateway 为⽹格内服务提供负载均衡器,提供以下功能:
- L4-L7 的负载均衡。
- 对外的 mTLS。
Gateway 根据流⼊流出⽅向分为:
- IngressGateway:接收外部访问,并将流量转发到⽹格内的服务。
- EgressGateway:⽹格内服务访问外部应⽤。
1.2 VirtualService
VirtualService 是 Istio 流量治理的一个核心配置,可以说是 Istio 流量治理中最重要、最复杂的。VirtualService 在形式上表示一个虚拟服务,将满足条件的流量都转发到对应的服务后端,这个服务后端可以是一个服务,也可以是在 DestinationRule 中定义的服务的子集。
示例:virtual.yaml
apiVersion:  networking.istio.io/v1beta1
kind: VirtualService
metadata:
  name: canary
spec:
  hosts:
  - "*"
  gateways:
  - canary-gateway
  http:
  - route:
    - destination:
        host: canary.default.svc.cluster.local
        subset: v1
      weight: 90
    - destination:
        host: canary.default.svc.cluster.local
        subset: v2
      weight: 10
这个虚拟服务会收到上一个 gateway 中所有 80 端口来的 http 流量。
1.2.1 VirtualService 主要由以下部分组成
hosts:虚拟主机名称,如果在 Kubernetes 集群中,则这个主机名可以是 service 服务名。
hosts 字段列出了 virtual service 的虚拟主机。它是客户端向服务发送请求时使用的一个或多个地址,通过该字段提供的地址访问 virtual service,进而访问后端服务。在集群内部(网格内)使用时通常与 kubernetes 的 Service 同名;当需要在集群外部(网格外)访问时,该字段为 gateway 请求的地址,即与 gateway 的 hosts 字段相同。
hosts:

- reviews
virtual service 的主机名可以是 IP 地址、DNS 名称,也可以是短名称(例如 Kubernetes 服务短名称),该名称会被隐式或显式解析为全限定域名(FQDN),具体取决于 istio 依赖的平台。可以使用前缀通配符(“*”)为所有匹配的服务创建一组路由规则。virtual service 的 hosts 不一定是 Istio 服务注册表的一部分,它们只是虚拟目的地,允许用户为网格无法路由到的虚拟主机建立流量模型。
virtual service 的 hosts 短域名在解析为完整的域名时,补齐的 namespace 是 VirtualService 所在的命名空间,而非 Service 所在的命名空间。如上例的 hosts 会被解析为:reviews.default.svc.cluster.local。
1.2.2 virtualservice 配置路由规则
路由规则的功能是:满足 http.match 条件的流量都被路由到 http.route.destination,执行重定向(HTTPRedirect)、重写(HTTPRewrite)、重试(HTTPRetry)、故障注入(HTTPFaultInjection)、跨站(CorsPolicy)策略等。HTTPRoute 不仅可以做路由匹配,还可以做一些写操作来修改请求本身。
示例:
apiVersion: networking.istio.io/v1alpha3
kind: VirtualService
metadata:
  name: reviews
spec:
  hosts:
  - reviews
  http:
  - match:
    - headers:
        end-user:
          exact: jason
    route:
    - destination:
        host: reviews
        subset: v2
  - route:
    - destination:
        host: reviews
        subset: v3
在 http 字段包含了虚拟服务的路由规则,用来描述匹配条件和路由行为,它们把 HTTP/1.1、HTTP2 和 gRPC 等流量发送到 hosts 字段指定的目标。
示例中的第一个路由规则有一个条件,以 match 字段开始。此路由接收来自 ”jason“ 用户的所有请求,把请求发送到 destination 指定的 v2 子集。
1.2.3 路由规则优先级
在上面例子中,不满足第一个路由规则的流量均流向一个默认的目标,该目标在第二条规则中指定。因此,第二条规则没有 match 条件,直接将流量导向 v3 子集。
1.2.4 多路由规则解读
详细配置可参考:Istio / Virtual Service
apiVersion: networking.istio.io/v1alpha3
kind: VirtualService
metadata:
  name: bookinfo
spec:
  hosts:
    - bookinfo.com
  http:
  - match:
    - uri:
        prefix: /reviews
    route:
    - destination:
        host: reviews
  - match:
    - uri:
        prefix: /ratings
    route:
    - destination:
        host: ratings
路由规则是将特定流量子集路由到指定目标地址的工具。可以在流量端口、header 字段、URI 等内容上设置匹配条件。例如,上面这个虚拟服务让用户发送请求到两个独立的服务:ratings 和 reviews,相当于访问 http://bookinfo.com/ratings 和 http://bookinfo.com/ reviews,虚拟服务规则根据请求的 URI 把请求路由到特定的目标地址。
1.3 DestinationRule
destination rule 是 istio 流量路由功能的重要组成部分。一个 virtual service 可以看作是如何将流量分发给特定的目的地,然后调用 destination rule 来配置分发到该目的地的流量。destination rule 在 virtual service 的路由规则之后起作用(即在 virtual service 的 math->route-destination 之后起作用,此时流量已经分发到真实的 service 上),应用于真实的目的地。
可以使用 destination rule 来指定命名的服务子集,例如根据版本对服务的实例进行分组,然后通过 virtual service 的路由规则中的服务子集将控制流量分发到不同服务的实例中。
示例:DestinationRule.yaml
apiVersion: networking.istio.io/v1beta1
kind: DestinationRule
metadata:
  name: canary
spec:
  host: canary.default.svc.cluster.local
  subsets:
  - name: v1
    labels:
      app: v1
  - name: v2
    labels:
      app: v2
在虚拟服务中使用 Hosts 配置默认绑定的路由地址,用 http.route 字段,设置 http 进入的路由地址,可以看到,上面导入到了目标规则为 v1 和 v2 的子集。
v1 子集对应的是具有如下标签的 pod:
selector:
matchLabels:
app: v1
流量控制流程:Gateway -> VirtaulService -> TCP/HTTP Router -> DestinationWeight -> Subset:Port
二、istio 核心功能演示
2.1 断路器
熔断功能官方文档:Istio / 熔断
断路器是创建弹性微服务应用程序的重要模式。断路器使应用程序可以适应网络故障和延迟等网络不良影响。
2.1.1 启动 Httpbin 样例程序
[root@k8s-master1 istio-1.13.1]# pwd
/root/istio/istio-1.13.1

[root@k8s-master1 istio-1.13.1]# kubectl apply -f samples/httpbin/httpbin.yaml
应用程序 httpbin 作为此任务的后端服务。
2.1.2 配置熔断器
创建一个目标规则,在调用 httpbin 服务时应用熔断设置:
[root@k8s-master1 istio-1.13.1]# kubectl apply -f - <<EOF
apiVersion: networking.istio.io/v1alpha3
kind: DestinationRule
metadata:
  name: httpbin
spec:
  host: httpbin
  trafficPolicy:
    connectionPool:
      tcp:
        maxConnections: 1
      http:
        http1MaxPendingRequests: 1
        maxRequestsPerConnection: 1
    outlierDetection:
      consecutive5xxErrors: 1
      interval: 1s
      baseEjectionTime: 3m
      maxEjectionPercent: 100
EOF

[root@k8s-master1 istio-1.13.1]# kubectl get destinationrules
NAME      HOST      AGE
httpbin   httpbin   27s
资源清单解释:
apiVersion: networking.istio.io/v1alpha3
kind: DestinationRule
metadata:
  name: httpbin
spec:
  host: httpbin
  trafficPolicy:
    connectionPool:                    # 连接池(TCP | HTTP)配置,例如:连接数、并发请求等
      tcp:
        maxConnections: 1              # TCP连接池中的最大连接请求数,当超过这个值,会返回 503 代码。如两个请求过来,就会有一个请求返回 503。
      http:
        http1MaxPendingRequests: 1     # 连接到目标主机的最大挂起请求数,也就是待处理请求数。这里的目标指的是 virtualservice 路由规则中配置的 destination。
        maxRequestsPerConnection: 1    # 连接池中每个连接最多处理 1 个请求后就关闭,并根据需要重新创建连接池中的连接
    outlierDetection:                  # 异常检测配置,传统意义上的熔断配置,即对规定时间内服务错误数的监测
      consecutive5xxErrors: 1          # 连续错误数 1,即连续返回 502-504 状态码的 Http 请求错误数
      interval: 1s                     # 错误异常的扫描间隔 1s,即在 interval(1s)内连续发生consecutiveGatewayErrors(1)个错误,则触发服务熔断
      baseEjectionTime: 3m             # 基本驱逐时间 3 分钟,实际驱逐时间为 baseEjectionTime*驱逐次数
      maxEjectionPercent: 100          # 最大驱逐百分比 100%
2.1.3 增加一个客户端
创建客户端程序以发送流量到 httpbin 服务。这是一个名为 Fortio 的负载测试客户端,它可以控制连接数、并发数及发送 HTTP 请求的延迟。通过 Fortio 能够有效的触发前面在 DestinationRule 中设置的熔断策略。
#1. 部署 fortio 应用
[root@k8s-master1 istio-1.13.1]# kubectl apply -f samples/httpbin/sample-client/fortio-deploy.yaml

[root@k8s-master1 istio-1.13.1]# kubectl get pods
NAME                              READY   STATUS    RESTARTS   AGE
details-v1-5498c86cf5-6jqxj       2/2     Running   0          4h51m
fortio-deploy-7dcd84c469-9dgp4    2/2     Running   0          33s
······

#2. 登入客户端 Pod 并使用 Fortio 工具调用 httpbin 服务。-curl 参数表明发送一次调用
[root@k8s-master1 istio-1.13.1]# kubectl exec fortio-deploy-7dcd84c469-9dgp4 -c fortio -- /usr/bin/fortio curl -quiet http://httpbin:8000/get
HTTP/1.1 200 OK
server: envoy
·····
可以看到调用后端服务的请求已经成功!接下来,可以测试熔断。
2.1.4 触发熔断器
在 DestinationRule 配置中,定义了 maxConnections: 1 和 http1MaxPendingRequests: 1。这些规则意味着,如果并发的连接和请求数超过一个,在 istio-proxy 进行进一步的请求和连接时,后续请求或连接将被阻止。
# 发送并发数为 2 的连接(-c 2),请求 20 次(-n 20):
[root@k8s-master1 istio-1.13.1]# kubectl exec fortio-deploy-7dcd84c469-9dgp4 -c fortio -- /usr/bin/fortio load -c 2 -qps 0 -n 20 -loglevel Warning http://httpbin:8000/get

# 现在,看到预期的熔断行为,只有 55.0% 的请求成功,其余的均被熔断器拦截:
Code 200 : 11 (55.0 %)
Code 503 : 9 (45.0 %)

# 查询 istio-proxy 状态以了解更多熔断详情:
[root@k8s-master1 istio-1.13.1]# kubectl exec fortio-deploy-7dcd84c469-9dgp4 -c istio-proxy -- pilot-agent request GET stats | grep httpbin | grep pending
cluster.outbound|8000||httpbin.default.svc.cluster.local.circuit_breakers.default.remaining_pending: 1
cluster.outbound|8000||httpbin.default.svc.cluster.local.circuit_breakers.default.rq_pending_open: 0
cluster.outbound|8000||httpbin.default.svc.cluster.local.circuit_breakers.high.rq_pending_open: 0
cluster.outbound|8000||httpbin.default.svc.cluster.local.upstream_rq_pending_active: 0
cluster.outbound|8000||httpbin.default.svc.cluster.local.upstream_rq_pending_failure_eject: 0
cluster.outbound|8000||httpbin.default.svc.cluster.local.upstream_rq_pending_overflow: 18
cluster.outbound|8000||httpbin.default.svc.cluster.local.upstream_rq_pending_total: 23
可以看到 upstream_rq_pending_overflow 值 18,这意味着,目前为止已有 18 个调用被标记为熔断。
2.2 超时
设置请求超时官方文档:Istio / 设置请求超时
下面例子模拟客户端调用 nginx,nginx 将请求转发给 tomcat。nginx 服务设置了超时时间为 2 秒,如果超出这个时间就不在等待,返回超时错误。tomcat 服务设置了响应时间延迟 10 秒,任何请求都需要等待 10 秒后才能返回。client 通过访问 nginx 服务去反向代理 tomcat 服务,由于 tomcat 服务需要 10 秒后才能返回,但 nginx 服务只等待 2 秒,所以客户端会提示超时错误。
2.2.1 创建应该服务
[root@k8s-master1 timeout]# pwd
/root/istio/timeout

[root@k8s-master1 timeout]# vim nginx-deployment.yaml
---
apiVersion: apps/v1
kind: Deployment
metadata:
  name: nginx
  labels:
    server: nginx
    app: web
spec:
  replicas: 1
  selector:
    matchLabels:
      server: nginx
      app: web
  template:
    metadata:
      name: nginx
      labels:
        server: nginx
        app: web
    spec:
      containers:
      - name: nginx
        image: nginx:1.14-alpine
        imagePullPolicy: IfNotPresent
---
apiVersion: apps/v1
kind: Deployment
metadata:
  name: tomcat
  labels:
    server: tomcat
    app: web
spec:
  replicas: 1
  selector:
    matchLabels:
      server: tomcat
      app: web
  template:
    metadata:
      name: tomcat
      labels:
        server: tomcat
        app: web
    spec:
      containers:
      - name: tomcat
        image: docker.io/kubeguide/tomcat-app:v1
        imagePullPolicy: IfNotPresent

[root@k8s-master1 timeout]# kubectl apply -f nginx-deployment.yaml
2.2.2 创建 service
[root@k8s-master1 timeout]# vim nginx-tomcat-svc.yaml
---
apiVersion: v1
kind: Service
metadata:
  name: nginx-svc
spec:
  selector:
    server: nginx
  ports:
  - name: http
    port: 80
    targetPort: 80
    protocol: TCP
---
apiVersion: v1
kind: Service
metadata:
  name: tomcat-svc
spec:
  selector:
    server: tomcat
  ports:
  - name: http
    port: 8080
    targetPort: 8080
    protocol: TCP

[root@k8s-master1 timeout]# kubectl apply -f nginx-tomcat-svc.yaml
2.2.3 创建 VirtualService
[root@k8s-master1 timeout]# vim virtual-tomcat.yaml
---
apiVersion: networking.istio.io/v1beta1
kind: VirtualService
metadata:
  name: nginx-vs
spec:
  hosts:
  - nginx-svc
  http:
  - route:
    - destination:
        host: nginx-svc
    timeout: 2s                       # 该设置说明调用 nginx-svc 的 k8s service,请求超时时间是 2s
---
apiVersion: networking.istio.io/v1beta1
kind: VirtualService
metadata:
  name: tomcat-vs
spec:
  hosts:
  - tomcat-svc
  http:
  - fault:
      delay:
        percentage:
          value: 100
        fixedDelay: 10s                # 该设置说明每次调用 tomcat-svc 的 k8s service,都会延迟10s 才会调用。
    route:
    - destination:
        host: tomcat-svc

[root@k8s-master1 timeout]# kubectl apply -f virtual-tomcat.yaml
2.2.4 设置超时时间
[root@k8s-master1 timeout]# kubectl exec -it nginx-7649c6ff85-k8j7h -- sh
/ # vi /etc/nginx/conf.d/default.conf
······
    location / {
    #    root   /usr/share/nginx/html;        # 修改此段内容
    #    index  index.html index.htm;
         proxy_pass http://tomcat-svc:8080;
         proxy_http_version 1.1;
    }
······

/ # nginx -t
/ # nginx -s reload
/ # exit
2.2.5 验证超时
[root@k8s-master1 timeout]# kubectl run busybox --image busybox:1.28 --restart=Never --rm -it busybox -- sh
/ # time wget -q -O - http://nginx-svc
wget: server returned error: HTTP/1.1 504 Gateway Timeout
Command exited with non-zero status 1
real	0m 2.03s
user	0m 0.00s
sys	0m 0.00s

# 每隔 2 秒,由于 nginx 服务的超时时间到了而 tomcat 未有响应,则提示返回超时错误。
/ # while true; do wget -q -O - http://nginx-svc; done
wget: server returned error: HTTP/1.1 504 Gateway Timeout
wget: server returned error: HTTP/1.1 504 Gateway Timeout
wget: server returned error: HTTP/1.1 504 Gateway Timeout
wget: server returned error: HTTP/1.1 504 Gateway Timeout
wget: server returned error: HTTP/1.1 504 Gateway Timeout
^C

# 验证故障注入效果,执行之后 10s 才会有结果
/ # time wget -q -O - http://tomcat-svc
wget: server returned error: HTTP/1.1 503 Service Unavailable
Command exited with non-zero status 1
real	0m 10.02s
user	0m 0.00s
sys	0m 0.00s
2.3 故障注入和重试
故障注入官方文档:Istio / 故障注入
Istio 重试机制就是如果调用服务失败,Envoy 代理尝试连接服务的最大次数。而默认情况下,Envoy 代理在失败后并不会尝试重新连接服务,除非我们启动 Istio 重试机制。
下面例子模拟客户端调用 nginx,nginx 将请求转发给 tomcat。tomcat 通过故障注入而中止对外服务,nginx 设置如果访问 tomcat 失败则会重试 3 次。
2.3.1 创建虚拟服务
# 清空上个实验的环境
[root@k8s-master1 timeout]# kubectl delete -f .
[root@k8s-master1 timeout]# kubectl apply -f nginx-deployment.yaml
[root@k8s-master1 timeout]# kubectl apply -f nginx-tomcat-svc.yaml

[root@k8s-master1 timeout]# vim virtual-attempt.yaml
---
apiVersion: networking.istio.io/v1beta1
kind: VirtualService
metadata:
  name: nginx-vs
spec:
  hosts:
  - nginx-svc
  http:
  - route:
    - destination:
        host: nginx-svc
    retries:
      attempts: 3           # 调用超时:该设置说明调用 nginx-svc 的 k8s service,在初始调用失败后最多重试 3 次来连接到服务子集,每个重试都有 2 秒的超时
      perTryTimeout: 2s
---
apiVersion: networking.istio.io/v1beta1
kind: VirtualService
metadata:
  name: tomcat-vs
spec:
  hosts:
  - tomcat-svc
  http:
  - fault:
      abort:               # abort 是模拟 tomcat 服务始终不可用,该设置说明每次调用 tomcat-svc 的 k8s service,100% 都会返回错误状态码 503。
        percentage:        # 故障注入:该虚拟服务的作用对象就是 tomcat-svc。使用此故障注入后,在网格中该 tomcat 就是不可用的。
          value: 100
        httpStatus: 503
    route:
    - destination:
        host: tomcat-svc

[root@k8s-master1 timeout]# kubectl apply -f virtual-attempt.yaml
2.3.2 设置代理
[root@k8s-master1 timeout]# kubectl exec -it nginx-7649c6ff85-7t86j -- sh
/ # vi /etc/nginx/conf.d/default.conf
······
    location / {
    #    root   /usr/share/nginx/html;
    #    index  index.html index.htm;
         proxy_pass http://tomcat-svc:8080;
         proxy_http_version 1.1;
    }
······
/ # nginx -t
/ # nginx -s reload
/ # exit
2.3.3 验证重试是否生效
[root@k8s-master1 timeout]# kubectl run busybox --image busybox:1.28 --restart=Never --rm -it busybox -- sh
/ # wget -q -O - http://nginx-svc
wget: server returned error: HTTP/1.1 503 Service Unavailable
/ # exit

# 查看容器日志
[root@k8s-master1 timeout]# kubectl logs nginx-7649c6ff85-7t86j -c istio-proxy
由上图可知,重试设置生效。
三、分布式追踪系统
3.1 什么是分布式追踪
分布式追踪最早由谷歌的 Dapper 普及开来,它本质上是具有在微服务的整个生命周期中追踪请求的能力。分布式追踪(Distributed Tracing)主要用于记录整个请求链的信息。
3.2 为什么要分布式追踪?
3.3 分布式追踪系统-jaeger
Jaeger 是一个开源的分布式追踪系统,它可以在复杂的分布式系统中进行监控和故障排查。Jaeger 的主要功能包括分布式请求监控、性能调优、故障分析和服务依赖分析等。
3.3.1 Jaeger 组件介绍:
-
jaeger-agent:负责发送的进程,对 spans 进行处理并发送给 collector,监听 spans 的 UDP 发送。这层作为基础组件部署在主机上,Agent 将 Client Library 和 Collector 解耦,为 ClientLibrary 屏蔽了路由和发现 Collector 的细节。
-
jaeger-collector:收集追踪 spans,并通过管道对追踪数据进行处理。当前的管道支持追踪的验证、索引、转换,最后存储数据。
-
jaeger-query:从存储中检索追踪信息并通过 UI 展示。
3.3.2 追踪上下文传递
Istio 利用 Envoy 的分布式追踪 功能提供了开箱即用的追踪集成。确切地说,Istio 提供了安装各种追踪后端服务的选项,并且通过配置代理来自动发送追踪 span 到追踪后端服务。尽管 Istio 代理能够自动发送 span,但是他们需要一些附加线索才能将整个追踪链路关联到一起。所以当代理发送 span 信息的时候,应用需要附加适当的 HTTP 请求头信息,这样才能够把多个 span 正确的关联到同一个追踪上。
要做到这一点,应用程序从传入请求到任何传出的请求中需要包含以下请求头参数:
-
x-request-id
-
x-b3-traceid
-
x-b3-spanid
-
x-b3-parentspanid
-
x-b3-sampled
-
x-b3-flags
3.4 分布式追踪系统-kiali
Kiali 是 Istio 服务网格的可视化工具,它主要的功能是用可视化的界面来观察微服务系统以及服务之间的关系。Kiali 功能如下。
-
服务拓扑图:这是 Kiali 最主要的功能,提供了一个总的服务视图,可以实时地显示命名空间下服务之间的调用和层级关系,以及负载情况。·
-
服务列表视图:展示了系统中所有的服务,以及它们的健康状况和出错率。工作负载视图:展示服务的负载情况。
-
Istio 配置视图:展示了所有的 Istio 配置对象。
Kiali 的架构比较简单,如下图,它分为前端和后端两部分。后端以容器的方式运行在应用平台,负责获取和处理数据,并发送给前端;前端是一个典型的 Web 应用,由 React 和 TypeScript 实现,负责展示后端发送过来的数据。对 Kiali 来说 Istio 是必须存在的系统,它类似于 Kiali 的宿主。虽然它们可以分开部署,但没有了 Istio,Kiali 是不能工作的。

Kiali 是一个非常强大的可视化工具,可以让用户清晰和直观地了解到Istio服务网格中的服务以及服务之间的关系。除了服务拓扑图外,它还提供了健康检查、指标数据显示和配置验证等功能。强烈推荐把 Kiali 作为必选项添加到服务网格中,来帮助监控和观测网格中服务的工作情况。
3.5 安装 jaeger 和 kiali
3.5.1 安装 'monitoring.coreos.com/v1' API 组
如果 k8s 没有安装 'monitoring.coreos.com/v1' API 组 接下来安装 Prometheus 组件时会报如下错误:
unable to recognize "samples/addons/extras/prometheus-operator.yaml": no matches for kind "PodMonitor" in version "monitoring.coreos.com/v1"
unable to recognize "samples/addons/extras/prometheus-operator.yaml": no matches for kind "ServiceMonitor" in version "monitoring.coreos.com/v1"
检查 Kubernetes 集群的版本是否支持 monitoring.coreos.com/v1 API 组:
# 如果为空,则需要安装,否则不需要安装(跳过 3.5.1 这步即可)
[root@k8s-master1 istio-1.13.1]# kubectl api-versions | grep monit
安装 Helm 工具:
Helm 下载官网:Releases · helm/helm · GitHub
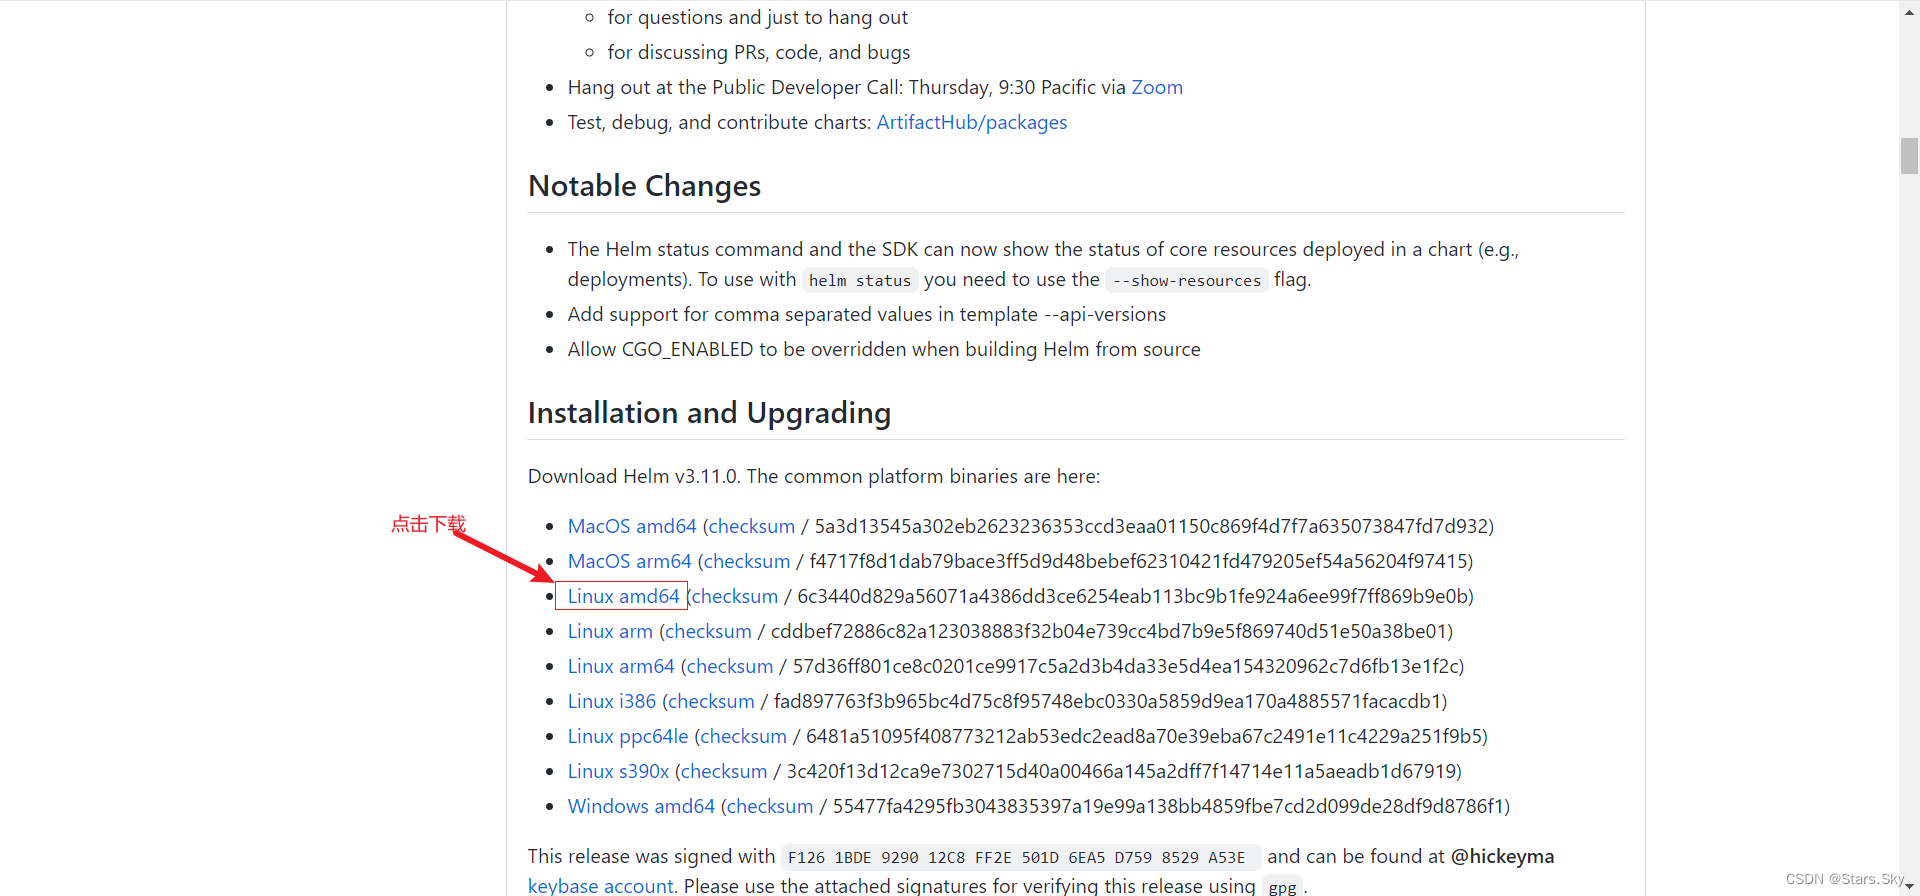
[root@k8s-master1 istio-1.13.1]# ls
bin  helm-v3.11.0-linux-amd64.tar.gz  LICENSE  manifests  manifest.yaml  README.md  samples  tools

# 解压下载的 Helm 工具:
[root@k8s-master1 istio-1.13.1]# tar -zxvf helm-v3.11.0-linux-amd64.tar.gz

# 将 Helm 工具移动到系统的可执行文件路径下:
[root@k8s-master1 istio-1.13.1]# mv linux-amd64/helm /usr/local/bin/

# 验证 Helm 是否安装成功:
[root@k8s-master1 istio-1.13.1]# helm version
version.BuildInfo{Version:"v3.11.0", GitCommit:"472c5736ab01133de504a826bd9ee12cbe4e7904", GitTreeState:"clean", GoVersion:"go1.18.10"}
安装 Prometheus Operator:
# 创建一个 Namespace,用于存储 Prometheus Operator 的资源对象:
[root@k8s-master1 istio-1.13.1]# kubectl create namespace monitoring

# 添加 Prometheus Operator 的 Helm Chart 仓库:
[root@k8s-master1 istio-1.13.1]# helm repo add prometheus-community https://prometheus-community.github.io/helm-charts
[root@k8s-master1 istio-1.13.1]# helm repo update

# 安装 Prometheus Operator:
# 在线安装
[root@k8s-master1 istio-1.13.1]# helm install prometheus-operator prometheus-community/kube-prometheus-stack -n monitoring
# 离线安装(推荐)
[root@k8s-master1 istio-1.13.1]# helm pull prometheus-community/kube-prometheus-stack --version 45.1.1
[root@k8s-master1 istio-1.13.1]# helm install prometheus-operator ./kube-prometheus-stack-45.1.1.tgz -n monitoring

[root@k8s-master1 istio-1.13.1]# kubectl get pods -n monitoring
3.5.2 安装 kiali
Istio 1.3 开始,默认并不安装控制面板 Kiali, 以及 prometheus、grafana、jaeger、zipkin 等组件。通过以下命令安装控制面板 Kiali 及相关的组件:
[root@k8s-master1 istio-1.13.1]# pwd
/root/istio/istio-1.13.1
[root@k8s-master1 istio-1.13.1]# ls samples/addons/
extras  grafana.yaml  jaeger.yaml  kiali.yaml  prometheus.yaml  README.md
[root@k8s-master1 istio-1.13.1]# ls samples/addons/extras/
prometheus-operator.yaml  prometheus_vm_tls.yaml  prometheus_vm.yaml  zipkin.yaml

[root@k8s-master1 istio-1.13.1]# kubectl apply -f samples/addons/
[root@k8s-master1 istio-1.13.1]# kubectl apply -f samples/addons/extras/

[root@k8s-master1 istio-1.13.1]# kubectl get pods -n istio-system
NAME                                   READY   STATUS    RESTARTS       AGE
grafana-67f5ccd9d7-l2wdb               1/1     Running   0              2m25s
istio-egressgateway-76c96658fd-8x67k   1/1     Running   2 (23h ago)    3d1h
istio-ingressgateway-569d7bfb4-4qgn7   1/1     Running   2 (23h ago)    3d1h
istiod-74c64d89cb-qjsr4                1/1     Running   4 (110m ago)   3d1h
jaeger-78cb4f7d4b-rp7zn                1/1     Running   0              2m24s
kiali-c946fb5bc-cjc9z                  1/1     Running   0              2m24s
prometheus-6846787d5c-l4wm6            3/3     Running   0              2m17s
zipkin-5f555d5498-chczd                1/1     Running   0              2m17s
3.5.3 Kiali 控制面板配置
由于 Istio 并不会向 istio-system 命名空间流入 sidecar(其 label istio-injection=disabled ), 我们通过 nodePort 的方式对外暴露控制面板。个人习惯是将原来的 ClusterIP 等类型的 service 导出yaml 文件,通过删除注解、创建信息、状态字段及 ClusterIP 信息,然后将类型改为 NodePort,最后使用 kubectl apply -f 创建:
[root@k8s-master1 istio-1.13.1]# kubectl get svc -n istio-system kiali -o yaml > kiali-nodeport.yaml

# 主要删除 metadata 下的 annotation、kubectl.kubernetes.io/last-applied-configuration、creationTimestamp、resourceVersion、uid 字段; 以及 spec 下的 ClusterIP、clusterIPs 字段;修改类型为 NodePort, 同时删除 status 状态字段即可。
[root@k8s-master1 istio-1.13.1]# vim kiali-nodeport.yaml
apiVersion: v1
kind: Service
metadata:
  labels:
    app: kiali
    app.kubernetes.io/instance: kiali
    app.kubernetes.io/managed-by: Helm
    app.kubernetes.io/name: kiali
    app.kubernetes.io/part-of: kiali
    app.kubernetes.io/version: v1.45.0
    helm.sh/chart: kiali-server-1.45.0
    version: v1.45.0
  name: kiali
  namespace: istio-system
spec:
  internalTrafficPolicy: Cluster
  ipFamilies:
  - IPv4
  ipFamilyPolicy: SingleStack
  ports:
  - name: http
    port: 20001
    protocol: TCP
    targetPort: 20001
  - name: http-metrics
    port: 9090
    protocol: TCP
    targetPort: 9090
  selector:
    app.kubernetes.io/instance: kiali
    app.kubernetes.io/name: kiali
  sessionAffinity: None
  type: NodePort

[root@k8s-master1 istio-1.13.1]# kubectl apply -f kiali-nodeport.yaml
3.5.4 其他组件配置
以同样的方式将上面安装的其他组件 prometheus、jaeger、grafna 等通过 nodePort 的方式暴露至集群外:
# prometheus
[root@k8s-master1 istio-1.13.1]# kubectl get svc -n istio-system prometheus -o yaml > prometheus-nodeport.yaml
[root@k8s-master1 istio-1.13.1]# vim prometheus-nodeport.yaml
[root@k8s-master1 istio-1.13.1]# kubectl apply -f prometheus-nodeport.yaml
# grafana
[root@k8s-master1 istio-1.13.1]# kubectl get svc -n istio-system grafana -o yaml > grafana-nodeport.yaml
[root@k8s-master1 istio-1.13.1]# vim grafana-nodeport.yaml
[root@k8s-master1 istio-1.13.1]# kubectl apply -f grafana-nodeport.yaml
# jaeger
[root@k8s-master1 istio-1.13.1]# kubectl get svc -n istio-system tracing -o yaml > tracing-nodeport.yaml
[root@k8s-master1 istio-1.13.1]# vim tracing-nodeport.yaml
[root@k8s-master1 istio-1.13.1]# kubectl apply -f tracing-nodeport.yaml
# zipkin
[root@k8s-master1 istio-1.13.1]# kubectl get svc -n istio-system zipkin -o yaml > zipkin-nodeport.yaml
[root@k8s-master1 istio-1.13.1]# vim zipkin-nodeport.yaml
[root@k8s-master1 istio-1.13.1]# kubectl apply -f zipkin-nodeport.yaml
[root@k8s-master1 istio-1.13.1]# kubectl get svc -n istio-system | grep NodePort
[root@k8s-master1 istio-1.13.1]# kubectl get svc -n istio-system | grep NodePort
grafana NodePort 10.101.192.204 <none> 3000:30699/TCP 22m
kiali NodePort 10.97.80.229 <none> 20001:31673/TCP,9090:30100/TCP 22m
prometheus NodePort 10.101.13.48 <none> 9090:30082/TCP 22m
tracing NodePort 10.98.192.59 <none> 80:32438/TCP 22m
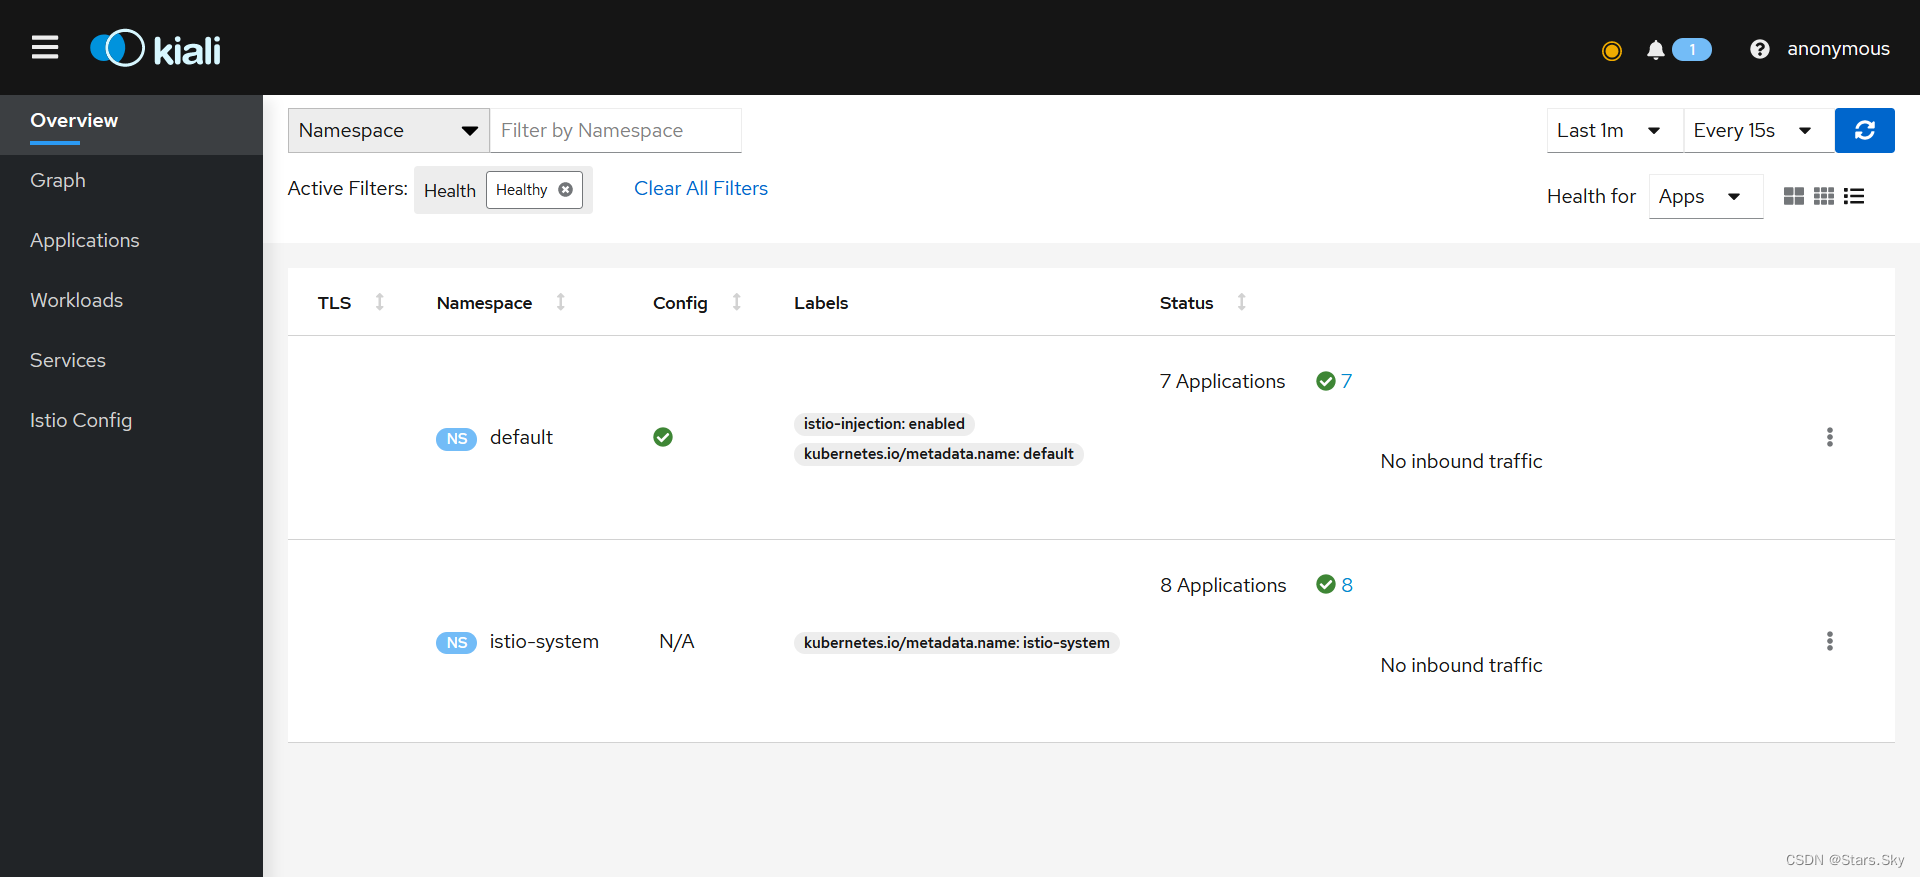
zipkin NodePort 10.107.196.123 <none> 9411:32180/TCP 22m3.5.5 访问 kiali
在浏览器访问:192.168.78.143:31673
上一篇文章:【Kubernetes 企业项目实战】07、最新一代微服务网格 Istio 入门到企业实战(上)_Stars.Sky的博客-CSDN博客
下一篇文章:【Kubernetes 企业项目实战】08、简化 K8s 应用部署工具 Helm V3 入门到企业实战_Stars.Sky的博客-CSDN博客