一、获取代码方式
获取代码方式1:
完整代码已上传我的资源:【数字信号去噪】基于matlab稀疏性 BEADS色谱基线估计和去噪【含Matlab源码 1887期】
获取代码方式2:
通过订阅紫极神光博客付费专栏,凭支付凭证,私信博主,可获得此代码。
备注:
订阅紫极神光博客付费专栏,可免费获得1份代码(有效期为订阅日起,三天内有效);
二、部分源代码
%% Example: Chromatograms BEADS (Baseline Estimation And Denoising with Sparsity)
%%开始
clear all
addpath data
load data/noise.mat;
load data/chromatograms.mat;
whos
%%下载数据
% Load data and add noise.
y = X(:, 3) + noise * 0.5;
N = length(y);
%% Run the BEADS algorithm
% Filter parameters
fc = 0.006; % fc : cut-off frequency (cycles/sample)
d = 1; % d : filter order parameter (d = 1 or 2)
% Positivity bias (peaks are positive)
r = 6; % r : asymmetry parameter
% Regularization parameters
amp = 0.8;
lam0 = 0.5*amp;
lam1 = 5*amp;
lam2 = 4*amp;
tic
[x1, f1, cost] = beads(y, d, fc, r, lam0, lam1, lam2);
toc
%% Display the output of BEADS
ylim1 = [-50 200];
xlim1 = [0 3800];
figure(1)
clf
subplot(4, 1, 1)
plot(y)
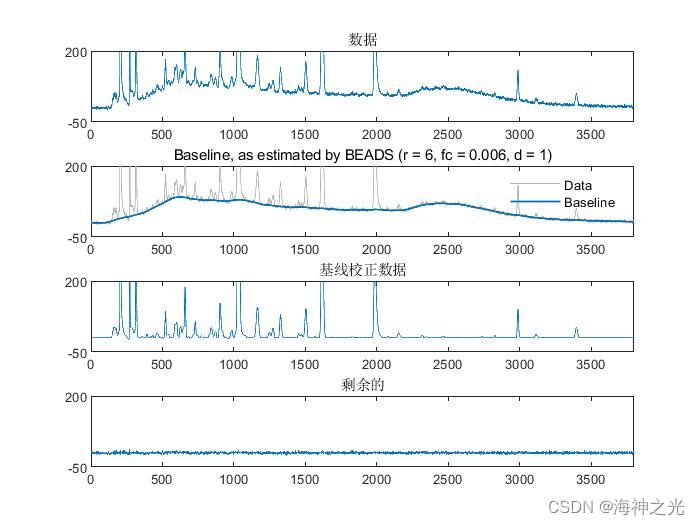
title('数据')
xlim(xlim1)
ylim(ylim1)
set(gca,'ytick', ylim1)
subplot(4, 1, 2)
plot(y,'color', [1 1 1]*0.7)
line(1:N, f1, 'LineWidth', 1)
legend('Data', 'Baseline')
legend boxoff
title(['Baseline, as estimated by BEADS', ' (r = ', num2str(r), ', fc = ', num2str(fc), ', d = ', num2str(d),')'])
xlim(xlim1)
ylim(ylim1)
set(gca,'ytick', ylim1)
subplot(4, 1, 3)
plot(x1)
title('基线校正数据')
xlim(xlim1)
ylim(ylim1)
set(gca,'ytick', ylim1)
subplot(4, 1, 4)
plot(y - x1 - f1)
title('剩余的')
xlim(xlim1)
ylim(ylim1)
set(gca,'ytick', ylim1)
orient tall
print -dpdf example
%% Display cost function history
figure(2)
clf
plot(cost)
xlabel('迭代次数')
ylabel('成本函数值')
title('历史成本函数')
三、运行结果
四、matlab版本及参考文献
1 matlab版本
2014a
2 参考文献
[1] 沈再阳.精通MATLAB信号处理[M].清华大学出版社,2015.
[2]高宝建,彭进业,王琳,潘建寿.信号与系统——使用MATLAB分析与实现[M].清华大学出版社,2020.
[3]王文光,魏少明,任欣.信号处理与系统分析的MATLAB实现[M].电子工业出版社,2018.