Matplotlib三维绘图,这一篇就够了
这篇博客将介绍使用 mplot3d 工具包进行三维绘图,支持简单的 3D 图形,包括曲面、线框、散点图和条形图。
1. 效果图
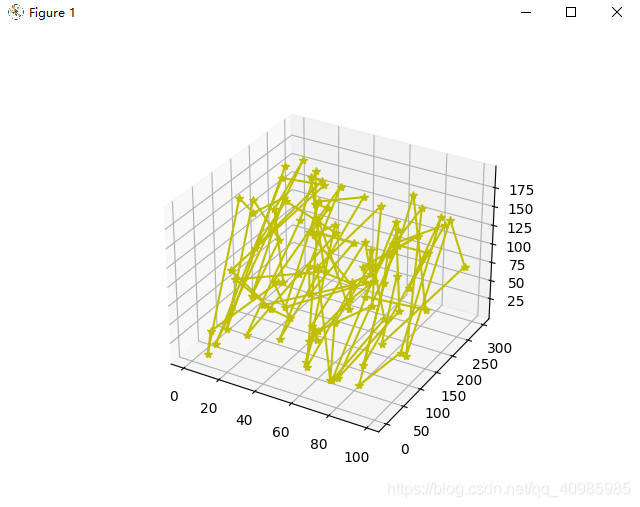
1.1 3D线效果图
3D线图效果如下:
可自定义线的颜色及点的样式;
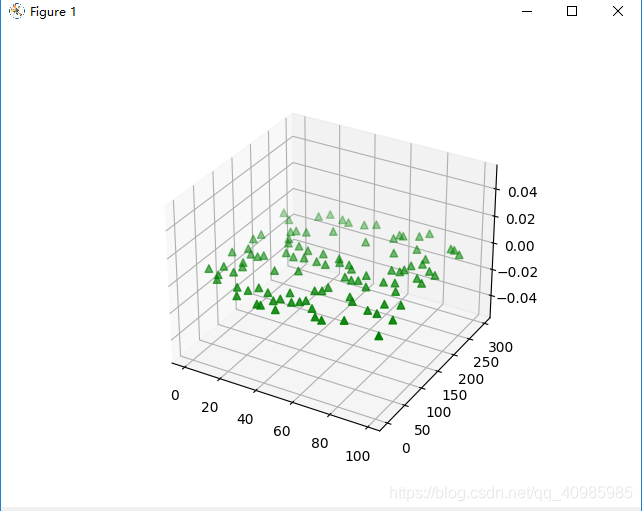
1.2 3D散点效果图
3D散点图(标记了着色以呈现深度外观)效果如下:
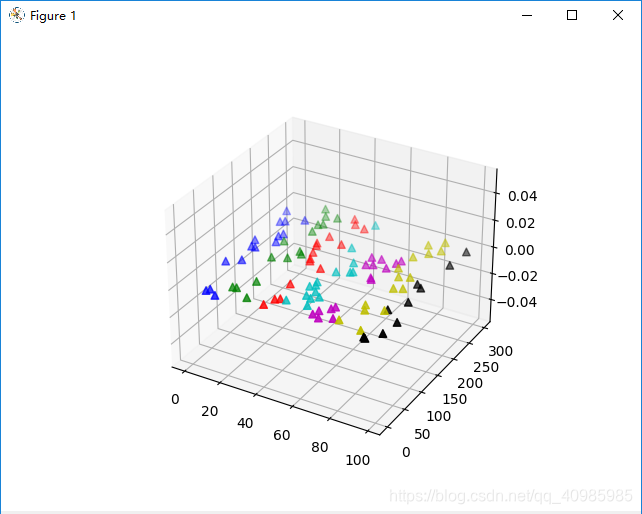
1.3 3D随机颜色散点效果图
3D随机颜色散点图效果如下:
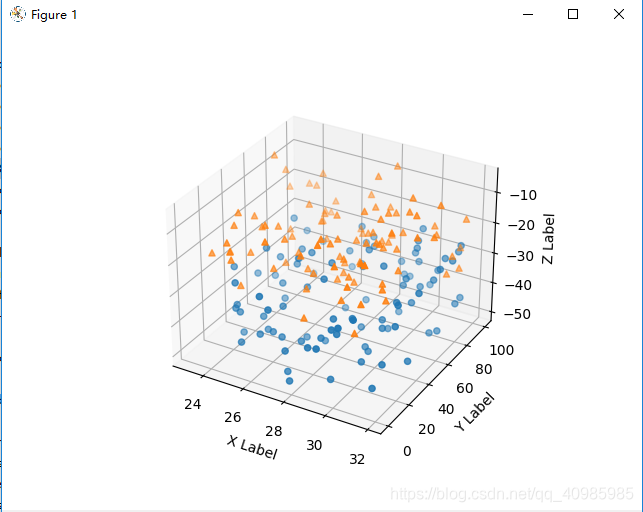
1.4 3D散点不同mark点效果图
3D官方散点图不同mark点效果如下:
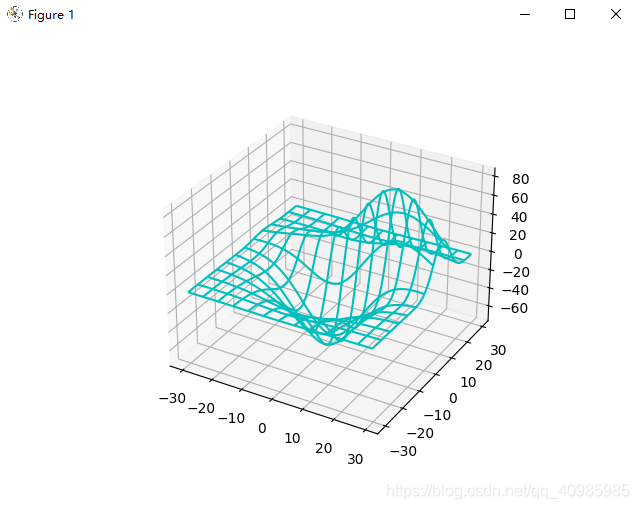
1.5 3D线框效果图
3D线框图效果如下:
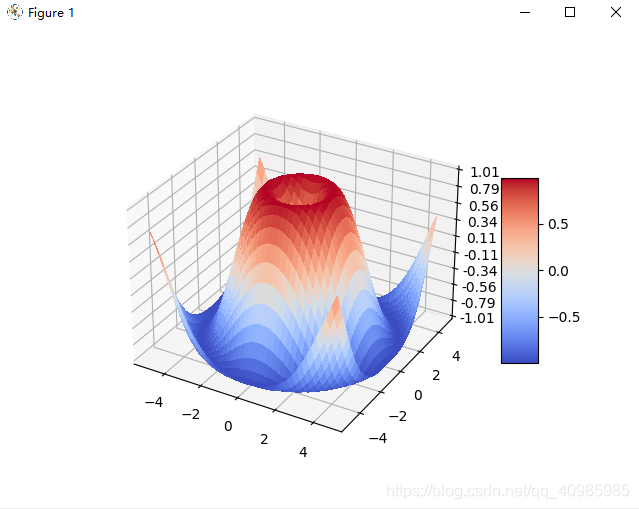
1.6 3D曲面不透明效果图
3D曲面图不透明如下:
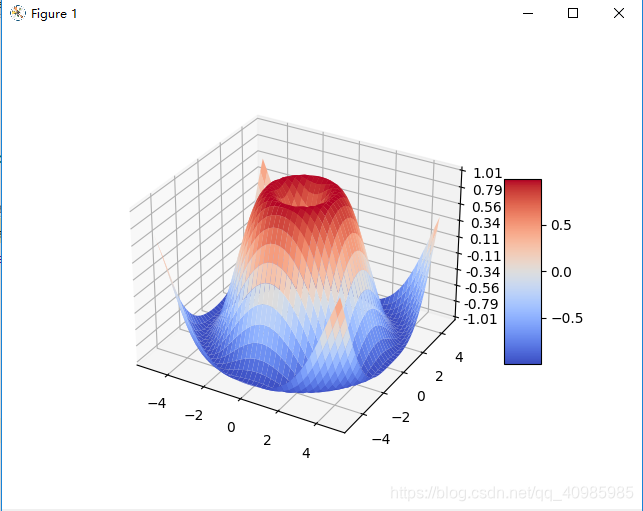
1.7 3D曲面透明效果图
3D曲面图透明如下:
2. 源码
# matplotlib 3D绘图

# 3D 轴(属于 Axes3D 类)是通过将 projection="3d" 关键字参数传递给 Figure.add_subplot 来创建的:
from mpl_toolkits.mplot3d import axes3d
import matplotlib.pyplot as plt
import numpy as np

x = np.arange(100)
y = np.random.randint(0, 300, 100)
z = np.random.randint(0, 200, 100)


# 3D线图
def line_3d():
    # 线
    fig = plt.figure()
    ax = fig.add_subplot(projection='3d')

    # c颜色,marker:样式*雪花
    ax.plot(xs=x, ys=y, zs=z, c="y", marker="*")
    plt.show()


# 3D散点图
def scatter_3d():
    # 散点图
    fig = plt.figure()
    ax = fig.add_subplot(projection='3d')

    # s:marker标记的大小
    # c: 颜色  可为单个,可为序列
    # depthshade: 是否为散点标记着色以呈现深度外观。对 scatter() 的每次调用都将独立执行其深度着色。
    # marker:样式
    ax.scatter(xs=x, ys=y, zs=0, zdir='z', s=30, c="g", depthshade=True, cmap="jet", marker="^")
    plt.show()


def randrange(n, vmin, vmax):
    """
    Helper function to make an array of random numbers having shape (n, )
    with each number distributed Uniform(vmin, vmax).
    """
    return (vmax - vmin) * np.random.rand(n) + vmin


# 3D随机颜色散点图
def scatter_random_color_3d():
    # 随机颜色散点图
    fig = plt.figure()
    ax = fig.add_subplot(projection='3d')

    # c: 颜色 可为单个,可为序列
    # ‘b’ blue 蓝色、g’ green 绿色、‘r’ red 红色、‘c’ cyan 兰青色
    # ‘m’ magenta 紫色、‘y’ yellow 黄色、‘k’ black 黑色、‘w’white 白色
    colors = ['b', 'g', 'r', 'c', 'm', 'y', 'k', 'w']
    c = np.repeat(colors, 15)[:100]
    ax.scatter(xs=x, ys=y, zs=0, zdir='z', s=30, c=c, depthshade=True, cmap="jet", marker="^")
    plt.show()

    # demo示例
    # 设置种子以便重现随机值
    np.random.seed(19680801)
    fig = plt.figure()
    ax = fig.add_subplot(projection='3d')
    n = 100
    # 每一个样式,绘制n个随机点
    # 定义 x in [23, 32], y in [0, 100], z in [zlow, zhigh].
    for m, zlow, zhigh in [('o', -50, -25), ('^', -30, -5)]:
        xs = randrange(n, 23, 32)
        ys = randrange(n, 0, 100)
        zs = randrange(n, zlow, zhigh)
        ax.scatter(xs, ys, zs, marker=m)
    ax.set_xlabel('X Label')
    ax.set_ylabel('Y Label')
    ax.set_zlabel('Z Label')
    plt.show()


# 线框图
def wireframe_3d():
    fig = plt.figure()
    ax = fig.add_subplot(projection='3d')

    x = np.random.randint(-30, high=30, size=(50,)).reshape((25, 2))
    y = np.random.randint(-30, high=30, size=(50,)).reshape((25, 2))
    z = np.zeros(50).reshape((25, 2))

    # c: 颜色
    # ‘b’ blue 蓝色、g’ green 绿色、‘r’ red 红色、‘c’ cyan 兰青色
    # ‘m’ magenta 紫色、‘y’ yellow 黄色、‘k’ black 黑色、‘w’white 白色
    ax.plot_wireframe(x, y, z, color='m')
    plt.show()

    # demo示例
    fig = plt.figure()
    ax = fig.add_subplot(projection='3d')
    # 获取测试数据
    X, Y, Z = axes3d.get_test_data(0.05)
    # 绘制基本的线框图
    ax.plot_wireframe(X, Y, Z, color='c', rstride=10, cstride=10)
    plt.show()


# 曲面图,默认情况下,它将以纯色的阴影着色,但它也通过提供 cmap 参数支持颜色映射。
# rcount 和 ccount kwargs 都默认为 50,决定了每个方向使用的最大样本数。如果输入数据较大,则会将其下采样(通过切片)到这些点数。
# 为了最大限度地提高渲染速度,将 rstride 和 cstride 分别设置为行数减 1 和列数减 1 的除数。例如,给定 51 行,rstride 可以是 50 的任何除数。
# 同样,设置 rstride 和 cstride 等于 1(或 rcount 和 ccount 等于行数和列数)可以使用优化路径。
def surface_3d():
    # 3D 表面(颜色图)演示绘制使用冷暖色图着色的 3D 表面。通过使用 antialiased=False 使表面变得不透明。
    import matplotlib.pyplot as plt
    from matplotlib import cm
    from matplotlib.ticker import LinearLocator
    import numpy as np

    fig, ax = plt.subplots(subplot_kw={

    "projection": "3d"})

    # 构建数据
    X = np.arange(-5, 5, 0.25)
    Y = np.arange(-5, 5, 0.25)
    X, Y = np.meshgrid(X, Y)
    R = np.sqrt(X ** 2 + Y ** 2)
    Z = np.sin(R)

    # 绘制曲面图
    # 绘制使用冷暖色图着色的 3D 表面。通过使用 antialiased=False 使表面变得不透明。
    surf = ax.plot_surface(X, Y, Z, cmap=cm.coolwarm,
                           linewidth=0, antialiased=False)

    # 定制z轴
    ax.set_zlim(-1.01, 1.01)
    ax.zaxis.set_major_locator(LinearLocator(10))
    # A StrMethodFormatter is used automatically
    ax.zaxis.set_major_formatter('{x:.02f}')

    # 添加一个颜色条形图展示颜色区间
    fig.colorbar(surf, shrink=0.5, aspect=5)
    plt.show()

    # 绘制曲面图
    # 绘制使用冷暖色图着色的 3D 表面。通过使用 antialiased=True 使表面变得透明。
    fig, ax = plt.subplots(subplot_kw={

    "projection": "3d"})
    surf = ax.plot_surface(X, Y, Z, cmap=cm.coolwarm,
                           linewidth=0, antialiased=True)
    # 定制z轴
    ax.set_zlim(-1.01, 1.01)
    ax.zaxis.set_major_locator(LinearLocator(10))
    # A StrMethodFormatter is used automatically
    ax.zaxis.set_major_formatter('{x:.02f}')
    # 添加一个颜色条形图展示颜色区间
    fig.colorbar(surf, shrink=0.5, aspect=5)
    plt.show()


# 三角曲面图
def tri_surface_3d():
    n_radii = 8
    n_angles = 36

    # 将半径和角度设为等差数组(省略半径r=0以消除重复)
    # start,stop,n,endpoint 默认endpoint为True,包含stop,为False不包含stop
    radii = np.linspace(0.125, 1.0, n_radii)
    angles = np.linspace(0, 2 * np.pi, n_angles, endpoint=False)[..., np.newaxis]

    # 将polar极坐标(半径、角度)转换为cartesian笛卡尔坐标(x、y)
    # (0,0)在此阶段手动添加,因此(x,y)平面中的点不会重复
    x = np.append(0, (radii * np.cos(angles)).flatten())
    y = np.append(0, (radii * np.sin(angles)).flatten())

    # 计算z以生成pringle surface普林格尔曲面
    z = np.sin(-x * y)

    ax = plt.figure().add_subplot(projection='3d')
    ax.plot_trisurf(x, y, z, linewidth=0.2, antialiased=True)
    plt.show()


# 3D线图
line_3d()

# 3D散点图
scatter_3d()

# 3D随机颜色散点图
scatter_random_color_3d()

# 线框图
wireframe_3d()

# 曲面图,默认情况下,它将以纯色的阴影着色,但它也通过提供 cmap 参数支持颜色映射。
surface_3d()

# 三角曲面图
tri_surface_3d()