前言
在微服务架构中,一次请求往往涉及到多个模块,多个中间件,多台机器的相互协作才能完成。这一系列调用请求中,有些是串行的,有些是并行的,那么如何确定这个请求背后调用了哪些应用,哪些模块,哪些节点及调用的先后顺序?如何定位每个模块的性能问题?本文将为你揭晓答案。
分布式追踪系统的原理及作用
如何衡量一个接口的性能好坏,一般我们至少会关注以下三个指标
-
接口的 RT 你怎么知道?
-
是否有异常响应?
-
主要慢在哪里?
单体架构
在初期,公司刚起步的时候,可能多会采用如下单体架构,对于单体架构我们该用什么方式来计算以上三个指标呢?

最容易想到的显然是用 AOP

使用 AOP 在调用具体的业务逻辑前后分别打印一下时间即可计算出整体的调用时间,使用 AOP 来 catch 住异常也可知道是哪里的调用导致的异常。
微服务架构
在单体架构中由于所有的服务,组件都在一台机器上,所以相对来说这些监控指标比较容易实现,不过随着业务的快速发展,单体架构必然会朝微服务架构发展,如下

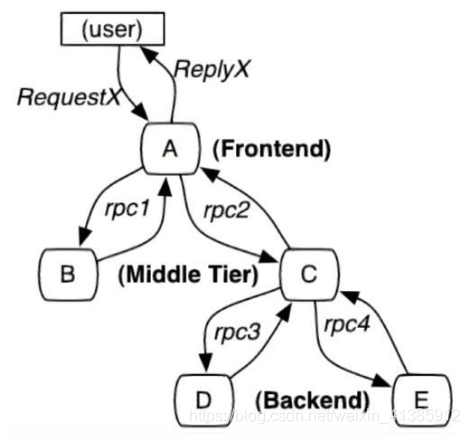
如图示:一个稍微复杂的微服务架构
如果有用户反馈某个页面很慢,我们知道这个页面的请求调用链是 A -----> C -----> B -----> D,此时如何定位可能是哪个模块引起的问题。每个服务 Service A,B,C,D 都有好几台机器。怎么知道某个请求调用了服务的具体哪台机器呢?

可以明显看到,由于无法准确定位每个请求经过的确切路径,在微服务这种架构下有以下几个痛点
-
排查问题难度大,周期长
-
特定场景难复现
-
系统性能瓶颈分析较难
分布式调用链就是为了解决以上几个问题而生,它主要的作用如下
-
自动采取数据
-
分析数据产生完整调用链:有了请求的完整调用链,问题有很大概率可复现
-
数据可视化:每个组件的性能可视化,能帮助我们很好地定位系统的瓶颈,及时找出问题所在
通过分布式追踪系统能很好地定位如下请求的每条具体请求链路,从而轻易地实现请求链路追踪,每个模块的性能瓶颈定位与分析。
分布式调用链标准 - OpenTracing
知道了分布式调用链的作用,那我们来看下如何实现分布式调用链的实现及原理, 首先为了解决不同的分布式追踪系统 API 不兼容的问题,诞生了 OpenTracing 规范,OpenTracing 是一个轻量级的标准化层,它位于应用程序/类库和追踪或日志分析程序之间。
 这样 OpenTracing 通过提供平台无关,厂商无关的 API,使得开发人员能够方便地添加追踪系统的实现。
说到这大家是否想过 Java 中类似的实现?还记得 JDBC 吧,通过提供一套标准的接口让各个厂商去实现,程序员即可面对接口编程,不用关心具体的实现。这里的接口其实就是标准,所以制定一套标准非常重要,可以实现组件的可插拔。

接下来我们来看 OpenTracing 的数据模型,主要有以下三个
-
Trace:一个完整请求链路
-
Span:一次调用过程(需要有开始时间和结束时间)
-
SpanContext:Trace 的全局上下文信息, 如里面有traceId
理解这三个概念非常重要,为了让大家更好地理解这三个概念,我特意画了一张图
如图示,一次下单的完整请求完整就是一个 Trace, 显然对于这个请求来说,必须要有一个全局标识来标识这一个请求,每一次调用就称为一个 Span,每一次调用都要带上全局的 TraceId, 这样才可把全局 TraceId 与每个调用关联起来,这个 TraceId 就是通过 SpanContext 传输的,既然要传输显然都要遵循协议来调用。如图示,我们把传输协议比作车,把 SpanContext 比作货,把 Span 比作路应该会更好理解一些。
理解了这三个概念,接下来我看看分布式追踪系统如何采集统一图中的微服务调用链

我们可以看到底层有一个 Collector 一直在默默无闻地收集数据,那么每一次调用 Collector 会收集哪些信息呢。
-
全局 trace_id:这是显然的,这样才能把每一个子调用与最初的请求关联起来
-
span_id: 图中的 0,1,1.1,2,这样就能标识是哪一个调用
-
parent_span_id:比如 b 调用 d 的 span_id 是 1.1,那么它的 parent_span_id 即为 a 调用 b 的 span_id 即 1,这样才能把两个紧邻的调用关联起来。
有了这些信息,Collector 收集的每次调用的信息如下

根据这些图表信息显然可以据此来画出调用链的可视化视图如下

于是一个完整的分布式追踪系统就实现了。
以上实现看起来确实简单,但有以下几个问题需要我们仔细思考一下
-
怎么自动采集 span 数据:自动采集,对业务代码无侵入
-
如何跨进程传递 context
-
traceId 如何保证全局唯一
-
请求量这么多采集会不会影响性能
接下我来看看 SkyWalking 是如何解决以上四个问题的
怎么自动采集 span 数据
SkyWalking 采用了插件化 + javaagent 的形式来实现了 span 数据的自动采集,这样可以做到对代码的 无侵入性,插件化意味着可插拔,扩展性好(后文会介绍如何定义自己的插件)

如何跨进程传递 context
我们知道数据一般分为 header 和 body, 就像 http 有 header 和 body, RocketMQ 也有 MessageHeader,Message Body, body 一般放着业务数据,所以不宜在 body 中传递 context,应该在 header 中传递 context,如图示
 dubbo 中的 attachment 就相当于 header ,所以我们把 context 放在 attachment 中,这样就解决了 context 的传递问题。
 小提示:这里的传递 context 流程均是在 dubbo plugin 处理的,业务无感知,这个 plugin 是怎么实现的呢,下文会分析
traceId 如何保证全局唯一
要保证全局唯一 ,我们可以采用分布式或者本地生成的 ID,使用分布式话需要有一个发号器,每次请求都要先请求一下发号器,会有一次网络调用的开销,所以 SkyWalking 最终采用了本地生成 ID 的方式,它采用了大名鼎鼎的 snowflow 算法,性能很高。
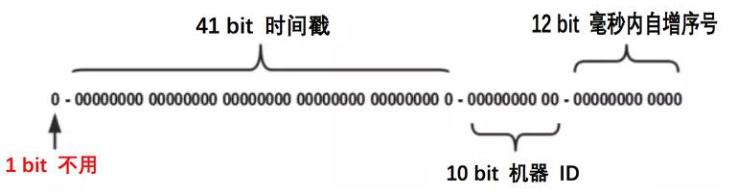
图示: snowflake 算法生成的 id
不过 snowflake 算法有一个众所周知的问题:时间回拨,这个问题可能会导致生成的 id 重复。那么 SkyWalking 是如何解决时间回拨问题的呢。
 每生成一个 id,都会记录一下生成 id 的时间(lastTimestamp),如果发现当前时间比上一次生成 id 的时间(lastTimestamp)还小,那说明发生了时间回拨,此时会生成一个随机数来作为 traceId。这里可能就有同学要较真了,可能会觉得生成的这个随机数也会和已生成的全局 id 重复,是否再加一层校验会好点。
这里要说一下系统设计上的方案取舍问题了,首先如果针对产生的这个随机数作唯一性校验无疑会多一层调用,会有一定的性能损耗,但其实时间回拨发生的概率很小(发生之后由于机器时间紊乱,业务会受到很大影响,所以机器时间的调整必然要慎之又慎),再加上生成的随机数重合的概率也很小,综合考虑这里确实没有必要再加一层全局惟一性校验。对于技术方案的选型,一定要避免过度设计,过犹不及。
请求量这么多,全部采集会不会影响性能?
如果对每个请求调用都采集,那毫无疑问数据量会非常大,但反过来想一下,是否真的有必要对每个请求都采集呢,其实没有必要,我们可以设置采样频率,只采样部分数据,SkyWalking 默认设置了 3 秒采样 3 次,其余请求不采样,如图示
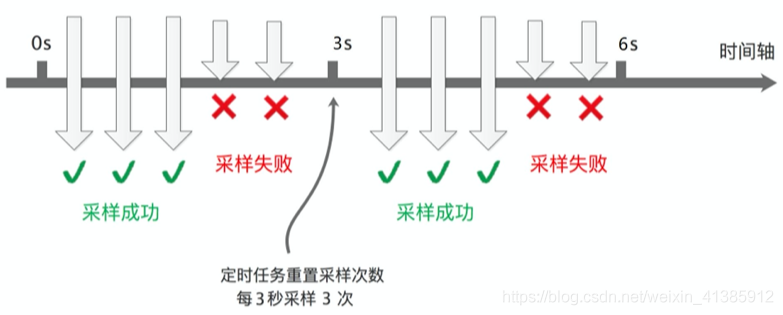
这样的采样频率其实足够我们分析组件的性能了,按 3 秒采样 3 次这样的频率来采样数据会有啥问题呢。理想情况下,每个服务调用都在同一个时间点(如下图示)这样的话每次都在同一时间点采样确实没问题

但在生产上,每次服务调用基本不可能都在同一时间点调用,因为期间有网络调用延时等,实际调用情况很可能是下图这样

这样的话就会导致某些调用在服务 A 上被采样了,在服务 B,C 上不被采样,也就没法分析调用链的性能,那么 SkyWalking 是如何解决的呢。
它是这样解决的:如果上游有携带 Context 过来(说明上游采样了),则下游强制采集数据。这样可以保证链路完整。
SkyWalking 的基础架构
SkyWalking 的基础如下架构,可以说几乎所有的的分布式调用都是由以下几个组件组成的

首先当然是节点数据的定时采样,采样后将数据定时上报,将其存储到 ES, MySQL 等持久化层,有了数据自然而然可根据数据做可视化分析。
SkyWalking 的性能如何
接下来大家肯定比较关心 SkyWalking 的性能,那我们来看下官方的测评数据

图中蓝色代表未使用 SkyWalking 的表现,橙色代表使用了 SkyWalking 的表现,以上是在 TPS 为 5000 的情况下测出的数据,可以看出,不论是 CPU,内存,还是响应时间,使用 SkyWalking 带来的性能损耗几乎可以忽略不计。
接下来我们再来看 SkyWalking 与另一款业界比较知名的分布式追踪工具 Zipkin, Pinpoint 的对比(在采样率为 1 秒 1 个,线程数 500,请求总数为 5000 的情况下做的对比),可以看到在关键的响应时间上, Zipkin(117ms),PinPoint(201ms)远逊色于 SkyWalking(22ms)!
从性能损耗这个指标上看,SkyWalking 完胜!
再看下另一个指标:对代码的侵入性如何,ZipKin 是需要在应用程序中埋点的,对代码的侵入强,而 SkyWalking 采用 javaagent + 插件化这种修改字节码的方式可以做到对代码无任何侵入,除了性能和对代码的侵入性上 SkyWaking 表现不错外,它还有以下优势几个优势
-
对多语言的支持,组件丰富:目前其支持 Java, .Net Core, PHP, NodeJS, Golang, LUA 语言,组件上也支持dubbo, mysql 等常见组件,大部分能满足我们的需求。
-
扩展性:对于不满足的插件,我们按照 SkyWalking 的规则手动写一个即可,新实现的插件对代码无入侵。
SkyWalking 使用
第一步:从skywalking的官网http://skywalking.apache.org/downloads/下载包,包的结构如图。

第二步:启动skywalking收集器服务,启动脚本是E:\apache-skywalking-apm-bin\bin\startup.sh,启动之后我们就可以访问http://localhost:8080/就可以看到skywalking的ui界面了。
第三步:启动项目: 拷贝skywalking-agent目录到所需位置,探针包含整个目录,请不要改变目录结构,可修改agent.config配置agent.application_code=xxl-job为自己的应用名(java agent 博客)
增加JVM启动参数,-javaagent:/path/to/skywalking-agent/skywalking-agent.jar。参数值为skywalking-agent.jar的绝对路径。
通过以上几步之后,我们就可以直接访问我们的项目的接口,看skywalking界面上能否收集到我们的调用信息了。
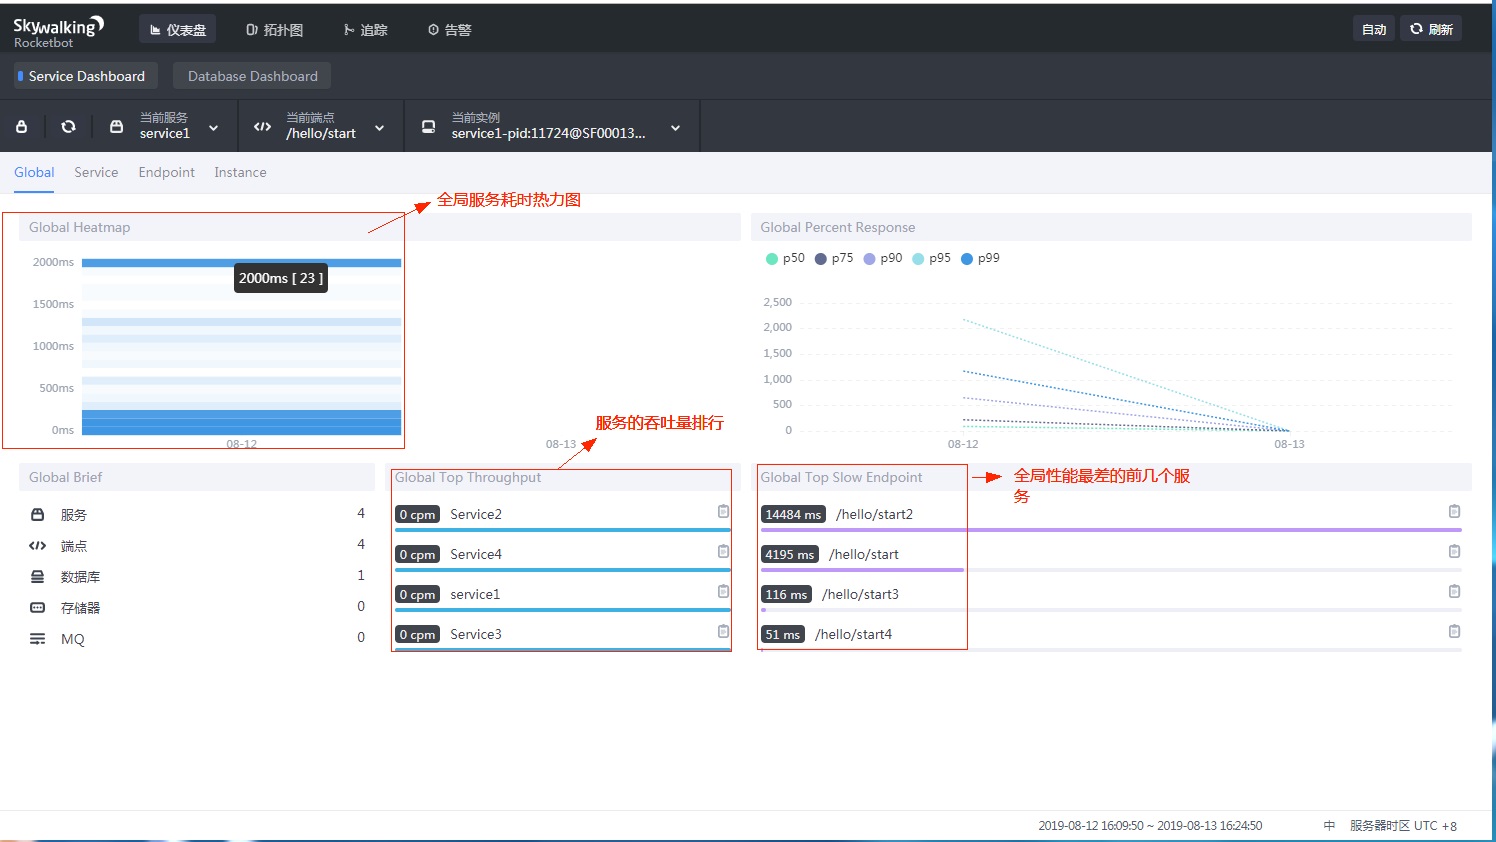
下图为skywalking的首页,主要展示全局的性能信息。
为了验证skywalking具有发现系统拓扑(系统依赖)的功能,启动4个服务,4个服务的接口路径分别为hello/start1,hello/start2,hello/start3,hello/start4,
在服务的依赖关系为: start1依赖start2,start2依赖start3和start4。
访问start1接口,skywalking展示的项目拓扑图如下:

全链路性能跟踪展示页面:

skywalking默认支持调用性能监控的类型有DB(1),RPC_FRAMEWORK(2),HTTP(3),MQ(4),CACHE(5),此外还支持自定义插件来监控未支持的组件。
下面来看下调用dubbo和db的效果:(服务start2中调用db和项目4的dubbo服务)

3.skywalking的traceId与日志组件(log4j,logback,elk等)的集成:
以logback为例,只要在日志配置xml中增加以下配置,则在打印日志的时候,自动把当前上下文中的traceId加入到日志中去。
    <appender name="console" class="ch.qos.logback.core.ConsoleAppender">
        <layout class="org.apache.skywalking.apm.toolkit.log.logback.v1.x.TraceIdPatternLogbackLayout">
             <pattern>
                 %d{yyyy-MM-dd HH:mm:ss} [%thread] %-5level %logger{36} - %tid - %msg%n
             </pattern>
        </layout>
    </appender>
效果如下图所示,链路中的所有节点的traceId是一样的,这样就可以在skywalking上面发现性能差的traceId后,再去日志组件中查看日志是否有异常日志。
服务1中打印的日志:
2019-08-14 16:46:22 [http-nio-9091-exec-1] INFO c.z.s.controller.HelloController - TID:47.34.15657723821280001 - service1 logger with traceId
服务2中打印的日志:
2019-08-14 16:46:24 [http-nio-9092-exec-9] INFO c.z.s.controller.HelloController - TID:47.34.15657723821280001 - service2 logger with traceId
服务3中打印的日志:
2019-08-14 16:46:24 [http-nio-9093-exec-1] INFO c.z.s.controller.HelloController - TID:47.34.15657723821280001 - service3 logger with traceId
服务4中打印的日志:
2019-08-14 16:46:24 [http-nio-9094-exec-1] INFO c.z.s.controller.HelloController - TID:47.34.15657723821280001 - service4 logger with traceId
skywalking告警模块的使用
下图为告警页面的ui界面,可以看到可以从三个维度来监控,分别为服务(service)、服务实例(service instance),端点(endpoint/接口)。
告警规则可以在安装包下的配置文件-(apache-skywalking-apm-bin/config/alarm-settings.yml)中,自由定义。
默认配置监控服务和服务实例,不监控端点,因为 # Active endpoint related metrics alarm will cost more memory than service and service instance metrics alarm.# Because the number of endpoint is much more than service and instance.

下面代码为配置告警规则的代码,skywalking还支持使用者配置告警接口,来及时发送通知,如发送短信/邮件等。如配置文件中的webhooks中。
# Licensed to the Apache Software Foundation (ASF) under one
# or more contributor license agreements.  See the NOTICE file
# distributed with this work for additional information
# regarding copyright ownership.  The ASF licenses this file
# to you under the Apache License, Version 2.0 (the
# "License"); you may not use this file except in compliance
# with the License.  You may obtain a copy of the License at
#
#     http://www.apache.org/licenses/LICENSE-2.0
#
# Unless required by applicable law or agreed to in writing, software
# distributed under the License is distributed on an "AS IS" BASIS,
# WITHOUT WARRANTIES OR CONDITIONS OF ANY KIND, either express or implied.
# See the License for the specific language governing permissions and
# limitations under the License.

# Sample alarm rules.
rules:
  # Rule unique name, must be ended with `_rule`.
  service_resp_time_rule:
    metrics-name: service_resp_time
    op: ">"
    threshold: 1000
    period: 10
    count: 3
    silence-period: 5
    message: Response time of service {name} is more than 1000ms in 3 minutes of last 10 minutes.
  service_sla_rule:
    # Metrics value need to be long, double or int
    metrics-name: service_sla
    op: "<"
    threshold: 8000
    # The length of time to evaluate the metrics
    period: 10
    # How many times after the metrics match the condition, will trigger alarm
    count: 2
    # How many times of checks, the alarm keeps silence after alarm triggered, default as same as period.
    silence-period: 3
    message: Successful rate of service {name} is lower than 80% in 2 minutes of last 10 minutes
  service_p90_sla_rule:
    # Metrics value need to be long, double or int
    metrics-name: service_p90
    op: ">"
    threshold: 1000
    period: 10
    count: 3
    silence-period: 5
    message: 90% response time of service {name} is more than 1000ms in 3 minutes of last 10 minutes
  service_instance_resp_time_rule:
    metrics-name: service_instance_resp_time
    op: ">"
    threshold: 1000
    period: 10
    count: 2
    silence-period: 5
    message: Response time of service instance {name} is more than 1000ms in 2 minutes of last 10 minutes
#  Active endpoint related metrics alarm will cost more memory than service and service instance metrics alarm.
#  Because the number of endpoint is much more than service and instance.
#
  endpoint_avg_rule:
    metrics-name: endpoint_avg
    op: ">"
    threshold: 1000
    period: 10
    count: 2
    silence-period: 5
    message: Response time of endpoint {name} is more than 1000ms in 2 minutes of last 10 minutes

#webhooks:
#  - http://127.0.0.1/notify/
#  - http://127.0.0.1/go-wechat/
skywalking的原理
skywalaking总体架构分为三部分:
- skywalking-collector:链路数据归集器,数据可以落地ElasticSearch,单机也可以落地H2,不推荐,H2仅作为临时演示用
- skywalking-web:web可视化平台,用来展示落地的数据
- skywalking-agent:探针,用来收集和发送数据到归集器
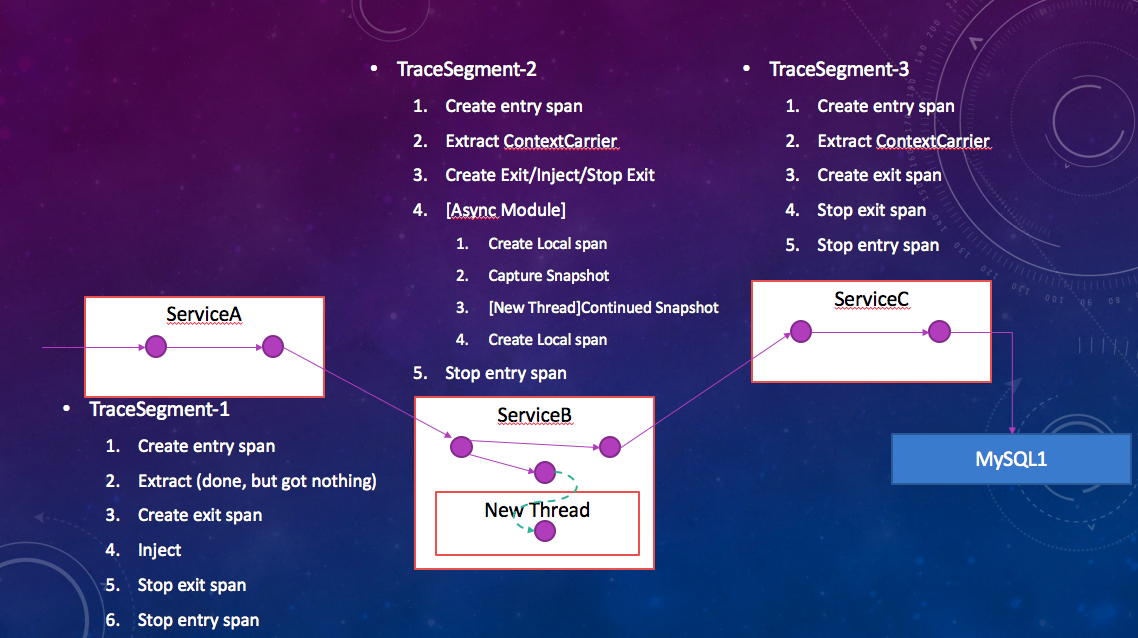
skywalking的核心在于agent部分,下图展示了一次调用跨多个进程里agent的详细的运行过程:
agent支持多种客户端和服务端,支持的插件明细:--->https://github.com/apache/skywalking/blob/master/docs/en/setup/service-agent/java-agent/Supported-list.md
以拦截dubbo请求为例,skywalking的dubbo拦截插件实现的代码实现:
源码使用的是拦截dubbo中的MonitorFilter这个类中的invoke方法。具体如DubboInterceptor所示,通过获取dubbo的上下文RpcContext先对消费者调用之前加入sky walking的跨进程协议header信息sw:traceId,然后到生产者取出。
package org.apache.skywalking.apm.plugin.dubbo;
public class DubboInstrumentation extends ClassInstanceMethodsEnhancePluginDefine {

    private static final String ENHANCE_CLASS = "com.alibaba.dubbo.monitor.support.MonitorFilter";
    private static final String INTERCEPT_CLASS = "org.apache.skywalking.apm.plugin.dubbo.DubboInterceptor";

    @Override
    protected ClassMatch enhanceClass() {
        return NameMatch.byName(ENHANCE_CLASS);
    }

    @Override
    public ConstructorInterceptPoint[] getConstructorsInterceptPoints() {
        return null;
    }

    @Override
    public InstanceMethodsInterceptPoint[] getInstanceMethodsInterceptPoints() {
        return new InstanceMethodsInterceptPoint[] {
            new InstanceMethodsInterceptPoint() {
                @Override
                public ElementMatcher<MethodDescription> getMethodsMatcher() {
                    return named("invoke");
                }

                @Override
                public String getMethodsInterceptor() {
                    return INTERCEPT_CLASS;
                }

                @Override
                public boolean isOverrideArgs() {
                    return false;
                }
            }
        };
    }
}
以下代码为Dubbo拦截器的实现:
package org.apache.skywalking.apm.plugin.dubbo;

import com.alibaba.dubbo.common.URL;
import com.alibaba.dubbo.rpc.Invocation;
import com.alibaba.dubbo.rpc.Invoker;
import com.alibaba.dubbo.rpc.Result;
import com.alibaba.dubbo.rpc.RpcContext;
import java.lang.reflect.Method;
import org.apache.skywalking.apm.agent.core.context.ContextCarrier;
import org.apache.skywalking.apm.agent.core.context.tag.Tags;
import org.apache.skywalking.apm.agent.core.context.CarrierItem;
import org.apache.skywalking.apm.agent.core.context.ContextManager;
import org.apache.skywalking.apm.agent.core.context.trace.AbstractSpan;
import org.apache.skywalking.apm.agent.core.context.trace.SpanLayer;
import org.apache.skywalking.apm.agent.core.plugin.interceptor.enhance.EnhancedInstance;
import org.apache.skywalking.apm.agent.core.plugin.interceptor.enhance.InstanceMethodsAroundInterceptor;
import org.apache.skywalking.apm.agent.core.plugin.interceptor.enhance.MethodInterceptResult;
import org.apache.skywalking.apm.network.trace.component.ComponentsDefine;

/**
 * {@link DubboInterceptor} define how to enhance class {@link com.alibaba.dubbo.monitor.support.MonitorFilter#invoke(Invoker,
 * Invocation)}. the trace context transport to the provider side by {@link RpcContext#attachments}.but all the version
 * of dubbo framework below 2.8.3 don't support {@link RpcContext#attachments}, we support another way to support it.
 *
 * @author zhangxin
 */
public class DubboInterceptor implements InstanceMethodsAroundInterceptor {
    /**
     * <h2>Consumer:</h2> The serialized trace context data will
     * inject to the {@link RpcContext#attachments} for transport to provider side.
     * <p>
     * <h2>Provider:</h2> The serialized trace context data will extract from
     * {@link RpcContext#attachments}. current trace segment will ref if the serialize context data is not null.
     */
    @Override
    public void beforeMethod(EnhancedInstance objInst, Method method, Object[] allArguments,
        Class<?>[] argumentsTypes, MethodInterceptResult result) throws Throwable {
        Invoker invoker = (Invoker)allArguments[0];
        Invocation invocation = (Invocation)allArguments[1];
        RpcContext rpcContext = RpcContext.getContext();
        boolean isConsumer = rpcContext.isConsumerSide();
        URL requestURL = invoker.getUrl();

        AbstractSpan span;

        final String host = requestURL.getHost();
        final int port = requestURL.getPort();
        if (isConsumer) {
            final ContextCarrier contextCarrier = new ContextCarrier();
            span = ContextManager.createExitSpan(generateOperationName(requestURL, invocation), contextCarrier, host + ":" + port);
            //invocation.getAttachments().put("contextData", contextDataStr);
            //@see https://github.com/alibaba/dubbo/blob/dubbo-2.5.3/dubbo-rpc/dubbo-rpc-api/src/main/java/com/alibaba/dubbo/rpc/RpcInvocation.java#L154-L161
            CarrierItem next = contextCarrier.items();
            while (next.hasNext()) {
                next = next.next();
                rpcContext.getAttachments().put(next.getHeadKey(), next.getHeadValue());
            }
        } else {
            ContextCarrier contextCarrier = new ContextCarrier();
            CarrierItem next = contextCarrier.items();
            while (next.hasNext()) {
                next = next.next();
                next.setHeadValue(rpcContext.getAttachment(next.getHeadKey()));
            }

            span = ContextManager.createEntrySpan(generateOperationName(requestURL, invocation), contextCarrier);
        }

        Tags.URL.set(span, generateRequestURL(requestURL, invocation));
        span.setComponent(ComponentsDefine.DUBBO);
        SpanLayer.asRPCFramework(span);
    }

    @Override
    public Object afterMethod(EnhancedInstance objInst, Method method, Object[] allArguments,
        Class<?>[] argumentsTypes, Object ret) throws Throwable {
        Result result = (Result)ret;
        if (result != null && result.getException() != null) {
            dealException(result.getException());
        }

        ContextManager.stopSpan();
        return ret;
    }

    @Override
    public void handleMethodException(EnhancedInstance objInst, Method method, Object[] allArguments,
        Class<?>[] argumentsTypes, Throwable t) {
        dealException(t);
    }

    /**
     * Log the throwable, which occurs in Dubbo RPC service.
     */
    private void dealException(Throwable throwable) {
        AbstractSpan span = ContextManager.activeSpan();
        span.errorOccurred();
        span.log(throwable);
    }

    /**
     * Format operation name. e.g. org.apache.skywalking.apm.plugin.test.Test.test(String)
     *
     * @return operation name.
     */
    private String generateOperationName(URL requestURL, Invocation invocation) {
        StringBuilder operationName = new StringBuilder();
        operationName.append(requestURL.getPath());
        operationName.append("." + invocation.getMethodName() + "(");
        for (Class<?> classes : invocation.getParameterTypes()) {
            operationName.append(classes.getSimpleName() + ",");
        }

        if (invocation.getParameterTypes().length > 0) {
            operationName.delete(operationName.length() - 1, operationName.length());
        }

        operationName.append(")");

        return operationName.toString();
    }

    /**
     * Format request url.
     * e.g. dubbo://127.0.0.1:20880/org.apache.skywalking.apm.plugin.test.Test.test(String).
     *
     * @return request url.
     */
    private String generateRequestURL(URL url, Invocation invocation) {
        StringBuilder requestURL = new StringBuilder();
        requestURL.append(url.getProtocol() + "://");
        requestURL.append(url.getHost());
        requestURL.append(":" + url.getPort() + "/");
        requestURL.append(generateOperationName(url, invocation));
        return requestURL.toString();
    }
}
在调用结束后结束,把span的详情信息发送给collector(数据收集器).具体实现在类org.apache.skywalking.apm.agent.core.context.TracingContext的stopSpan(AbstractSpan span)方法,
下面是stopSpan的具体实现方法:
@Override
    public boolean stopSpan(AbstractSpan span) {
        AbstractSpan lastSpan = peek();
        if (lastSpan == span) {
            if (lastSpan instanceof AbstractTracingSpan) {
                AbstractTracingSpan toFinishSpan = (AbstractTracingSpan)lastSpan;
                if (toFinishSpan.finish(segment)) {
                    pop();
                }
            } else {
                pop();
            }
        } else {
            throw new IllegalStateException("Stopping the unexpected span = " + span);
        }

        finish();

        return activeSpanStack.isEmpty();
    }
具体发送数据的逻辑在finish方法中
/**
     * Finish this context, and notify all {@link TracingContextListener}s, managed by {@link
     * TracingContext.ListenerManager}
     */
    private void finish() {
        if (isRunningInAsyncMode) {
            asyncFinishLock.lock();
        }
        try {
            if (activeSpanStack.isEmpty() && running && (!isRunningInAsyncMode || asyncSpanCounter.get() == 0)) {
                TraceSegment finishedSegment = segment.finish(isLimitMechanismWorking());
                /*
                 * Recheck the segment if the segment contains only one span.
                 * Because in the runtime, can't sure this segment is part of distributed trace.
                 *
                 * @see {@link #createSpan(String, long, boolean)}
                 */
                if (!segment.hasRef() && segment.isSingleSpanSegment()) {
                    if (!samplingService.trySampling()) {
                        finishedSegment.setIgnore(true);
                    }
                }

                /*
                 * Check that the segment is created after the agent (re-)registered to backend,
                 * otherwise the segment may be created when the agent is still rebooting and should
                 * be ignored
                 */
                if (segment.createTime() < RemoteDownstreamConfig.Agent.INSTANCE_REGISTERED_TIME) {
                    finishedSegment.setIgnore(true);
                }

                TracingContext.ListenerManager.notifyFinish(finishedSegment); //通知监控追踪容器的监听者,监听者会把数据发送给collector.

                running = false;
            }
        } finally {
            if (isRunningInAsyncMode) {
                asyncFinishLock.unlock();
            }
        }
    }
5.skywalking的限制
Just effect frameworks or libraries.
Because of the changing codes by agents, it also means the codes are already known by agent plugin developers.
 So, there is always a supported list in this kind of probes. Like SkyWalking Java agent supported list.

Across thread can't be supported all the time.
Like we said about in process propagation, most codes run in a single thread per request, especially business codes.
But in some other scenarios, they do things in different threads, such as job assignment, task pool or batch process.
Or some languages provide coroutine or similar thing like Goroutine, then developer could run async process with low payload, even been encouraged. In those cases, auto instrument will face problems.
1.只支持已知的代理,如果使用的中间件还未被支持,需要自己写插件。
2.跨线程的场景不支持自动代理,比如任务分配,任务池,批处理的场景。