#!/usr/bin/env python3
from mpl_toolkits.mplot3d import Axes3D
from matplotlib import cm
from matplotlib.ticker import LinearLocator, FormatStrFormatter
import matplotlib.pyplot as plt
import numpy as np
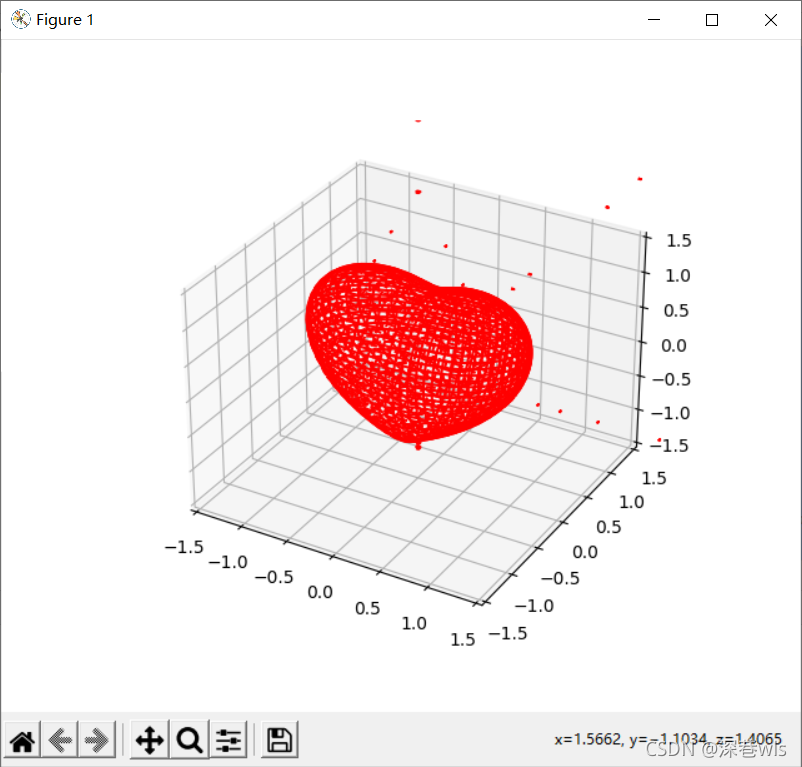
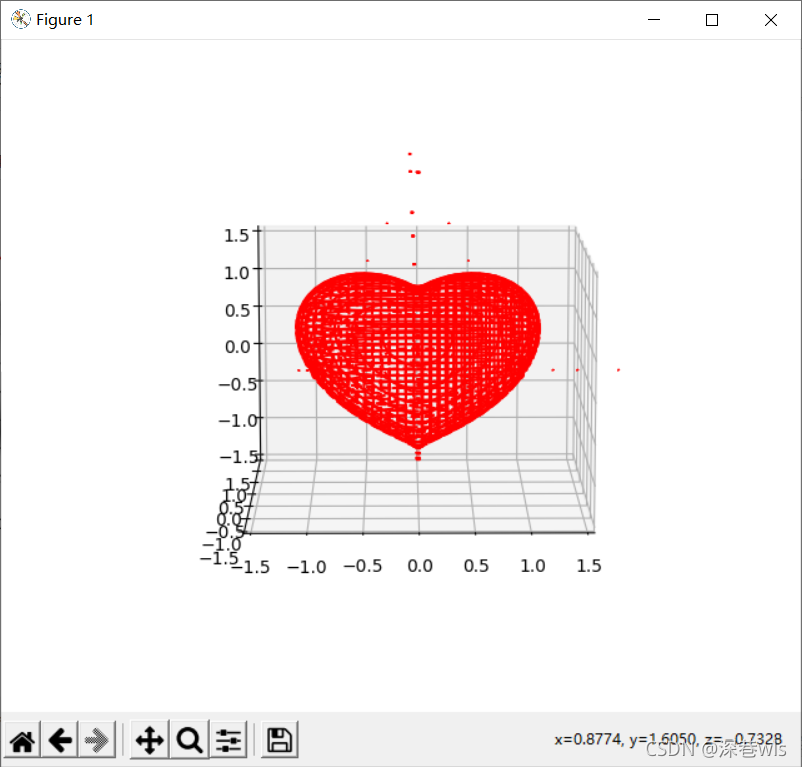
def heart_3d(x,y,z):
return (x**2+(9/4)*y**2+z**2-1)**3-x**2*z**3-(9/80)*y**2*z**3
def plot_implicit(fn, bbox=(-1.5, 1.5)):
''' create a plot of an implicit function
fn ...implicit function (plot where fn==0)
bbox ..the x,y,and z limits of plotted interval'''
xmin, xmax, ymin, ymax, zmin, zmax = bbox*3
fig = plt.figure()
ax = fig.add_subplot(111, projection='3d')
A = np.linspace(xmin, xmax, 100) # resolution of the contour
B = np.linspace(xmin, xmax, 40) # number of slices
A1, A2 = np.meshgrid(A, A) # grid on which the contour is plotted
for z in B: # plot contours in the XY plane
X, Y = A1, A2
Z = fn(X, Y, z)
cset = ax.contour(X, Y, Z+z, [z], zdir='z', colors=('r',))
# [z] defines the only level to plot
# for this contour for this value of z
for y in B: # plot contours in the XZ plane
X, Z = A1, A2
Y = fn(X, y, Z)
cset = ax.contour(X, Y+y, Z, [y], zdir='y', colors=('red',))
for x in B: # plot contours in the YZ plane
Y, Z = A1, A2
X = fn(x, Y, Z)
cset = ax.contour(X+x, Y, Z, [x], zdir='x',colors=('red',))
# must set plot limits because the contour will likely extend
# way beyond the displayed level. Otherwise matplotlib extends the plot limits
# to encompass all values in the contour.
ax.set_zlim3d(zmin, zmax)
ax.set_xlim3d(xmin, xmax)
ax.set_ylim3d(ymin, ymax)
plt.show()
if __name__ == '__main__':
plot_implicit(heart_3d)
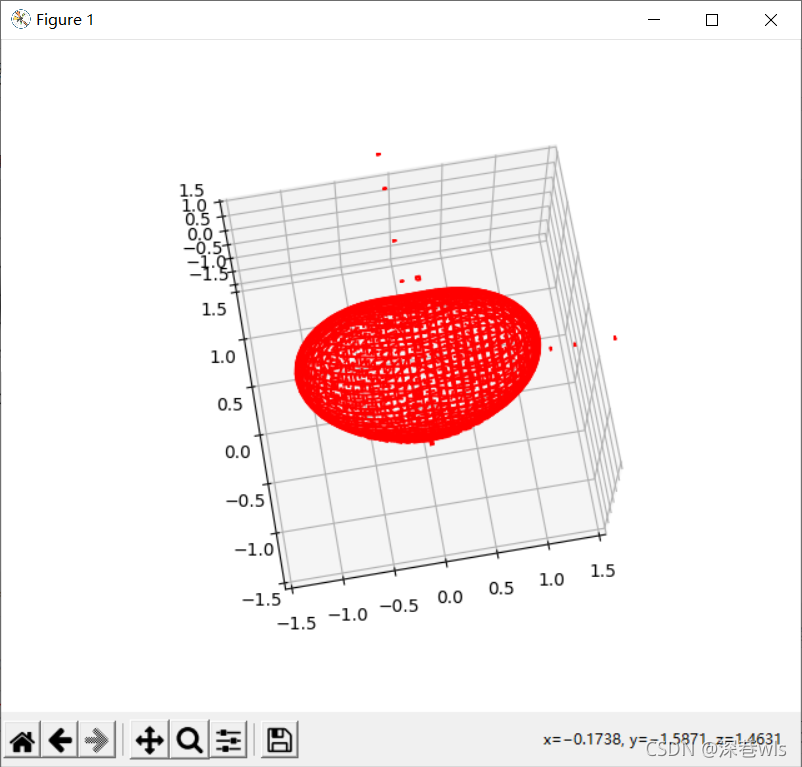
可以用鼠标拖动视角,效果:
快发给你喜欢的人看吧!