图像直方图及二维直方图
直方图代码
void QuickDemo::histogram_demo(Mat &image) {
std::vector<Mat> bgr_plane;
split(image, bgr_plane);
const int channels[1] = {
0 };
const int bins[1] = {
256 };
float hranges[2] = {
0,255 };
const float* ranges[1] = {
hranges };
Mat b_hist;
Mat g_hist;
Mat r_hist;
calcHist(&bgr_plane[0], 1, 0, Mat(), b_hist, 1, bins, ranges);
calcHist(&bgr_plane[1], 1, 0, Mat(), g_hist, 1, bins, ranges);
calcHist(&bgr_plane[2], 1, 0, Mat(), r_hist, 1, bins, ranges);
int hist_w = 512;
int hist_h = 400;
int bin_w = cvRound((double)hist_w / bins[0]);
Mat histImage = Mat::zeros(hist_h, hist_w, CV_8UC3);
normalize(b_hist, b_hist, 0, histImage.rows, NORM_MINMAX, -1, Mat());
normalize(g_hist, g_hist, 0, histImage.rows, NORM_MINMAX, -1, Mat());
normalize(r_hist, r_hist, 0, histImage.rows, NORM_MINMAX, -1, Mat());
for (int i = 1; i < bins[0]; i++) {
line(histImage, Point(bin_w*(i - 1), hist_h - cvRound(b_hist.at<float>(i - 1))),
Point(bin_w*(i), hist_h - cvRound(b_hist.at<float>(i))), Scalar(255, 0, 0), 2, 8, 0);
line(histImage, Point(bin_w*(i - 1), hist_h - cvRound(g_hist.at<float>(i - 1))),
Point(bin_w*(i), hist_h - cvRound(g_hist.at<float>(i))), Scalar(0, 255, 0), 2, 8, 0);
line(histImage, Point(bin_w*(i - 1), hist_h - cvRound(r_hist.at<float>(i - 1))),
Point(bin_w*(i), hist_h - cvRound(r_hist.at<float>(i))), Scalar(0, 0, 255), 2, 8, 0);
}
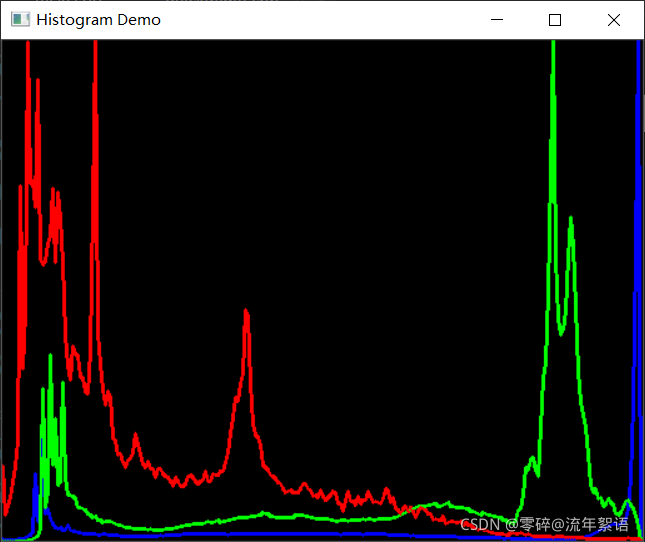
namedWindow("Histogram Demo", WINDOW_AUTOSIZE);
imshow("Histogram Demo", histImage);
}
直方图结果展示
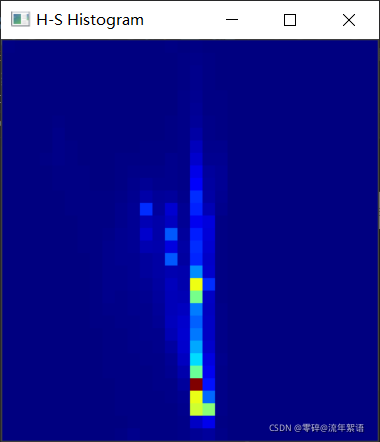
二维直方图代码
void QuickDemo::histogram_2d_demo(Mat &image) {
Mat hsv, hs_hist;
cvtColor(image, hsv, COLOR_BGR2HSV);
int hbins = 30, sbins = 32;
int hist_bins[] = {
hbins, sbins };
float h_range[] = {
0, 180 };
float s_range[] = {
0, 256 };
const float* hs_ranges[] = {
h_range, s_range };
int hs_channels[] = {
0, 1 };
calcHist(&hsv, 1, hs_channels, Mat(), hs_hist, 2, hist_bins, hs_ranges, true, false);
double maxVal = 0;
minMaxLoc(hs_hist, 0, &maxVal, 0, 0);
int scale = 10;
Mat hist2d_image = Mat::zeros(sbins*scale, hbins * scale, CV_8UC3);
for (int h = 0; h < hbins; h++) {
for (int s = 0; s < sbins; s++)
{
float binVal = hs_hist.at<float>(h, s);
int intensity = cvRound(binVal * 255 / maxVal);
rectangle(hist2d_image, Point(h*scale, s*scale),
Point((h + 1)*scale - 1, (s + 1)*scale - 1),
Scalar::all(intensity),
-1);
}
}
applyColorMap(hist2d_image, hist2d_image, COLORMAP_JET);
imshow("H-S Histogram", hist2d_image);
imwrite("D:/hist_2d.png", hist2d_image);
}
二维直方图结果展示