面向对象
python语言是一种面向对象的语言,类的定义和使用都比较简单,未来的这段时间,大家读别人的代码,遇到类的定义和使用的机会应该是比较多的。类的定义和使用的规则如下:
#定义一个类
class People:
	#私有变量的名称前有两个下划线,共有成员没有,函数也一样,以下划线来区分是否是私有的。
	name='null'
	is_man=None
	__age=-1
	__weight=-1
	#每一个成员函数都需要一个self参数,self同java中的this指针,代表的是调用这个函数的对象的本身。
	##构造函数,self是隐性传递的参数,调用这些函数的时候,不必考虑self参数。
	def __init__(self,x):
		self.name=x
people1=People('张三')
people1.is_man=True
people2=People('李四')
people2.is_man=False
class Student(People):
	__password='null'
	id=-1
	#重写构造函数,要求,必须有姓名和id,才可以构造
	def __init__(self,x,y):
		People.__init__(self,x)
		self.id=y
	def set_password(self,x):
		self.__password=x
	def is_right_password(self,x):
		return self.__password==x
#使用Student类
student1=Student('张三',1)
student2=Student('李四',2)
student1.set_password('123')
student2.set_password('456')
if student1.is_right_password('123'):
	print('密码正确')
else:
	print('密码错误')
numpy
numpy是python中常用的一个模块之一,主要提供一些关于代数和向量的类和函数。
numpy提供了非常好的官方文档,遇到什么问题,或者刚开始学习,都可以参考,本网页,主要参考numpy文档中的quick start制作NumPy quickstart — NumPy v1.21 Manual,挑选其中较常用的函数和功能介绍。
使用numpy创建一个数组
#使用numpy模块
import numpy as np
#使用其他类型的数据来构建numpy中的数组
a=np.array([[1,2,3],[4,5,6]])
print(a.ndim,a.shape,a.size,a.dtype,a.itemsize,a.data)
a=np.array([2,3,4])
print(a.ndim,a.shape,a.size,a.dtype,a.itemsize,a.data)
a=np.array([2.3,3.4,4.5])
print(a.ndim,a.shape,a.size,a.dtype,a.itemsize,a.data)
a=np.array([[1.1,2,3],[4,5,6]])
print(a.ndim,a.shape,a.size,a.dtype,a.itemsize,a.data)
a=np.array([[1,2,3],[4,5,6]],dtype=float)
print(a.ndim,a.shape,a.size,a.dtype,a.itemsize,a.data)
a=np.array([(1,2,3),[4,5,6]],dtype=float)
print(a.ndim,a.shape,a.size,a.dtype,a.itemsize,a.data)
#常用的创建一个数组的函数
np.zeros((3,4))
np.ones((3,4))
np.empty((2,3))
np.empty((2,),dtype=np.bool)
np.arange(10,30,5)
np.linspace(0,2,9)
# 还有些不常用的,当大家读到不认识的函数时,百度,看它的文档,慢慢积累,编程的学习就是这样子的。
基本操作
import numpy as np
#加法
a=np.ones((4,2))
b=np.ones((4,2))
print(a+b)
c=np.linspace(0,2,8).reshape((4,2))
print(a+c)
c=np.linspace(0,2,2)
print(a+c)
c=np.linspace(0,2,4).reshape((4,1))
print(a+c)
c=2
print(a+2)
#减法
print(a-b)
print(a-2)
#乘法
a=np.arange(12).reshape((4,3))
b=a
print(a*b)
print(a*2)
print(a**2)
print(a.dot(b.T))
#除法
print(a/b)
print(a/2)
访问、截取numpy数组
import numpy as np
#一维numpy数组的方式,访问的方式基本和列表是一样的
a=np.arange(12)
print(a[2])
print(a[2:5])
print(a[1:7:2])
a[1:7:2]=200
print(a)
print(a[::-1])
for i in a:
	print(i**2)
import numpy as np
#二维数组及以上
a=np.arange(12).reshape((4,3))
print(a[2,2])
print(a[:4,:-1])
print(a[::2,::-1])
a[::2,::2]=300
print(a)
a[::2,::2]=[[10,20],[30,40]]
print(a)
print(a[-1])
print(a[:,2])
#用bool类型来截取数组
import numpy as np
a=np.arange(12).reshape((4,3))
b=a>4
print(a[b])
a[b]=-1
print(a)
用于计算numpy数组的函数
import numpy as np
a=np.arange(12).reshape((4,3))
#e的多少次方,开方,和,最大值,最小值,标准差,方差,相加
print(np.exp(a))
print(np.sqrt(a))
print(np.sum(a))
print(np.max(a))
print(np.min(a))
print(np.std(a))
print(np.var(a))
print(np.add(a,a))
#numpy仍然还提供了很多函数,大家不需要都知道,遇到了,现去百度就可以了,次数多了,常用的就记住了,一次想要把numpy中所有的函数都学会,这样学编程,不好。
用于改变数组形状的函数
import numpy as np
a=np.arange(12).reshape((4,3))
a=a.flatten()
a=a.reshape((3,4))
a=a.ravel()
a.resize((6,2))
用于合并两个数组的函数
import numpy as np
a=np.arange(12).reshape((4,3))
b=np.arange(6).reshape((2,3))
print(np.vstack((a,b)))
b=np.arange(24).reshape((4,6))
print(np.hstack((a,b)))
复制数组
当我们把一个数组赋值给另一个数组时,有两种方式view(shallow copy)和deep copy。
浅复制
当把一个数组赋值给另一个变量时,仅仅是把原数组的一个引用(地址)赋值给了新的变量,而没有为新变量开辟新的数组空间用于存储原数组的数据。
import numpy as np
a=np.arange(12).reshape((4,3))
b=a
b[0,0]=100
c=a.view()
c[0,1]=200
d=a.reshape((3,4))
d[0,3]=300
e=a[:,:-1]
e[1,1]=400
f=a[:]
f[0,2]=500
print(a)
深复制
赋值时,为新的变量开辟一段数组空间,将原数组的所有内存信息,复制给新的变量。两个数组,完全独立。
import numpy as np
a=np.arange(12).reshape((4,3))
b=a.copy()
a[:]=200
print(a,b)
matplotlib
matplotlib是一种在python下画图用的包,它提供了很多画图的函数和策略,最常用的是一种基于matplotlib.pyplot的方式,简洁。
import numpy as np
from matplotlib import pyplot as plt
x = np.arange(1,11)
y =  2  * x +  5
plt.title("Matplotlib demo")
plt.xlabel("x axis caption")
plt.ylabel("y axis caption")
plt.plot(x,y)
plt.show()
在matplotlib官网上的documentation里,有绘制各种各样的图的例子,大家有想画什么图形的时候,可以有针对性地参考。https://matplotlib.org/tutorials/index.html,我挑出常用的几个,介绍一下。
散点图
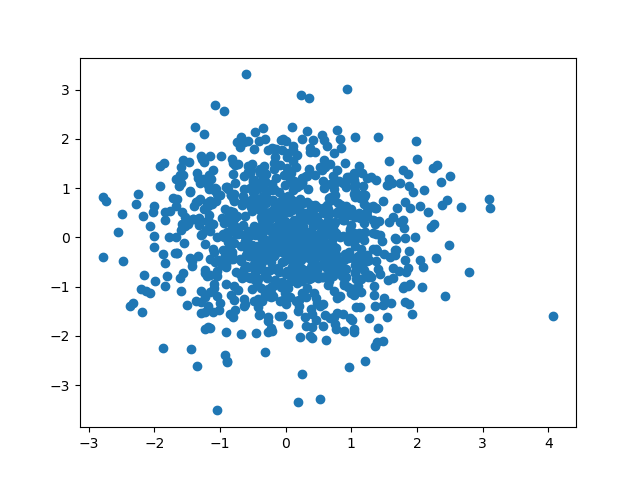
import numpy as np
import matplotlib.pyplot as plt
N = 1000
x = np.random.randn(N)
y = np.random.randn(N)
plt.scatter(x, y)
plt.show()
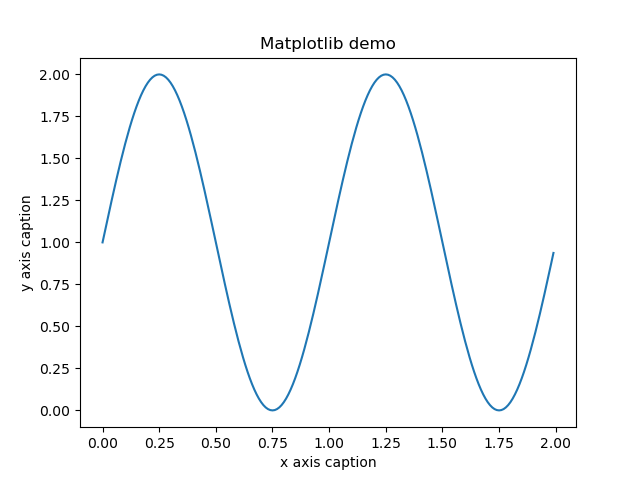
画线
import matplotlib.pyplot as plt
import numpy as np

# Data for plotting
t = np.arange(0.0, 2.0, 0.01)
s = 1 + np.sin(2 * np.pi * t)

plt.plot(t,s)
plt.title("Matplotlib demo")
plt.xlabel("x axis caption")
plt.ylabel("y axis caption")

plt.show()
直方图

import numpy as np
import matplotlib.pyplot as plt

# Fixing random state for reproducibility
np.random.seed(0)

mu, sigma = 100, 15
x = mu + sigma * np.random.randn(10000)

# the histogram of the data
plt.hist(x, 50, density=True, facecolor='g', alpha=0.75)


plt.xlabel('Smarts')
plt.ylabel('Probability')
plt.title('Histogram of IQ')
plt.xlim(40, 160)
plt.ylim(0, 0.03)
plt.grid(True)
plt.show()
柱状图
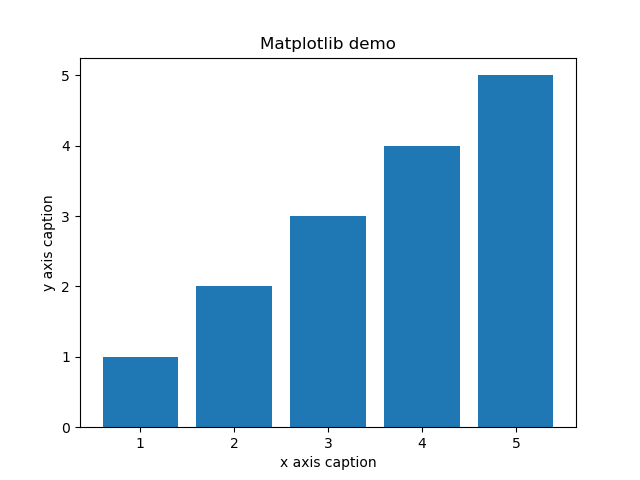
import matplotlib.pyplot as plt
import numpy as np

# Data for plotting
t=np.arange(1,6)
#names=list(map(lambda x:'name%d'%x,t))

plt.bar(t,t)
#plt.bar(names,t,label='a')
#plt.bar(names,np.ones(5),bottom=t,label='b')


#plt.imshow(t,cmap='gray')

plt.title("Matplotlib demo")
plt.xlabel("x axis caption")
plt.ylabel("y axis caption")
#plt.legend()

plt.show()
箱线图
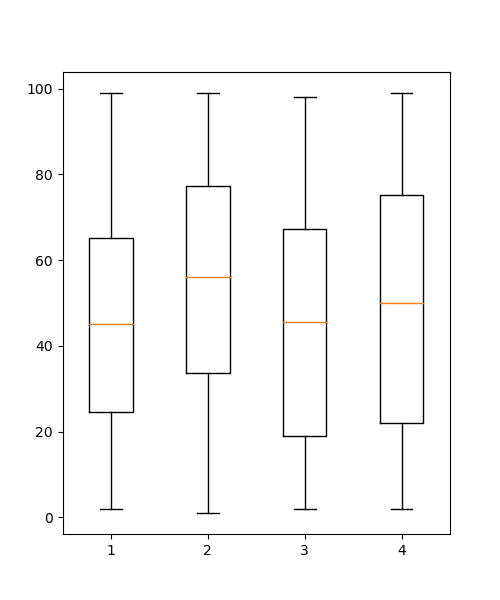
import numpy as np
import matplotlib.pyplot as plt
data=np.random.randint(1,100,400).reshape((100,4))
plt.figure(figsize=(5,6))
plt.boxplot(data)
plt.show()
画图像

import matplotlib.pyplot as plt
import numpy as np

# Data for plotting
t=np.arange(256).reshape((16,16))

plt.imshow(t)
#plt.imshow(t,cmap='gray')

plt.title("Matplotlib demo")
plt.xlabel("x axis caption")
plt.ylabel("y axis caption")

plt.show()
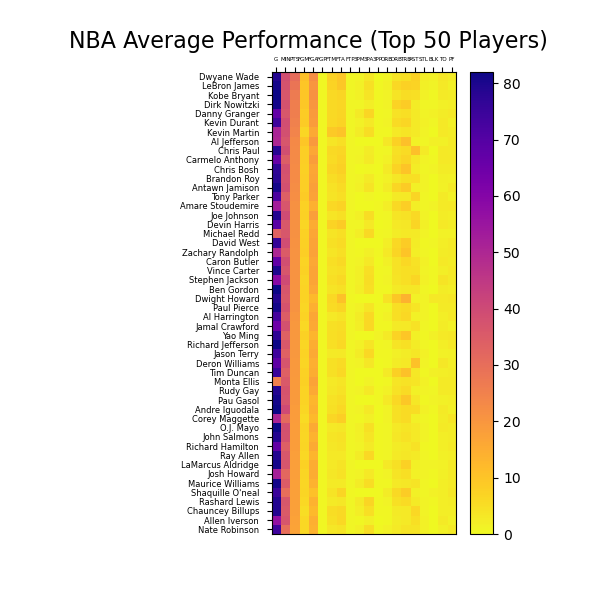
import numpy as np
import pandas as pd
from matplotlib import pyplot as plt
NBA=pd.read_csv(r"http://datasets.flowingdata.com/ppg2008.csv")
fig,ax=plt.subplots(figsize=(6,6))

score=NBA.loc[:,"G":"PF"].values
name=NBA.iloc[:,0]
col=NBA.loc[:,"G":"PF"].columns

im=ax.imshow(score,cmap='plasma_r') #用cmap设置配色方案
ax.xaxis.set_ticks_position('top') #设置x轴刻度到上方
ax.set_xticks(np.arange(len(col))) #设置x轴刻度
ax.set_yticks(np.arange(len(name))) #设置y轴刻度
ax.set_xticklabels(col,fontsize=4) #设置x轴刻度标签
ax.set_yticklabels(name,fontsize=6) #设置y轴刻度标签
fig.colorbar(im,pad=0.03) #设置颜色条
ax.set_title("NBA Average Performance (Top 50 Players)",x=0.2,y=1.034,fontsize=16) #设置标题以及其位置和字体大小

plt.show()

import numpy as np
import matplotlib.pyplot as plt
f=np.load('mnist.npz')
x_train, y_train = f['x_train'], f['y_train']
x_test, y_test = f['x_test'], f['y_test']
plt.imshow(x_train[600],cmap='gray')
plt.show()

import numpy as np
import gzip
import matplotlib.pyplot as plt

paths = [
	'train-labels-idx1-ubyte.gz', 'train-images-idx3-ubyte.gz',
	't10k-labels-idx1-ubyte.gz', 't10k-images-idx3-ubyte.gz'
]
with gzip.open(paths[0], 'rb') as lbpath:
	y_train = np.frombuffer(lbpath.read(), np.uint8, offset=8)

with gzip.open(paths[1], 'rb') as imgpath:
	x_train = np.frombuffer(
	imgpath.read(), np.uint8, offset=16).reshape(len(y_train), 28, 28)

with gzip.open(paths[2], 'rb') as lbpath:
	y_test = np.frombuffer(lbpath.read(), np.uint8, offset=8)

with gzip.open(paths[3], 'rb') as imgpath:
	x_test = np.frombuffer(imgpath.read(), np.uint8, offset=16).reshape(len(y_test), 28, 28)

class_names = ['T-shirt/top', 'Trouser', 'Pullover', 'Dress', 'Coat',
'Sandal', 'Shirt', 'Sneaker', 'Bag', 'Ankle boot']

plt.figure(figsize=(10,10))
for i in range(25):
	plt.subplot(5,5,i+1)
	plt.xticks([])
	plt.yticks([])
	plt.grid(False)
	plt.imshow(x_train[i], cmap=plt.cm.binary)
	plt.xlabel(class_names[y_train[i]])
plt.show()