ELK是Elastic公司推出的开源数据分析框架,目前流行于构建Log/Trace分析平台,该框架主要由三个开源软件Elasticsearch,Logstash和kibana组成,这三者构成数据分析框架的通用范式,即Ingest Pipeline => Database & Indexing => Logical Frontend。
数据分析范式 + 数据存储格式
1. Ingest Pipeline,将原始数据转化为数据库所对应的存储格式。
2. Database & Indexing,以特定格式存储数据并通过外部接口提供数据索引检索功能。
3. Logical Frontend,基于特定逻辑发送数据检索消息并对回馈的数据进行相应的分析处理。
数据存储格式是实现数据库存储功能的关键技术点,传统的关系型数据使用所谓“表类型”的存储方式,这种方式的特点是其“表头(Column)”字段固定且表建立后无法更改,在如今大数据应用的背景下愈发不灵活,因此出现了摒弃“表”的所谓NoSQL数据库,例如MongoDB就使用JSON条目({ xx : yy })替代传统表的Record,Elasticsearch采用MongoDB所使用的“JSON文档”方式,对比下表可以发现Elasticsearch中没有所谓DB的概念,其顶级节点Index直接类似于MySQL的Table以及MongoDB的Collection,于其中存储格式数据即JSON条目,根据Elasticsearch的方案规定,每条JSON记录都要定义其Type和Document ID,分别对应字段_type和_id以用于后期检索,记录数据存放在_source子字段中。
MySQL: DB -> Table <=> Column&Record (TABLE-TYPE)
MongoDB: DB -> Collection <=> { field : value } (JSON-TYPE)
Elasticsearch: Index <=> { _index : xx , _type : xx, _id : xx, _source : { field : value } } {JSON-TYPE}
ELK
Elastic产品的UG内容详实非常实用,用于指导How to do绰绰有余,且软件均基于Java等跨平台语言开发因此无需安装只需配置Java环境下载解压即可运行程序。
https://www.elastic.co/guide/en/logstash/current/index.html
https://www.elastic.co/guide/en/elasticsearch/reference/current/index.html
https://www.elastic.co/guide/en/kibana/current/index.html
1. Logstash
Logstash是对数据处理的管道工具,其中两个必须定义的管道为Input和Output,可选的中间管道为Filter,所以Logstash的数据处理流程即为Source -> Input -> Filter -> Output -> Destination,管道配置可以通过“-e”参数直接在命令行中指定,也可以定义在文件中通过“-f”参数指定文件,管道配置如下所示。
input {
    file { path => "/var/log/syslog" }
    tcp {
        port => 13000
        type => syslog
        }
    udp {
        port => 13000
        type => syslog
        }
}

filter {
    grok {
        match => { "message" => "%{COMBINEDAPACHELOG}" }
         }
    date {
        match => [ "timestamp" , "dd/MMM/yyyy:HH:mm:ss Z" ]
         }
}

output {
    stdout { codec => rubydebug }
    file {
        path => "/home/ce/file"
         }
    elasticsearch { hosts => localhost }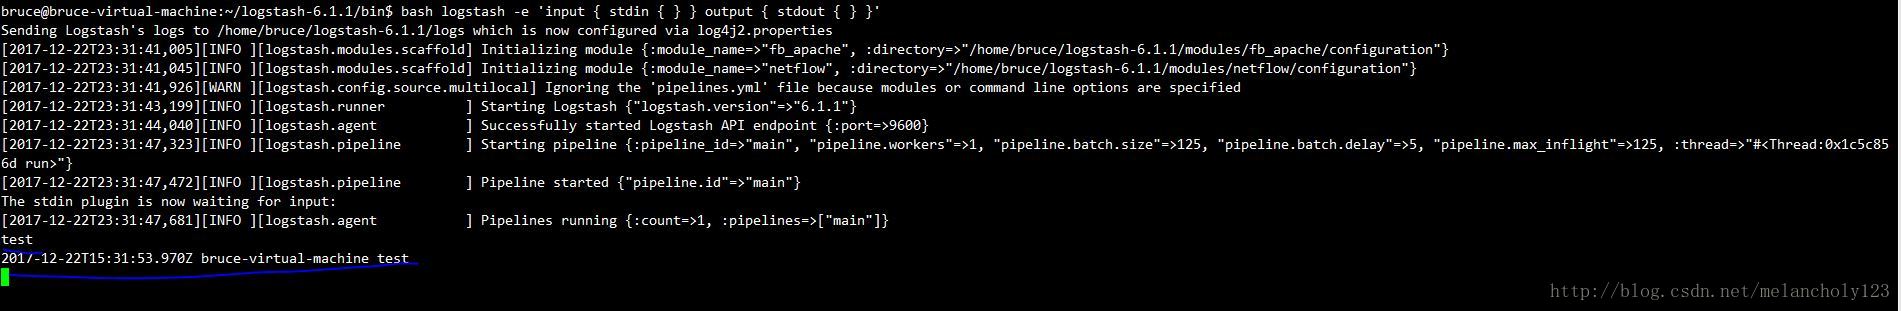
}其中各个管道中子命令都是可选配置,最简单的执行命令是bin/logstash -e 'input { stdin { } } output { stdout { } }'。
2. Elasticsearch
Elasticsearch是数据分析的核心,用于数据的格式化存储以及索引检索,其数据库功能类似于MongoDB使用Index记录若干个JSON条目,其检索功能基于开源项目Lucene并提供基于JSON交互的RESTful接口,下载Elasticsearch软件包解压后直接执行bin/elasticsearch即可运行程序,因对内核性能要求较高所以需要优化内核参数。
sysctl -w vm.max_map_count=262144
#/etc/sysctl.conf
vm.max_map_count=262144
#/etc/security/limits.conf
* soft nofile 65536
* hard nofile 131072
* soft nproc 2048
* hard nproc 4096Elasticsearch启动后默认监听127.0.0.1的9200端口,如需外部流量访问的话就要更改config/elasticsearch.yml中network.host: 0.0.0.0即可通过http://<IP>:9200访问RESTful接口。
curl -XGET 'localhost:9200/_cat/health?v'

curl -XGET 'localhost:9200/_cat/indices?v'

#Data Add
curl -XPUT 'localhost:9200/customer?pretty'

curl -XPUT 'localhost:9200/customer/doc/1?pretty' -H 'Content-Type: application/json' -d'
{ "name": "John Doe" }
'

curl -XPOST 'localhost:9200/customer/doc/_bulk?pretty' -H 'Content-Type: application/json' -d'
{"index":{"_id":"2"}}
{"name": "John Doe", "yesno": "yes", "goodbad": "bad"}
{"index":{"_id":"3"}}
{"name": "Jane Doe" ,"yesno": "yes", "goodbad": "good"}
{"index":{"_id":"4"}}
{"name": "Tom Doe" ,"yesno": "yesd", "goodbad": "goodd"}
'

curl -H 'Content-Type: application/x-ndjson' -XPOST 'localhost:9200/bank/account/_bulk?pretty' --data-binary @accounts.json
###accounts.json###
{"index":{"_id":"1"}}
{"account_number":1,"balance":39225,"firstname":"Amber","lastname":"Duke","age":32,"gender":"M","address":"880 Holmes Lane","employer":"Pyrami","email":"[email protected]","city":"Brogan","state":"IL"}

curl -H 'Content-Type: application/x-ndjson' -XPOST 'localhost:9200/shakespeare/doc/_bulk?pretty' --data-binary @shakespeare_6.0.json
###shakespeare_6.0.json###
{"index":{"_index":"shakespeare","_id":0}}
{"type":"act","line_id":1,"play_name":"Henry IV", "speech_number":"","line_number":"","speaker":"","text_entry":"ACT I"}

curl -H 'Content-Type: application/x-ndjson' -XPOST 'localhost:9200/_bulk?pretty' --data-binary @logs.jsonl
###logs.jsonl###
{"index":{"_index":"logstash-2015.05.18","_type":"log"}}
{"@timestamp":"2015-05-18T09:03:25.877Z","ip":"185.124.182.126","extension":"gif","response":"404","@version":"1"}

#Data Delete
curl -XDELETE 'localhost:9200/customer?pretty'

#Data Get
curl -XGET 'localhost:9200/customer/doc/1?pretty'

#Data Search
curl -XGET 'localhost:9200/_search?pretty' -H 'Content-Type: application/json' -d'
{
    "query": {
        "match_all": {}
    }
}
'

curl -XGET 'http://localhost:9200/_search?pretty' -H 'Content-Type: application/json' -d'
{
"query": {
        "match": {"name":"Jane"}
    }
}
'
3. Kibana
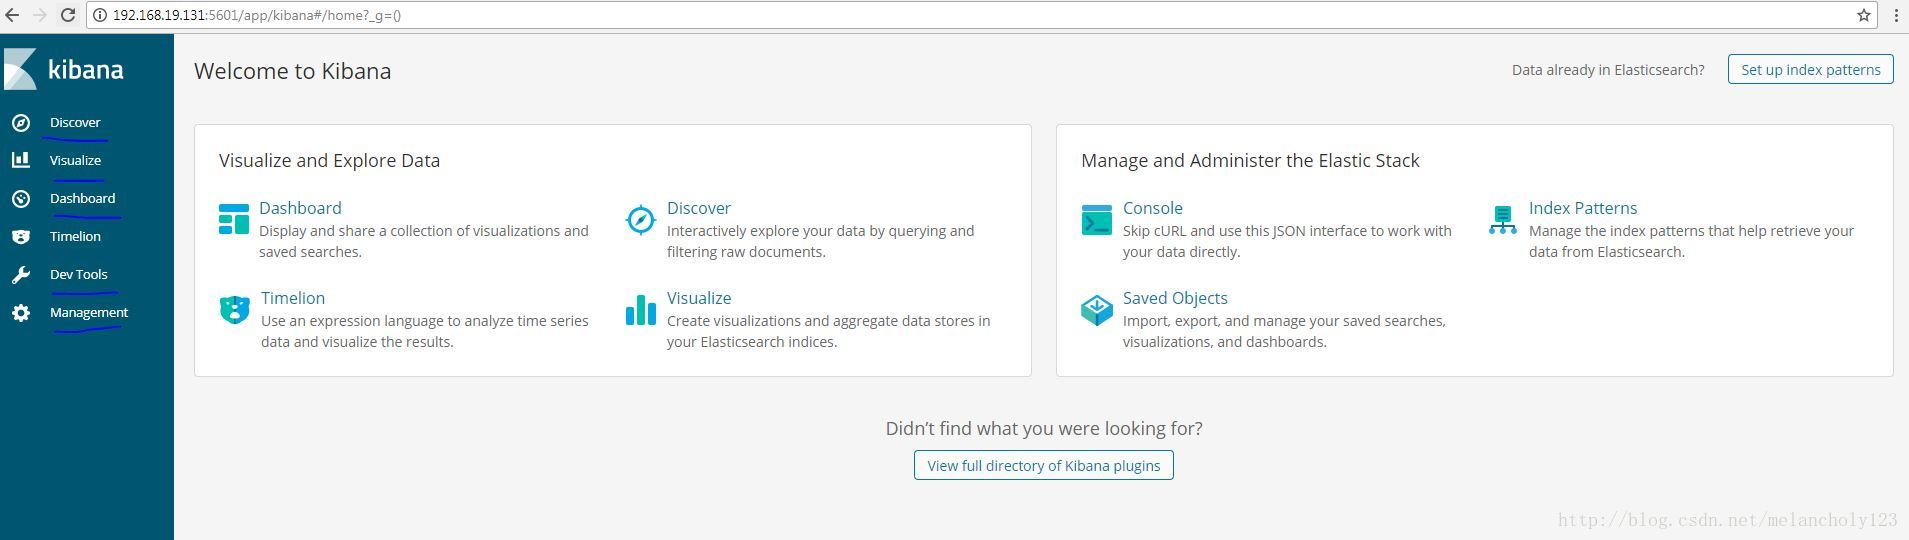
Kibana是架构中的Web前端,用于检索数据并对回馈的数据进行可视化处理,下载软件包解压后首先编辑config/kibana.yml配置文件指定Elasticsearch RESTful接口地址和Kibana Web服务监听IP。
server.host: "0.0.0.0"
elasticsearch.url: "http://localhost:9200"执行bin/kibana启动Kibana服务,默认监听port口为5601,访问http://<ip>:5601即可进入Kibana Web页面。
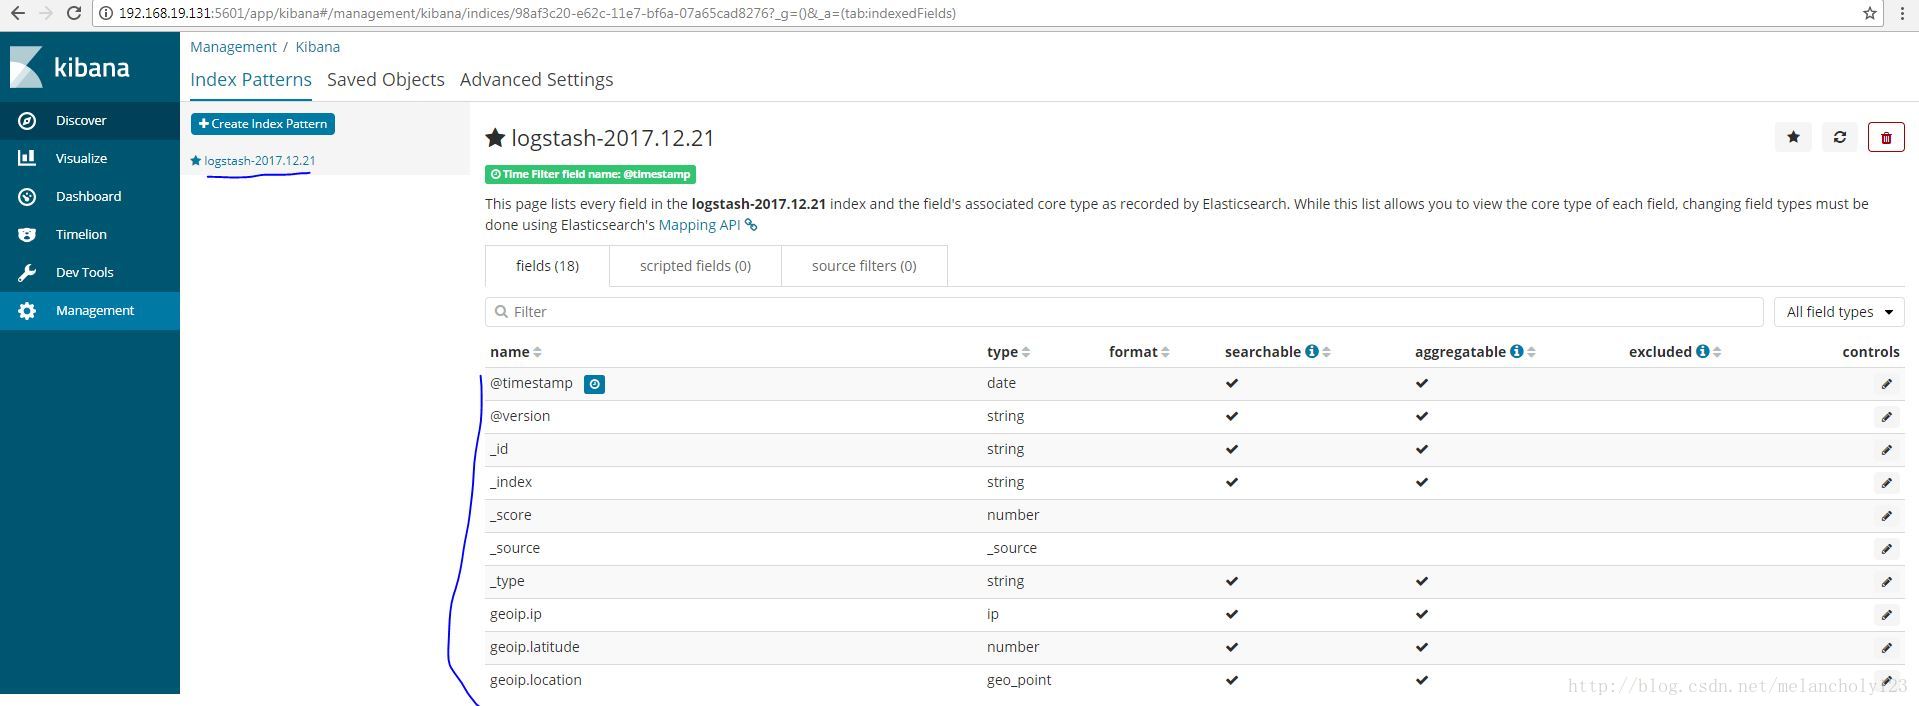
a. Management - Index Patterns
Index Pattern即对Elasticsearch数据库中的Index名称进行匹配,如使用通配符*即可匹配多个Index,建立Index Pattern后对应Index的数据就可以在Discover页面检索到。
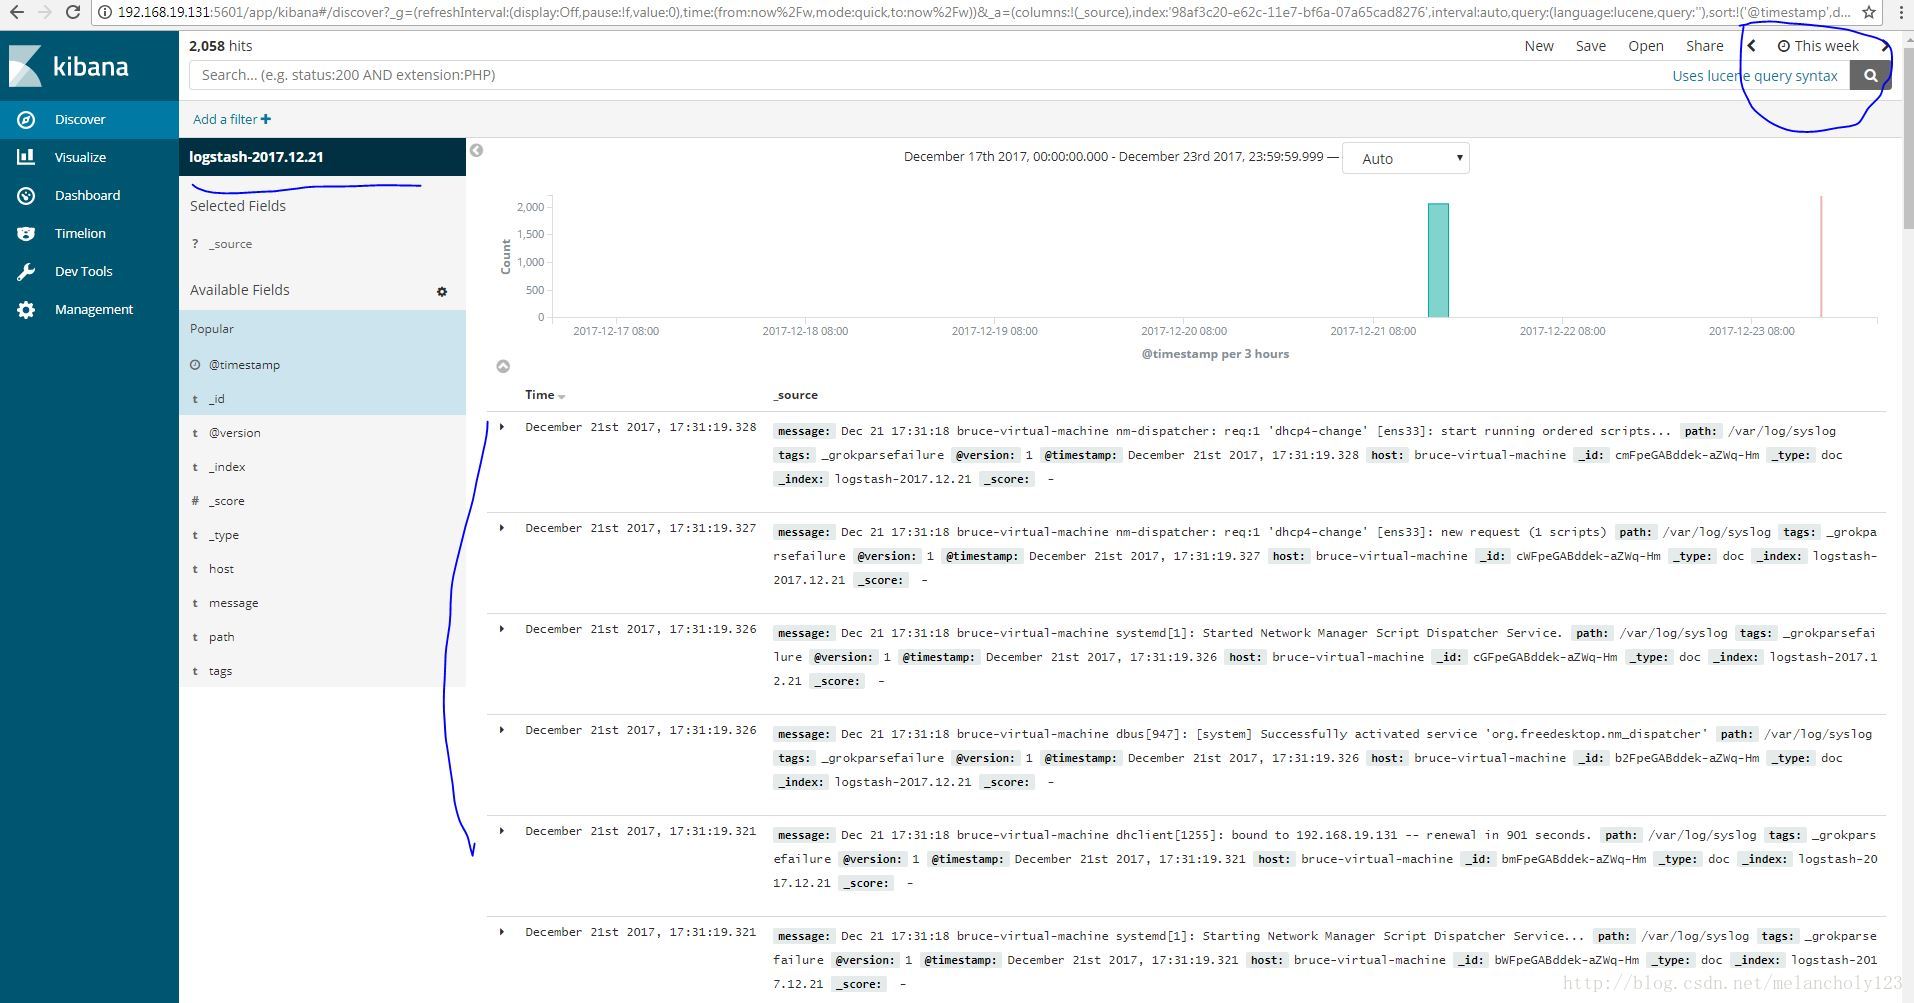
b. Discover
该页面可以显示相应Index中的数据,注意左上角的TimeRange,如果提示No Data Found调整时间范围即可。
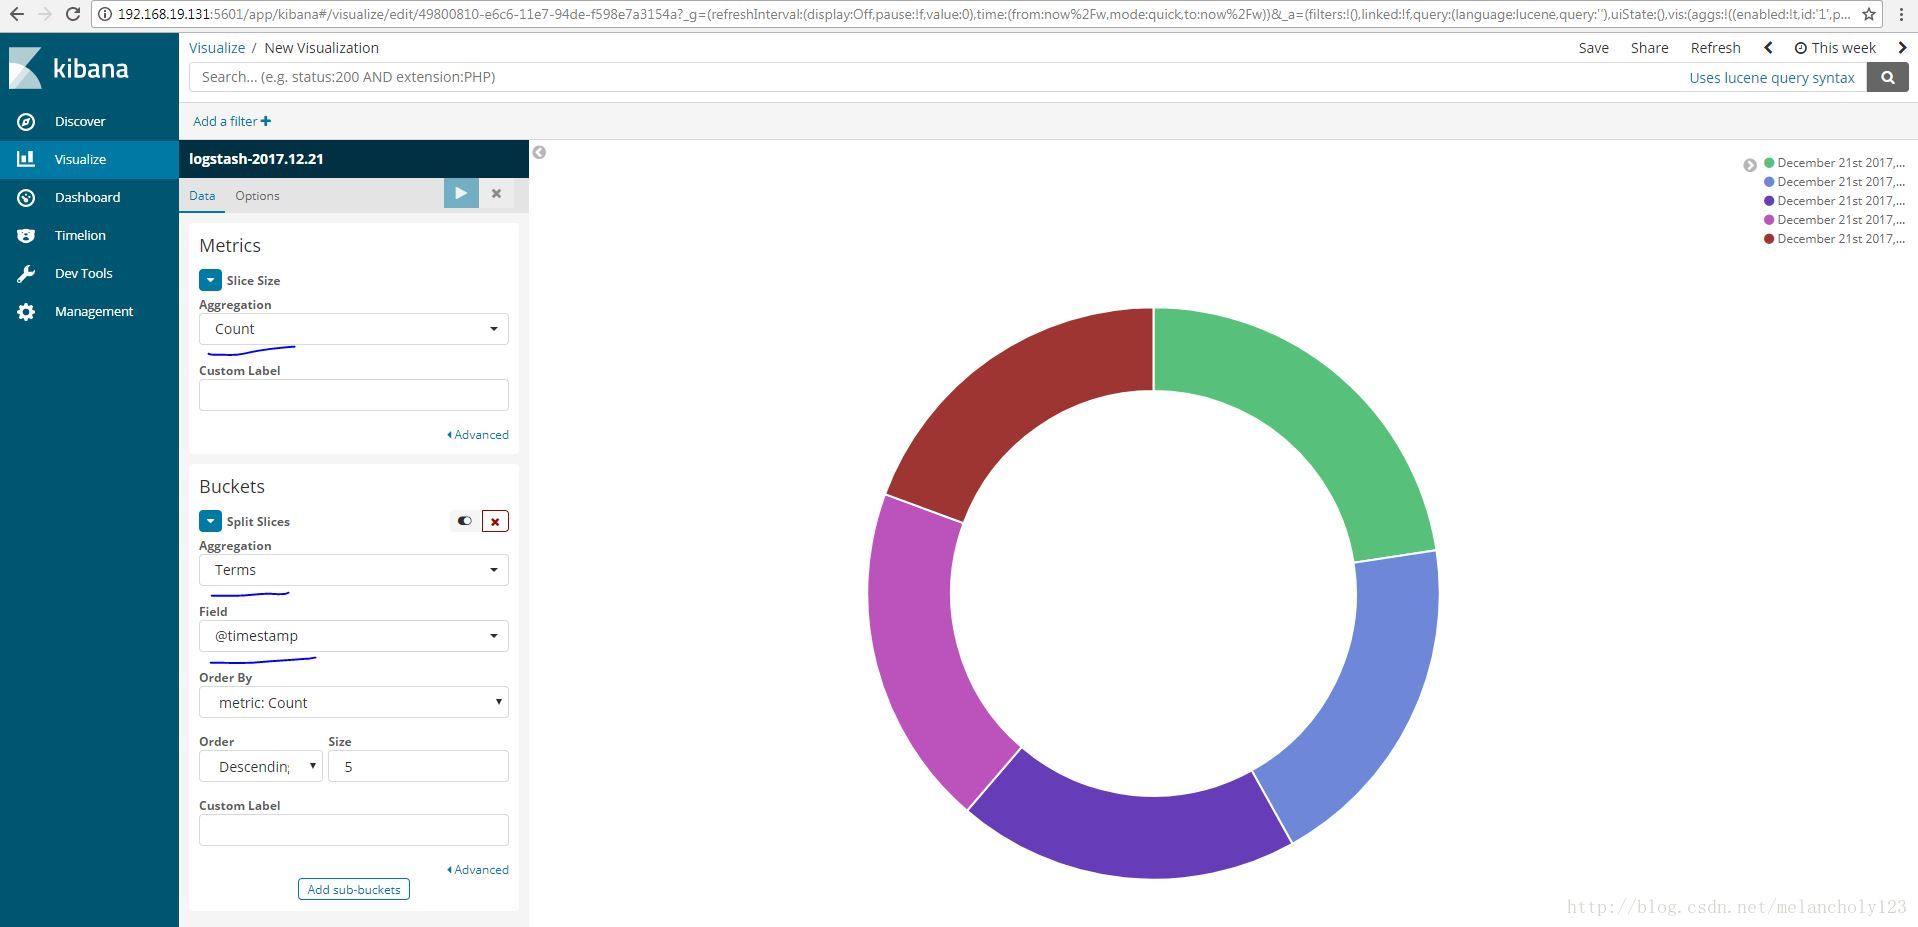
c. Visualize
该页面可以使用Index中某些字段的数据进行绘图,功能比较强大。
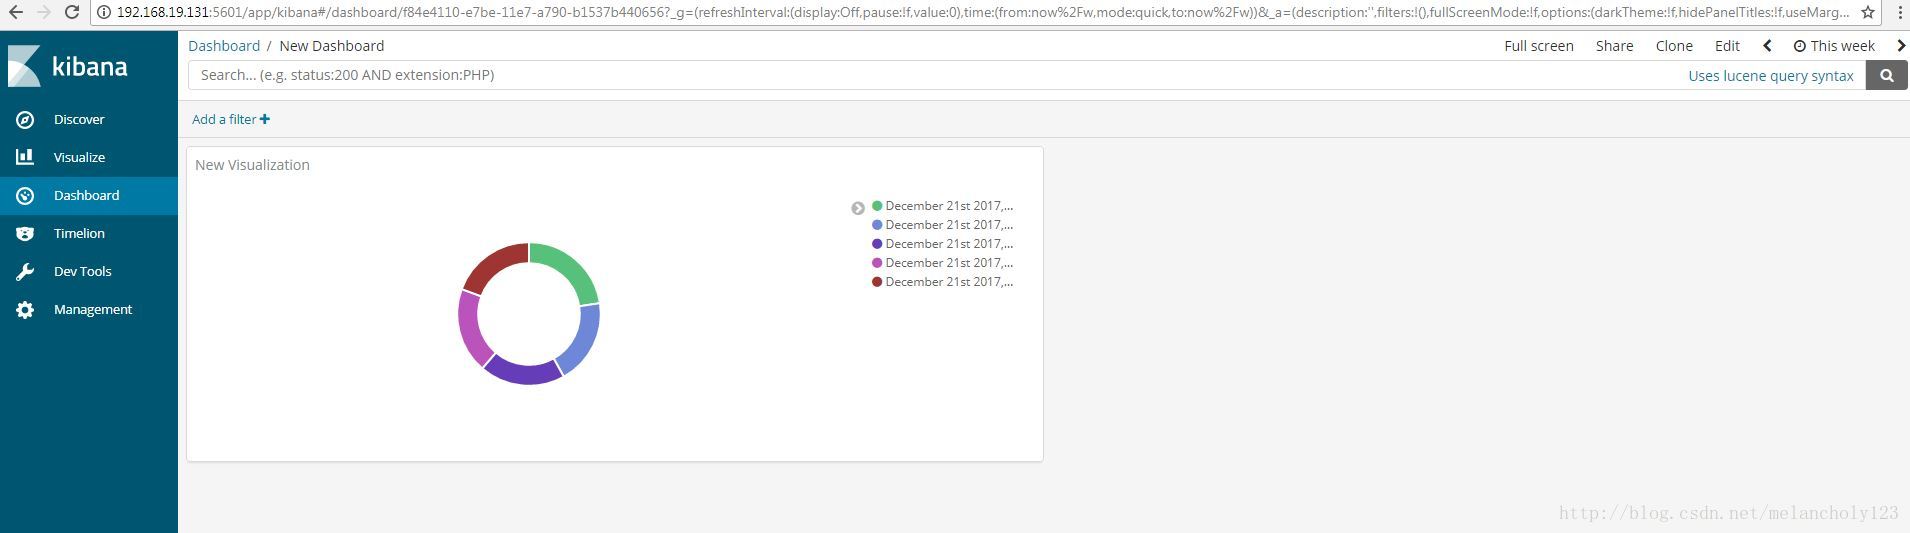
d. Dashboard
该页面可以将上步建立的可视化图表作为独立模块显示。
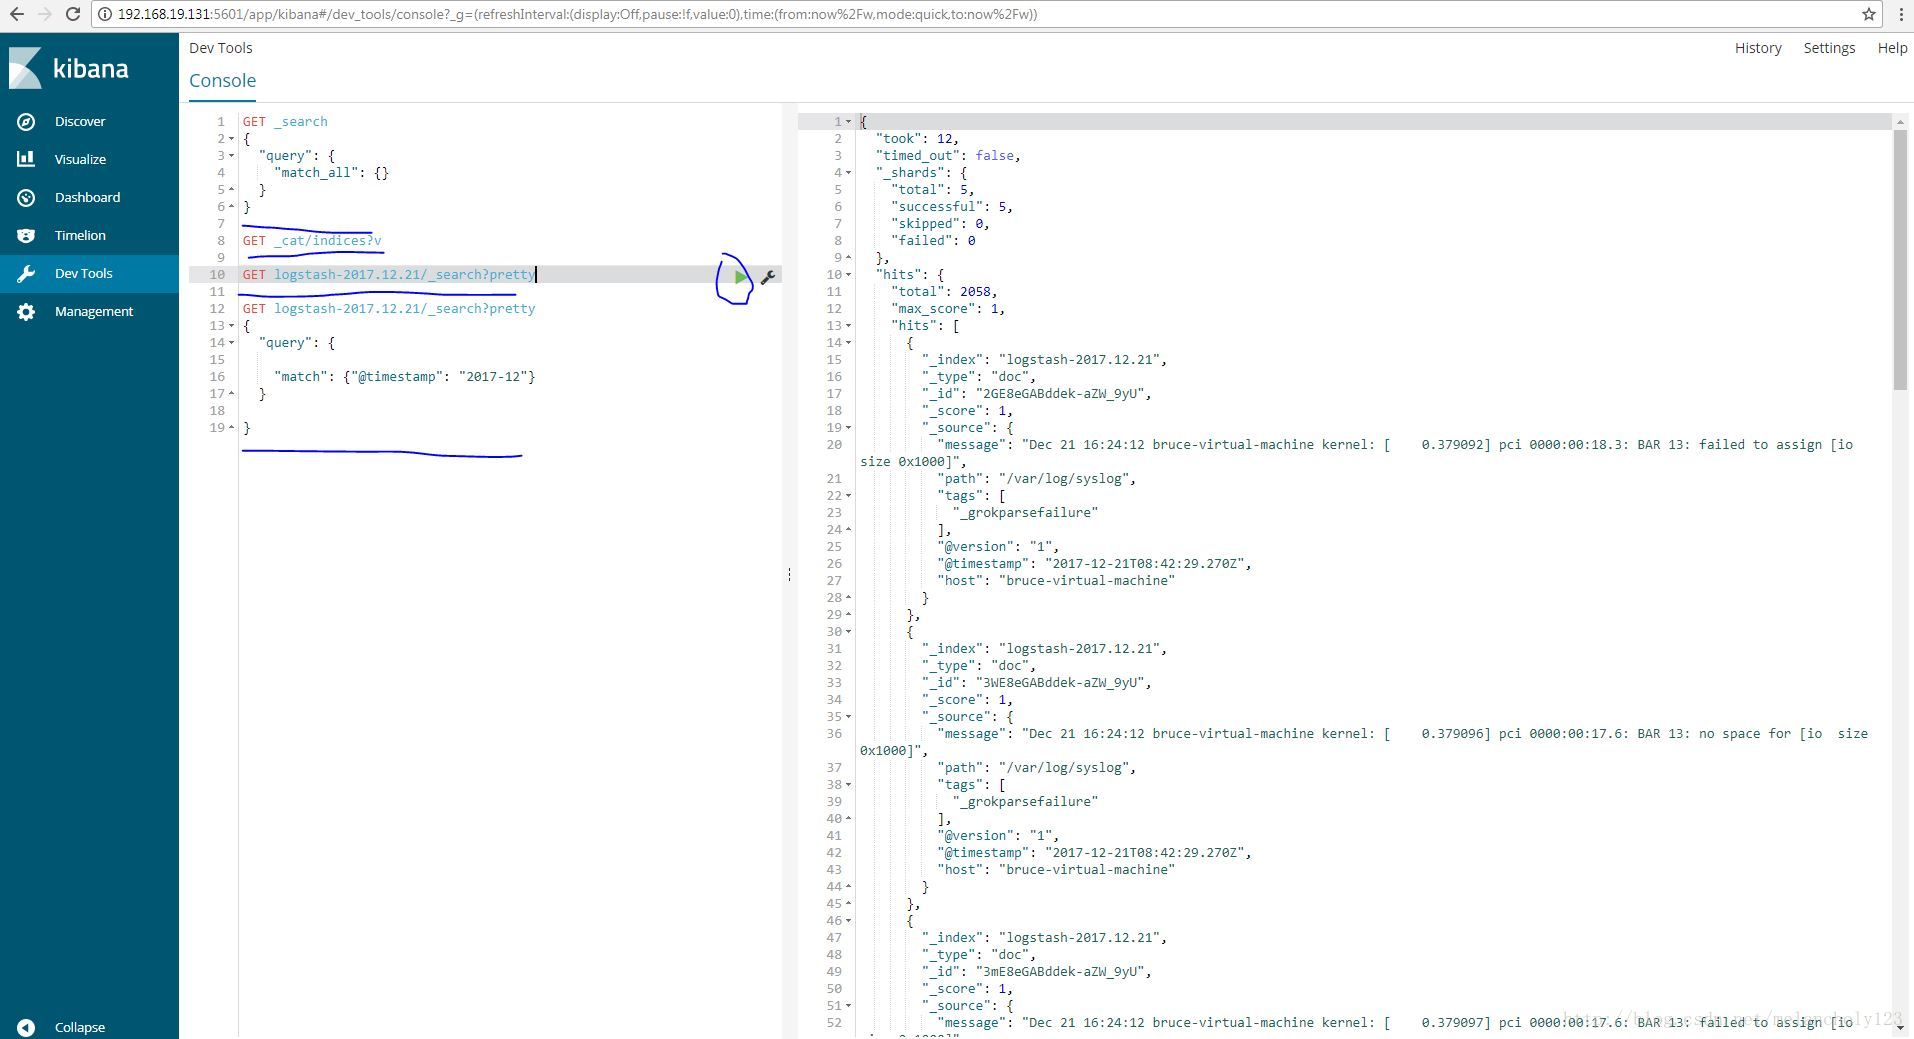
PS: Dev Tools - Console
该工具类似于curl用于发送RESTful接口消息给Elasticsearch,通常用于调试,比直接使用curl用户体验好。