文章目录
一、用户信息展示页面
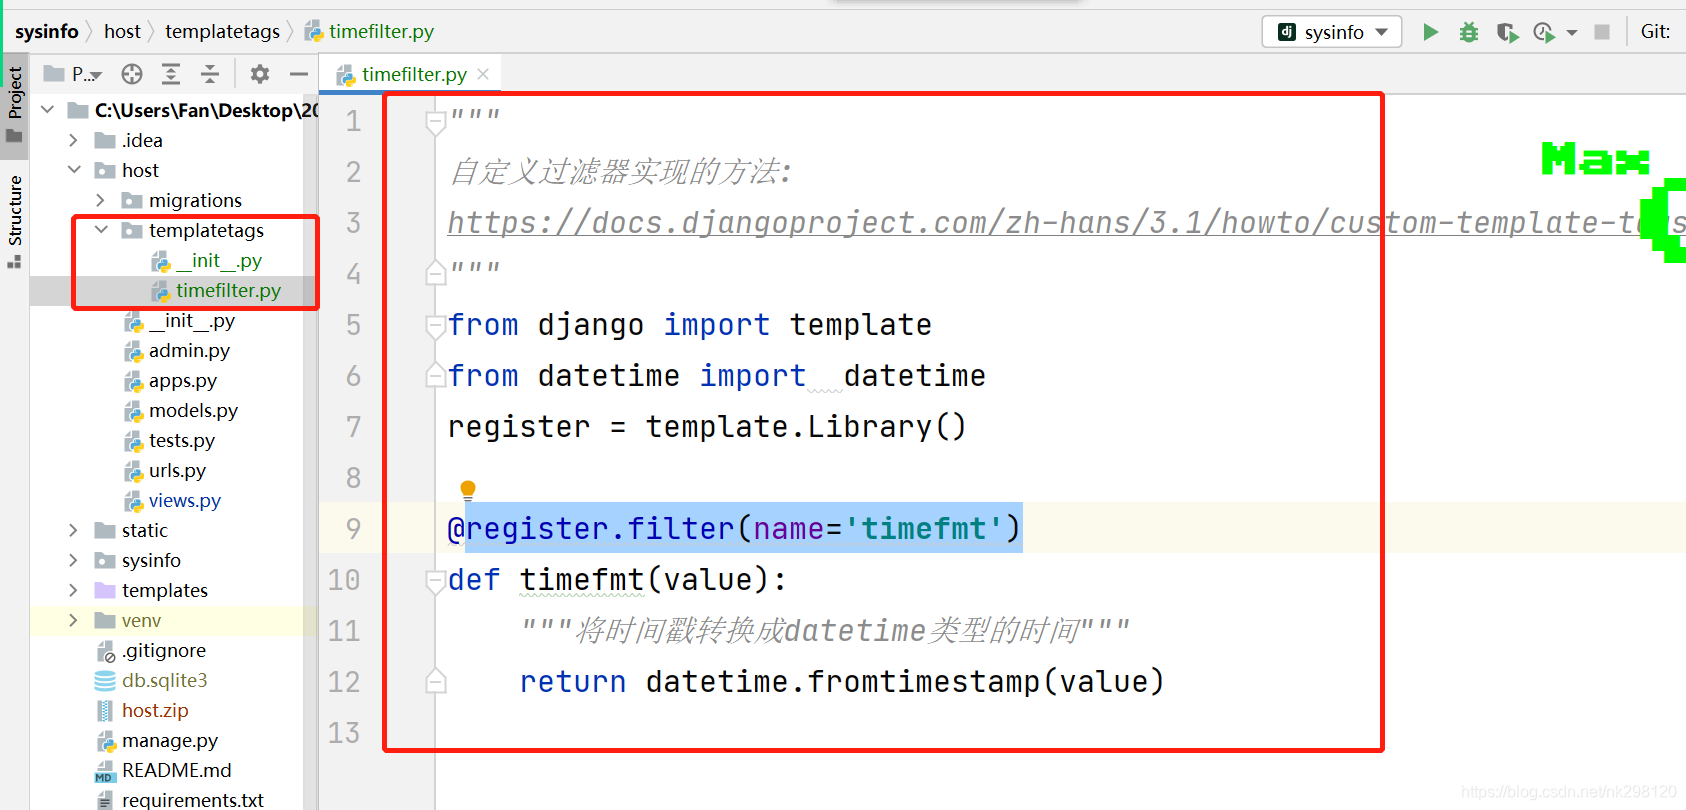
1.自定义过滤器
from django import template
from datetime import  datetime
register = template.Library()

@register.filter(name='timefmt')
def timefmt(value):
    """将时间戳转换成datetime类型的时间"""
    return datetime.fromtimestamp(value)
官方文档:https://docs.djangoproject.com/zh-hans/3.1/howto/custom-template-tags/.
2.视图函数
def user(request):
    users = psutil.users()
    return  render(request, 'host/user.html', locals())
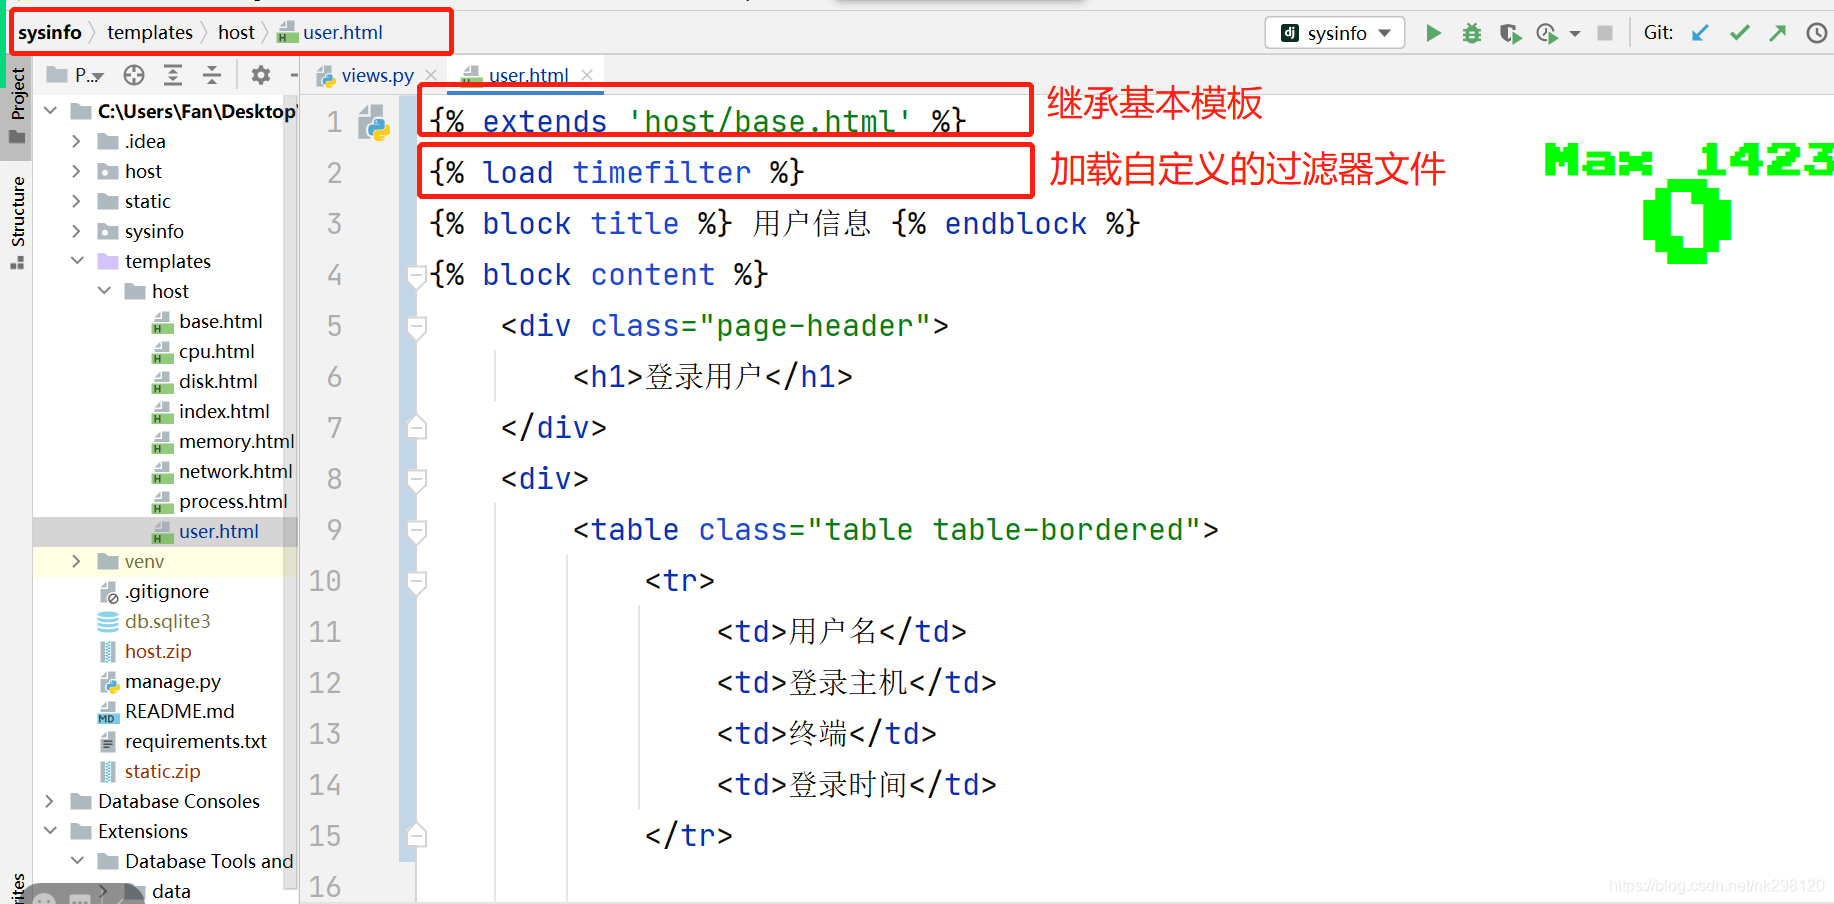
3.html文件编写
{
% extends 'host/base.html' %}
{
% load timefilter %}
{
% block title %} 用户信息 {
% endblock %}
{
% block content %}
<div class="page-header">
<h1>登录用户</h1>
</div>
<div>
<table class="table table-bordered">
<tr>
<td>用户名</td>
<td>登录主机</td>
<td>终端</td>
<td>登录时间</td>
</tr>
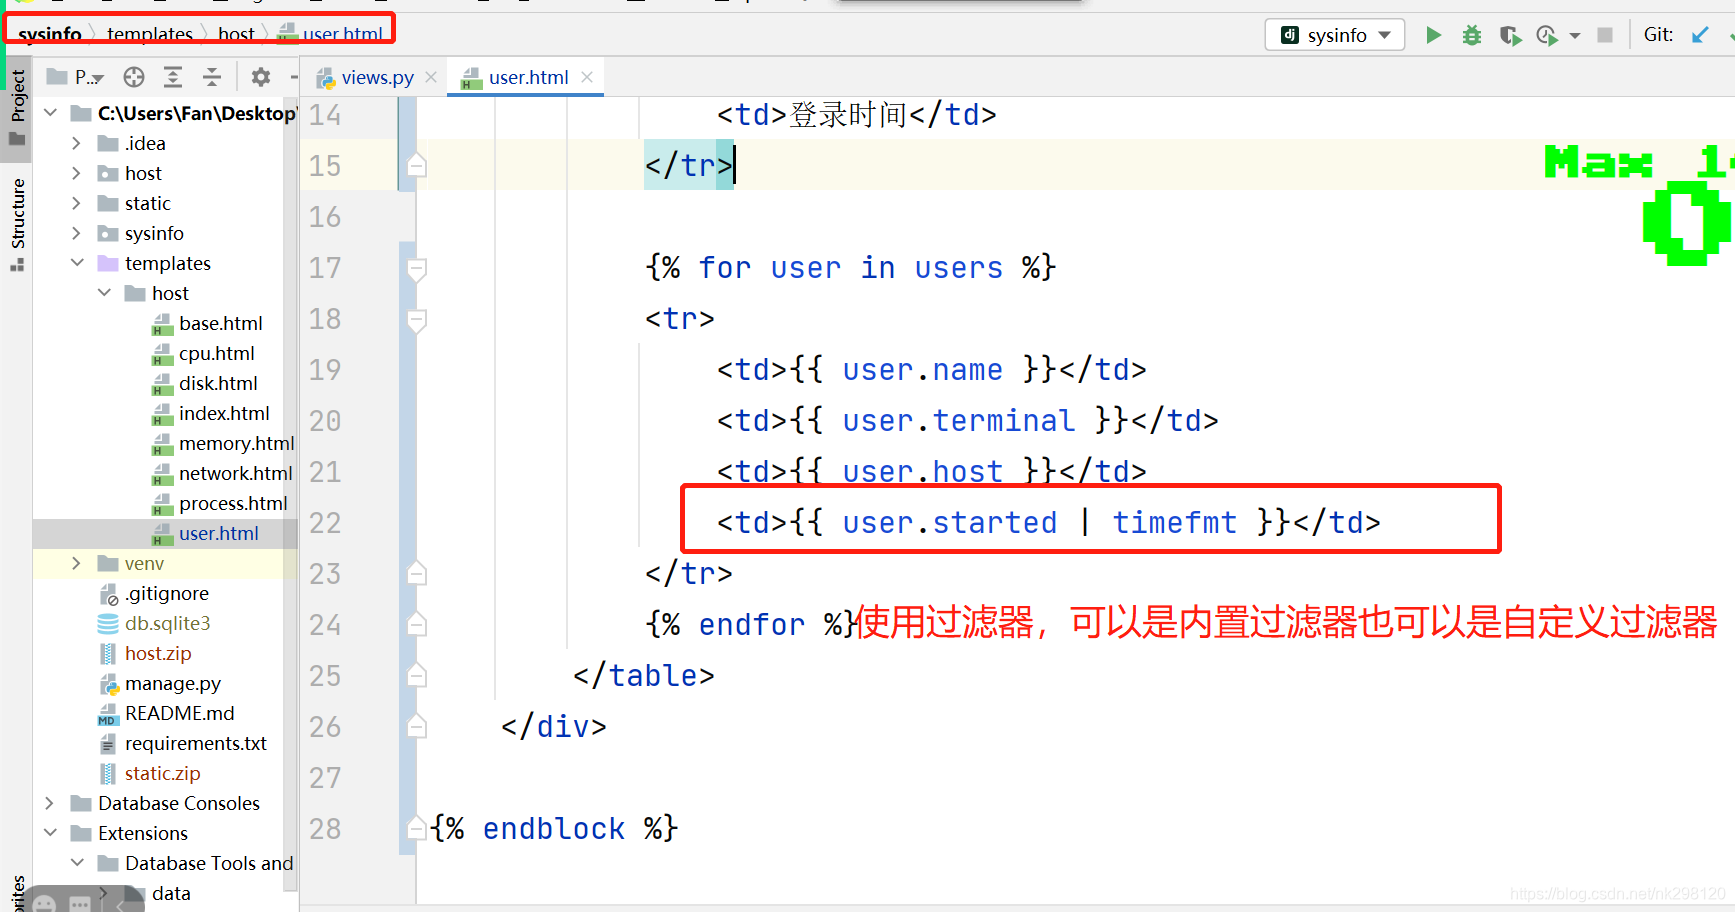
{
% for user in users %}
<tr>
<td>{
{
user.name }}</td>
<td>{
{
user.terminal }}</td>
<td>{
{
user.host }}</td>
<td>{
{
user.started | timefmt }}</td>
</tr>
{
% endfor %}
</table>
</div>
{
% endblock %}
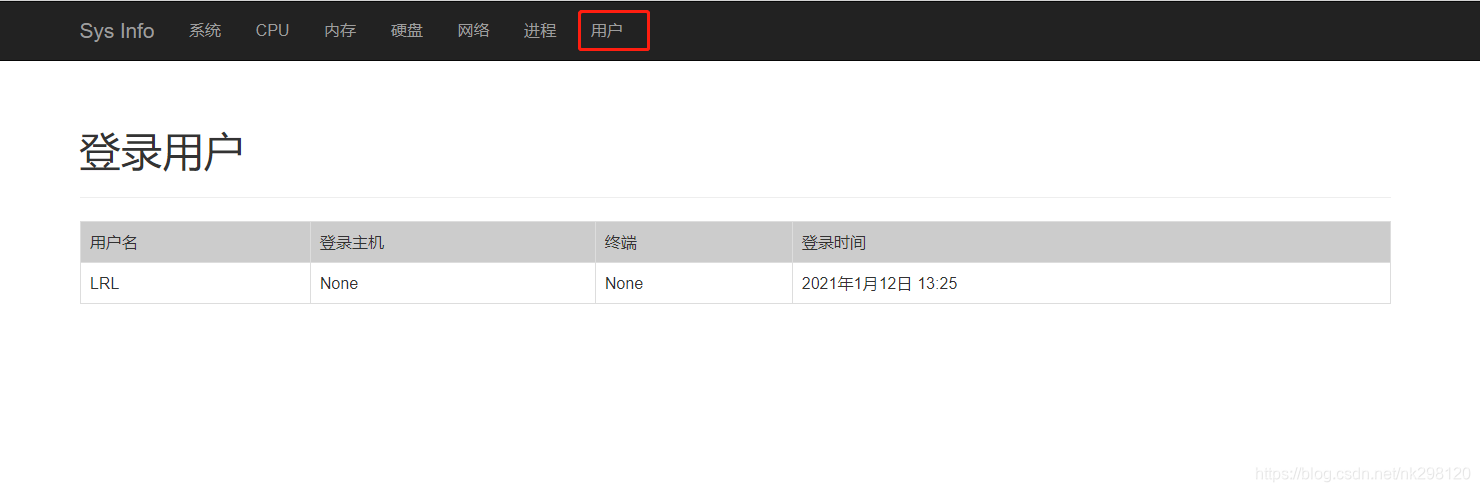
4.效果展示
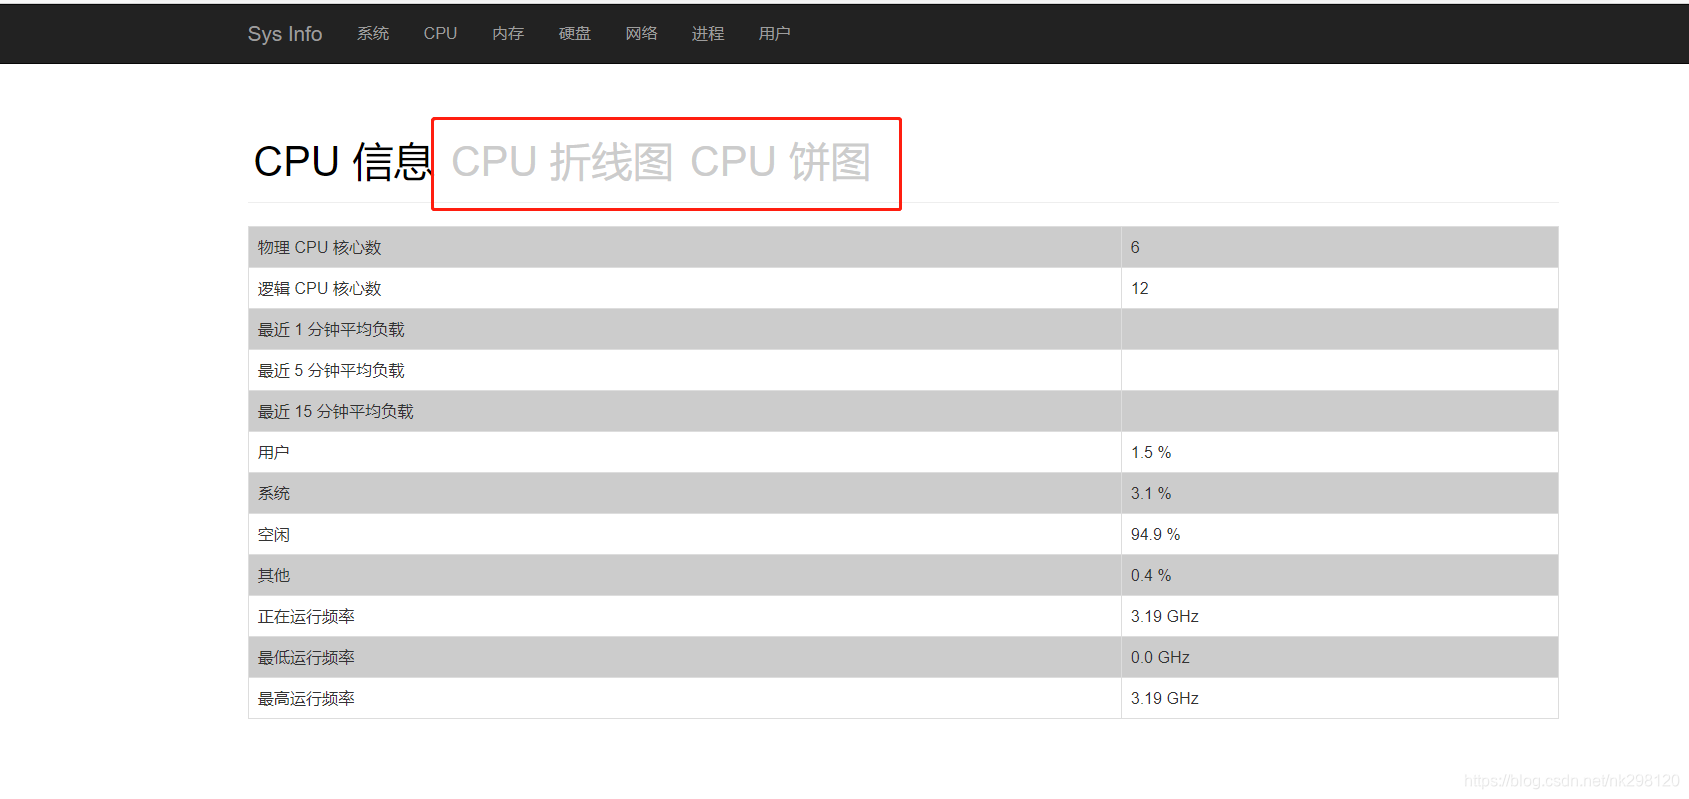
二、CPU信息的图形化展示
1.编辑相关html文件
templates/host/cpu-header.html:
<div class="page-header">
    <a {

    % if not chart %}id="display"{

    % endif %} href="/cpu/">CPU 信息</a>
    <a {

    % if chart == 'line' %}id="display"{

    % endif %} href="/cpu/line/">CPU
        折线图</a>
    <a {

    % if chart == 'pie' %}id="display"{

    % endif %} href="/cpu/pie/">CPU 饼图</a>
</div>

templates/host/cpu-line.html:
{

    % extends 'host/base.html' %}
{

    % load timefilter %}
{

    % block title %} cpu信息 {

    % endblock %}
{

    % block content %}
    {

    % include 'host/cpu-header.html' %}
    <div>
        <div id="main" style="width: 80%;height:400px;"></div>
    </div>

    <script type="text/javascript">
        // 基于准备好的dom,初始化echarts实例
        var myChart = echarts.init(document.getElementById('main'));

        option = {


            xAxis: {


                type: 'category',
                data: ['Mon', 'Tue', 'Wed', 'Thu', 'Fri', 'Sat', 'Sun']
            },
            yAxis: {


                type: 'value'
            },
            series: [{


                data: [820, 932, 901, 934, 1290, 1330, 1320],
                type: 'line',
                smooth: true
            }]
        };

        // 使用刚指定的配置项和数据显示图表。
        myChart.setOption(option);
    </script>

{

    % endblock %}

templates/host/cpu-pie.html:
{

    % extends 'host/base.html' %}
{

    % load timefilter %}
{

    % block title %} cpu信息 {

    % endblock %}
{

    % block content %}
    {

    % include 'host/cpu-header.html' %}
    <div>
        <div id="main" style="width: 80%;height:400px;"></div>
    </div>
    <script type="text/javascript">
        // 基于准备好的dom,初始化echarts实例
        var myChart = echarts.init(document.getElementById('main'));

        option = {


            tooltip: {


                trigger: 'item'
            },
            legend: {


                top: '5%',
                left: 'center'
            },
            series: [
                {


                    name: 'CPU占用百分比分类',
                    type: 'pie',
                    radius: ['40%', '70%'],
                    avoidLabelOverlap: false,
                    itemStyle: {


                        borderRadius: 10,
                        borderColor: '#fff',
                        borderWidth: 2
                    },
                    label: {


                        show: false,
                        position: 'center'
                    },
                    emphasis: {


                        label: {


                            show: true,
                            fontSize: '40',
                            fontWeight: 'bold'
                        }
                    },
                    labelLine: {


                        show: false
                    },
                    data: [
                        {

    value: {

    {

     cpu_time_percent.user }}, name: '用户'},
                        {

    value: {

    {

     cpu_time_percent.system }}, name: '系统'},
                        {

    value: {

    {

     cpu_time_percent.idle }}, name: '空闲'},

                    ]
                }
            ]
        };

        // 使用刚指定的配置项和数据显示图表。
        myChart.setOption(option);
    </script>
{

    % endblock %}

templates/host/cpu.html:
{

    % extends 'host/base.html' %}
{

    % load timefilter %}
{

    % block title %} cpu信息 {

    % endblock %}
{

    % block content %}
        {

    % include 'host/cpu-header.html' %}
        <div>
            <div id="cpu_info">
                <table class="table table-bordered">
                    <tr>
                        <td>物理 CPU 核心数</td>
                        <td>{

    {

     physical_core_num }}</td>
                    </tr>
                    <tr>
                        <td>逻辑 CPU 核心数</td>
                        <td>{

    {

     logical_core_num }}</td>
                    </tr>
                    <tr>
                        <td>最近 1 分钟平均负载</td>
                        <td>{

    {

     load_avg.0 }}</td>
                    </tr>
                    <tr>
                        <td>最近 5 分钟平均负载</td>
                        <td>{

    {

     load_avg.1 }}</td>
                    </tr>
                    <tr>
                        <td>最近 15 分钟平均负载</td>
                        <td>{

    {

     load_avg.2 }}</td>
                    </tr>
                    <tr>
                        <td>用户</td>
                        <td>{

    {

     cpu_time_percent.user }} %</td>
                    </tr>
                    <tr>
                        <td>系统</td>
                        <td>{

    {

     cpu_time_percent.system }} %</td>
                    </tr>
                    <tr>
                        <td>空闲</td>
                        <td>{

    {

     cpu_time_percent.idle }} %</td>
                    </tr>
                    {

    % if cpu_time_percent.nice %}
                        <tr>
                            <td>nice</td>
                            <td>{

    {

     cpu_time_percent.nice }} %</td>
                        </tr>
                    {

    % endif %}
                    {

    % if cpu_time_percent.iowait %}
                        <tr>
                            <td>iowait</td>
                            <td>{

    {

     cpu_time_percent.iowait }} %</td>
                        </tr>
                    {

    % endif %}
                    {

    % if else_percent %}
                        <tr>
                            <td>其他</td>
                            <td>{

    {

     else_percent }} %</td>
                        </tr>
                    {

    % endif %}
                    {

    % if cpu_freq %}
                        <tr>
                            <td>正在运行频率</td>
                            <td>{

    {

     cpu_freq.current | cpu_val_fmt }} GHz</td>
                        </tr>
                        <tr>
                            <td>最低运行频率</td>
                            <td>{

    {

     cpu_freq.min | cpu_val_fmt }} GHz</td>
                        </tr>
                        <tr>
                            <td>最高运行频率</td>
                            <td>{

    {

     cpu_freq.max | cpu_val_fmt }} GHz</td>
                        </tr>
                    {

    % endif %}
                </table>
            </div>
        </div>

    {

    % endblock %}
2.自定义过滤器
host/templatetags/timefilter.py:
@register.filter(name='cpu_val_fmt')
def cpu_val_fmt(value):
    return  round(value/1000, 2)
3.设置路由和视图函数
host/urls.py:
path('', index, name='index'),
    path('user/', user, name='user'),
    path('cpu/', cpu, name='cpu'),
    path('cpu/<str:chart>/', cpu, name='cpu'), %新增
    path('memory/', memory, name='memory'),
    path('disk/', disk, name='disk'),
    path('network/', network, name='network'),

host/views.py:
def cpu(request, chart=None):
    logical_core_num = psutil.cpu_count()  #
    physical_core_num = psutil.cpu_count(logical=False)
    try:
        load_avg = os.getloadavg()
    except Exception as e:
        load_avg = ['', '', '']
    cpu_time_percent = psutil.cpu_times_percent()
    else_percent = 0.0
    for i in range(3, 5):
        else_percent += cpu_time_percent[i]
    try:
        cpu_freq = psutil.cpu_freq()
    except AttributeError:
        cpu_freq = None
    if chart == 'line':
        return render(request, 'host/cpu-line.html', locals())
    elif chart == 'pie':
        return render(request, 'host/cpu-pie.html', locals())
    return render(request, 'host/cpu.html', locals())
4.基于echarts的图形页面展示
图形页面展示时需要从数据库表中读取信息(这些信息需要使用定时任务来获取,下节会写关于定时任务的相关内容,现在我们先来实现页面的展示),因此需要更改数据库模型
修改数据库模型及基模板:
host/models.py:
from django.db import models

# Create your models here.
class UserCpuPercent(models.Model):
    create_time = models.DateTimeField(auto_now_add=True, verbose_name="扫描时间")
    user_percent = models.FloatField(verbose_name="用户CPU占用百分比")
注意:更改数据库模型后要记得生成迁移脚本并执行

templates/host/base.html:
   <link rel="stylesheet" type="text/css" href="/static/css/bootstrap.css">
        <link rel="stylesheet" type="text/css" href="/static/css/my-style.css">
        <script src="/static/js/jquery-3.1.1.min.js"></script>
        <script src="https://lib.baomitu.com/echarts/5.0.2/echarts.min.js"></script>  %新增
    {

    % endblock head %}
</head>
<body>
这里展示的折线图并不包含主机的真实信息,只是一个图形界面(因为我们没有设置定时任务来获取主机的相关信息):

饼状图反映的是真实的主机信息:
