- 了解ftrace
1.What is tracing?
Tracing is the specialized use of logging to record information about a program’s flow of execution.
You know when you add print messages in your code to debug it? You are tracing the application with your own “tracing system”. The debug messages added to the code are static tracepoints, and your “trace system” might send the debug messages to the program’s standard output or a log file.
Well, that works. But does not scale. Every time you want to trace some part of the code, you will have to add new debug messages and rebuild it. And you do not have much control over where the messages go. What if you want to save them to analyze later? What if you want to filter the messages? And the code will be a mess, with lots of print statements (you will have to be very careful to not commit any code with debug messages, right?).
The fact is that most of the time we don’t need to add debug messages to the code because there are already tracing tools and frameworks that can do that for us.
2.What is ftrace?
Ftrace is a tracing framework for the Linux kernel. It was added to the kernel back in 2008 and has evolved a lot since then.
Ftrace stands for function tracer and basically lets you watch and record the execution flow of kernel functions. It was created by Steven Rostedt, derived from two other tools called latency tracer from Ingo Molnar and Steven’s logdev utility.
With ftrace you can really see what the kernel is doing. You can trace function calls and learn a lot about how the kernel works. You can find out which kernel functions are called when you run a user space application. You can profile functions, measure execution time and find out bottlenecks and performance issues. You can identify hangs in kernel space. You can measure the time it takes to run a real-time task and find out latency issues. You can measure stack usage in kernel space and find out possible stack overflows. You can really do a lot of things to monitor and find bugs in the kernel!
2.1.How does ftrace work?
There are two main types of tracing: static tracing and dynamic tracing.
-
Static tracing is implemented through static probes added in the source code. They have a low processing load, but the traced code is limited and defined at build time.
-
Dynamic tracing is implemented through dynamic probes injected into code, allowing to define at runtime the code to be traced. It has a certain processing load, but the range of source code to be traced is much larger.
Ftrace uses a combination of both static probes (function tracing, event tracing, etc) and dynamic probes (kprobes, uprobes, etc).
To trace function calls, ftrace will build the kernel with GCC’s -pg option.
When the kernel is built with -pg, GCC will prepend machine instructions to the prologue of every non-inlined function that will redirect the execution to the ftrace’s trampolines and tracer plugins that perform the actual tracing.
2.2.Ftrace framework
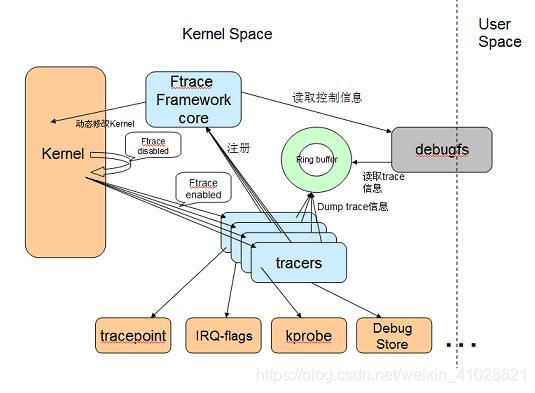
ftrace 是内建于 Linux 内核的跟踪工具,从 2.6.27 开始加入主流内核。使用 ftrace 可以调试或者分析内核中发生的事情。ftrace 提供了不同的跟踪器,以用于不同的场合,比如跟踪内核函数调用、对上下文切换进行跟踪、查看中断被关闭的时长、跟踪内核态中的延迟以及性能问题等。系统开发人员可以使用 ftrace 对内核进行跟踪调试,以找到内核中出现的问题的根源,方便对其进行修复。
Ftrace 有两大组成部分,一是 framework,另外就是一系列的 tracer 。每个 tracer 完成不同的功能,它们统一由 framework 管理。 ftrace 的 trace 信息保存在 ring buffer 中,由 framework 负责管理。 Framework 利用 debugfs 系统在 /debugfs 下建立 tracing 目录,并提供了一系列的控制文件。
2.3.内核支持ftrace
内核源码目录下的 kernel/trace/Makefile 文件给出了 ftrace 相关的编译选项。ftrace 相关的配置选项比较多,针对不同的跟踪器有各自对应的配置选项。不同的选项有不同的依赖关系,内核源码目录下的kernel/trace/Kconfig 文件描述了这些依赖关系。可以参考 Makefile 文件和 Konfig 文件,然后选中自己所需要的跟踪器。
CONFIG_FUNCTION_TRACER
CONFIG_FUNCTION_GRAPH_TRACER
CONFIG_CONTEXT_SWITCH_TRACER
CONFIG_NOP_TRACER
CONFIG_SCHED_TRACER
CONFIG_DYNAMIC_FTRACE //enable/disable ftrace tracepoints dynamically
2.3.1.内核配置

ftrace 通过 debugfs 向用户态提供了访问接口,所以还需要将 debugfs 编译进内核。激活对 debugfs 的支持,可以直接编辑内核配置文件 .config ,设置 CONFIG_DEBUG_FS=y;配置内核时激活debugfs挂载到/sys/kernel/debug,如下所示:
>//Mount the kernel to /sys/kernel/debug and instruct it to use the debugfs file system:
># mount -t debugfs nodev /sys/kernel/debug
配置完成后,编译安装新内核,然后启动到新内核。 注意,激活 ftrace 支持后,编译内核时会使用编译器的 -pg 选项,这是在 kernel/trace/Makefile 文件中定义的,使用 -pg 选项会在编译得到的内核映像中加入大量的调试信息。一般情况下,只是在开发测试阶段激活 ftrace 支持,以调试内核,修复 bug 。最终用于发行版的内核则会关闭 -pg 选项,也就无法使用 ftrace。(refer to If the kernel is compiled with function tracer support the -pg compile option.patch)
kernel/trace/Makefile:
ifdef CONFIG_FUNCTION_TRACER
ORIG_CFLAGS := $(KBUILD_CFLAGS)
KBUILD_CFLAGS = $(subst $(CC_FLAGS_FTRACE),,$(ORIG_CFLAGS))

Kernel/Makefile:
ifdef CONFIG_FUNCTION_TRACER
ifndef CC_FLAGS_FTRACE
CC_FLAGS_FTRACE := -pg
endif
激活内核对 ftrace 的支持后会在 debugfs 下创建一个 tracing 目录 /sys/kernel/debug/tracing 。该目录下包含了 ftrace 的控制和输出文件,根据编译内核时针对 ftrace 的设定不同,该目录下实际显示的文件和目录与这里也会不同。
tracing目录(/sys/kernel/debug/tracing)中的文件控制着跟踪的能力。根据你在内核配置时的选项的不同,这里列的文件可能稍有差异。你可以在内核源代码目录下/Documentation/trace目录中找到这些文件的信息。
osborn:/d/tracing # ls -l
-r--r--r--  1 root root  0 1970-01-01 08:00 README
-r--r--r--  1 root root  0 1970-01-01 08:00 available_events
-r--r--r--  1 root root  0 1970-01-01 08:00 available_filter_functions
-r--r--r--  1 root root  0 1970-01-01 08:00 available_tracers
-rw-rw-r--  1 root shell 0 1970-01-01 08:00 buffer_size_kb
-r--r--r--  1 root root  0 1970-01-01 08:00 buffer_total_size_kb
-rw-r--r--  1 root root  0 1970-01-01 08:00 cpu_freq_switch_profile_enabled
-rw-r--r--  1 root root  0 2018-01-01 08:29 current_tracer
...
-
README文件提供了一个简短的使用说明,展示了 ftrace 的操作命令序列。可以通过 cat 命令查看该文件以了解概要的操作流程。
-
current_tracer用于设置或显示当前使用的跟踪器;使用 echo 将跟踪器名字写入该文件可以切换到不同的跟踪器。系统启动后,其缺省值为 nop ,即不做任何跟踪操作。在执行完一段跟踪任务后,可以通过向该文件写入 nop 来重置跟踪器。
-
available_tracers记录了当前编译进内核的跟踪器的列表,可以通过 cat 查看其内容;其包含的跟踪器与图 3 中所激活的选项是对应的。写 current_tracer 文件时用到的跟踪器名字必须在该文件列出的跟踪器名字列表中。
-
trace文件提供了查看获取到的跟踪信息的接口。可以通过 cat 等命令查看该文件以查看跟踪到的内核活动记录,也可以将其内容保存为记录文件以备后续查看。
-
set_graph_function设置要清晰显示调用关系的函数,显示的信息结构类似于 C 语言代码,这样在分析内核运作流程时会更加直观一些。在使用 function_graph 跟踪器时使用;缺省为对所有函数都生成调用关系序列,可以通过写该文件来指定需要特别关注的函数。
-
buffer_size_kb用于设置单个 CPU 所使用的跟踪缓存的大小。跟踪器会将跟踪到的信息写入缓存,每个 CPU 的跟踪缓存是一样大的。跟踪缓存实现为环形缓冲区的形式,如果跟踪到的信息太多,则旧的信息会被新的跟踪信息覆盖掉。
-
tracing_on用于控制跟踪的暂停。有时候在观察到某些事件时想暂时关闭跟踪,可以将 0 写入该文件以停止跟踪,这样跟踪缓冲区中比较新的部分是与所关注的事件相关的;写入 1 可以继续跟踪。
-
available_filter_functions记录了当前可以跟踪的内核函数。对于不在该文件中列出的函数,无法跟踪其活动。
-
set_ftrace_pid 跟踪单个进程(内核线程)的函数调用,有效值大于0。如果echo > set_ftrace_pid则清空该选项。
-
set_ftrace_filter和 set_ftrace_notrace在编译内核时配置了动态 ftrace (选中 CONFIG_DYNAMIC_FTRACE)后使用。前者用于显示指定要跟踪的函数,后者则作用相反,用于指定不跟踪的函数。如果一个函数名同时出现在这两个文件中,则这个函数的执行状况不会被跟踪。这些文件还支持简单形式的含有通配符的表达式,这样可以用一个表达式一次指定多个目标函数;具体使用在后续文章中会有描述。注意,要写入这两个文件的函数名必须可以在文件 available_filter_functions 中看到。缺省为可以跟踪所有内核函数,文件 set_ftrace_notrace 的值则为空.
-
trace_options : 启用或者禁用各种域,要禁用一个跟踪选项,只需要在相应行首加一个“no”即可。比如,echo notrace_printk >trace_options。(no和选项之间没有空格)要再次启用一个跟踪选项:echo trace_printk >trace_options
2.3.2.ftrace 跟踪器
-
nop跟踪器
不会跟踪任何内核活动,将 nop 写入 current_tracer 文件可以删除之前所使用的跟踪器,并清空之前收集到的跟踪信息,即刷新 trace 文件。 -
function跟踪器
跟踪内核函数的执行情况;可以通过文件 set_ftrace_filter 显示指定要跟踪的函数。 -
function_graph跟踪器
显示类似 C 源码的函数调用关系图,这样查看起来比较直观一些;可以通过文件 set_grapch_function 显示指定要生成调用流程图的函数。 -
sched_switch跟踪器
对内核中的进程调度活动进行跟踪。 -
Wakeup tracer
跟踪进程的调度延迟,即高优先级进程从进入 ready 状态到获得 CPU 的延迟时间。该 tracer 只针对实时进程。 -
Irqsoff tracer
当中断被禁止时,系统无法相应外部事件,比如键盘和鼠标,时钟也无法产生 tick 中断。这意味着系统响应延迟,irqsoff 这个 tracer 能够跟踪并记录内核中哪些函数禁止了中断,对于其中中断禁止时间最长的,irqsoff 将在 log 文件的第一行标示出来,从而使开发人员可以迅速定位造成响应延迟的罪魁祸首。 -
Preemptoff tracer
和前一个 tracer 类似,preemptoff tracer 跟踪并记录禁止内核抢占的函数,并清晰地显示出禁止抢占时间最长的内核函数。 -
Preemptirqsoff tracer
同上,跟踪和记录禁止中断或者禁止抢占的内核函数,以及禁止时间最长的函数。 -
Branch tracer
跟踪内核程序中的 likely/unlikely 分支预测命中率情况。 Branch tracer 能够记录这些分支语句有多少次预测成功。从而为优化程序提供线索。 -
Hardware branch tracer
利用处理器的分支跟踪能力,实现硬件级别的指令跳转记录。在 x86 上,主要利用了 BTS 这个特性。 -
Initcall tracer:记录系统在 boot 阶段所调用的 init call 。
-
Mmiotrace tracer:记录 memory map IO 的相关信息。
-
Power tracer:记录系统电源管理相关的信息。
-
Sysprof tracer:缺省情况下,sysprof tracer 每隔 1 msec 对内核进行一次采样,记录函数调用和堆栈信息。
-
Kernel memory tracer: 内存 tracer 主要用来跟踪 slab allocator 的分配情况。包括 kfree,kmem_cache_alloc 等 API 的调用情况,用户程序可以根据 tracer 收集到的信息分析内部碎片情况,找出内存分配最频繁的代码片断,等等。
-
Workqueue statistical tracer:这是一个 statistic tracer,统计系统中所有的 workqueue 的工作情况,比如有多少个 work 被插入 workqueue,多少个已经被执行等。开发人员可以以此来决定具体的 workqueue 实现,比如是使用 single threaded workqueue 还是 per cpu workqueue.
-
Event tracer: 跟踪系统事件,比如 timer,系统调用,中断等。
2.3.3.available_tracers(被编译进系统的跟踪器)
This file contains all the available tracers for the installed version of ftrace. To see the list of available tracers, use the cat command to view the contents of the file:
#cat /sys/kernel/debug/tracing/available_tracers
events wakeup preemptirqsoff preemptoff irqsoff ftrace sched_switch none
-
events
Traces system events such as timers, system calls, interrupts, context switches, process wake up and others -
wakeup
Traces the maximum latency in between the highest priority process waking up and being scheduled. Only RT tasks are considered by this tracer (SCHED_OTHER tasks are ignored as of now). -
preemptirqsoff
Traces the areas that disable pre-emption and interrupts and records the maximum amount of time for which pre-emption or interrupts were disabled. -
preemptoff
Similar to the preemptirqsoff tracer but traces only the maximum interval for which pre-emption was disabled. -
irqsoff
Similar to the preemptirqsoff tracer but traces only the maximum interval for which interrupts were disabled. -
ftrace
Records the kernel functions called during a tracing session. The ftrace utility can be run simultaneously with any of the other tracers, except the sched_switch tracer. -
sched_switch
Traces context switches between tasks. -
blk – for blk device
-
function – trace entry of all kernel functions
-
function_graph – trace on both entry and exit of all functions. And provides C style of calling graph
-
mmiotrace – In-kernel memory-mapped I/O tracing
-
nop – trace nothing
2.3.4.current_tracer(当前启用的跟踪器)
To manually start a tracing session, first select the tracer you wish to use from the list in available_tracers and then use the echo to insert the name of the tracer into /sys/kernel/debug/tracing/current_tracer:
#echo events > /sys/kernel/debug/tracing/current_tracer
2.3.5.ftrace_enabled
The following tracers (listed below) give different output depending on whether or not the sysctl ftrace_enabled is set. To set ftrace_enabled, one can either use the sysctl function or set it via the proc file system interface.
  sysctl kernel.ftrace_enabled=1
 or
  echo 1 > /proc/sys/kernel/ftrace_enabled
To disable ftrace_enabled simply replace the ‘1’ with ‘0’ in the above commands.
When ftrace_enabled is set the tracers will also record the functions that are within the trace.
2.3.6.tracing_on
Obviously there are times where you only want to trace a particular code path. Perhaps you only want to trace what is happening when you run a specific test. The file tracing_on is used to disable the ring buffer from recording data:
[tracing]# echo 0 > /sys/kernel/debug/tracing/tracing_on
This will disable the Ftrace ring buffer from recording. Everything else still happens with the tracers and they will still incur most of their overhead. They do notice that the ring buffer is not recording and will not attempt to write any data, but the calls that the tracers make are still performed.
//使能trace
echo 1 > /sys/kernel/debug/tracing/tracing_on
A common run might be:
# echo 0 > tracing_on
# echo function_graph > current_tracer
# echo 1 > tracing_on; run_test; echo 0 > tracing_on
The first line disables the ring buffer from recording any data. The next enables the function graph tracer. The overhead of the function graph tracer is still present but nothing will be recorded into the trace buffer. The last line enables the ring buffer, runs the test program, then disables the ring buffer. This narrows the data stored by the function graph tracer to include mostly just the data accumulated by the run_test program.
To enable the function tracer, just echo “function” into the current_tracer file.
    [tracing]# echo function > current_tracer
    [tracing]# echo 1 > tracing_on
    [tracing]# cat trace | head -10
    # tracer: function
    #
    #          TASK-PID    CPU#    TIMESTAMP  FUNCTION
    #              | |      |          |        |
                bash-16939 [000]  6075.461561: mutex_unlock <-tracing_set_tracer
              <idle>-0    [001]  6075.461561: _spin_unlock_irqrestore <-hrtimer_get_next_event
              <idle>-0    [001]  6075.461562: rcu_needs_cpu <-tick_nohz_stop_sched_tick
                bash-16939 [000]  6075.461563: inotify_inode_queue_event <-vfs_write
              <idle>-0    [001]  6075.461563: mwait_idle <-cpu_idle
                bash-16939 [000]  6075.461563: __fsnotify_parent <-vfs_write
The header explains the format of the output pretty well. The first two items are the traced task name and PID. The CPU that the trace was executed on is within the brackets. The timestamp is the time since boot, followed by the function name. The function in this case is the function being traced with its parent following the “<-” symbol.
2.3.7.trace_options 文件用来控制trace的输出格式。
The trace_options file is used to control what gets printed in the trace output. To see what is available, simply cat the file:
cat /sys/kernel/debug/tracing/trace_options
- 关闭某option,则在option前面加no,比如:
echo noprint-parent > trace_options
- 使能option,则去掉no
echo sym-offset > trace_options
2.3.8.函数过滤器
ftrace 输出可能会很大,精确找出你所需要的内容可能会非常困难。我们可以使用过滤器去简化我们的搜索:输出中将只显示与我们感兴趣的函数相关的信息。为实现过滤,我们只需要在 set_ftrace_filter 文件中写入我们需要过滤的函数的名字即可。例如:
root@andrei:/sys/kernel/debug/tracing# echo kfree > set_ftrace_filter
如果禁用过滤器,我们只需要在这个文件中添加一个空白行即可:
root@andrei:/sys/kernel/debug/tracing# echo > set_ftrace_filter
通过运行这个命令:
root@andrei:/sys/kernel/debug/tracing# echo kfree > set_ftrace_notrace
将得到相反的结果:输出将包含除了 kfree() 以外的任何函数的信息。
2.4.获取trace
- /sys/kernel/debug/tracing/trace
This file contains human-readable trace output.
- /sys/kernel/debug/tracing/trace_pipe(管道文件,主要为了方便应用程序读取 trace 内容)
This file contains the same output as /sys/kernel/debug/tracing/trace, but is meant to be piped into a command. Unlike /sys/kernel/debug/tracing/trace, reading from this file consumes its output.
2.5.set_event
//为了简便,我们只需使能所有的事件
echo *:* > /sys/kernel/debug/tracing/set_event
2.6.Using trace_printk()
printk() is the king of all debuggers, but it has a problem. If you are debugging a high volume area such as the timer interrupt, the scheduler, or the network, printk() can lead to bogging down the system or can even create a live lock. It is also quite common to see a bug “disappear” when adding a few printk()s. This is due to the sheer overhead that printk() introduces.
Ftrace introduces a new form of printk() called trace_printk(). It can be used just like printk(), and can also be used in any context (interrupt code, NMI code, and scheduler code). What is nice about trace_printk() is that it does not output to the console. Instead it writes to the Ftrace ring buffer and can be read via the trace file.
Writing into the ring buffer with trace_printk() only takes around a tenth of a microsecond or so. But using printk(), especially when writing to the serial console, may take several milliseconds per write. The performance advantage of trace_printk() lets you record the most sensitive areas of the kernel with very little impact.
For example you can add something like this to the kernel or module:
trace_printk("read foo %d out of bar %p\n", bar->foo, bar);
Then by looking at the trace file, you can see your output.
    [tracing]# cat trace
    # tracer: nop
    #
    #          TASK-PID    CPU#    TIMESTAMP  FUNCTION
    #              | |      |          |        |
              <...>-10690 [003] 17279.332920: : read foo 10 out of bar ffff880013a5bef8
The above example was done by adding a module that actually had a foo and bar construct.
trace_printk() output will appear in any tracer, even the function and function graph tracers.
   [tracing]# echo function_graph > current_tracer
    [tracing]# insmod ~/modules/foo.ko
    [tracing]# cat trace
    # tracer: function_graph
    #
    # CPU  DURATION                  FUNCTION CALLS
    # |    |  |                    |  |  |  |
    3) + 16.283 us  |      }
    3) + 17.364 us  |    }
    3)              |    do_one_initcall() {


    3)              |      /* read foo 10 out of bar ffff88001191bef8 */
    3)  4.221 us    |    }
    3)              |    __wake_up() {


    3)  0.633 us    |      _spin_lock_irqsave();
    3)  0.538 us    |      __wake_up_common();
    3)  0.563 us    |      _spin_unlock_irqrestore();
Yes, the trace_printk() output looks like a comment in the function graph tracer.
2.7.ftrace的一般使用流程:
设置跟踪器 ——》开启跟踪器 ——》关闭跟踪器
- 设置function跟踪器
echo function > current_tracer
echo funtion_graph > current_tracer
- 跟踪指定模块中的函数
echo ‘:mod:[module_name]’ > set_ftrace_filter
例如,要跟踪模块 ipv6 中的函数
echo ':mod:ipv6' > set_ftrace_filter
- 开启跟踪器
echo 1 > tracing_on
- 关闭跟踪器
echo 0 > tracing_on
- 存储跟踪文件
ftrace 默认将跟踪后的文件存储到安装目录下的 trace 文件中。
ftrace 脚本示例:
- 1).Example how to run ftrace with function_graph tracer
#!/bin/sh
#ftrace.sh

dir="/sys/kernel/debug/tracing/"
save="/root/Desktop/"

echo 1 > /proc/sys/kernel/ftrace_enabled
echo 0 > ${

    dir}tracing_on
echo function_graph > ${

    dir}current_tracer
echo ':mod:openvswitch' > ${

    dir}set_ftrace_filter
echo 1 > ${

    dir}tracing_on
sleep 2
echo 0 > ${

    dir}tracing_on
cat ${

    dir}trace > ${

    save}trace_records
- 关闭ftrace跟踪 : echo 0 > tracing_on [最新的ftrace没有tracing_enable文件]
- 清空ring buffer : echo nop > current_tracer
- 设置跟踪类型 : echo function_graph > current_tracer
- 设置跟踪的函数 : echo do_sys_open > set_graph_function
- 开启ftrace跟踪 : echo 1 > tracing_on
3.trace-cmd/kernelshark
Ftrace在debugfs中的接口很简单,但在实际操作时,还是显得不太灵活。如果能让一个应用程序代替我们与Ftrace的接口交互,将会大大简化其使用,而这个程序就是trace-cmd。此外,为了能够更加直观的分析过滤Ftrace的log,将会介绍一个基于GUI的工具kernelshark。
sudo apt install trace-cmd kernelshark
Here’s some examples of trace-cmd:
#trace-cmd record -e sched myprogram
refer to https://lwn.net/Articles/410200/
3.1.kernelshark
kernelshark是一个用来查看trace.dat的GUI程序
3.Code:
- kernel/trace/
- kernel/Documentation/trace
- kernel/sample/trace_events/
5.Debug
echo 0 > /sys/kernel/debug/tracing/tracing_on &&
echo > /sys/kernel/debug/tracing/trace &&
echo 51200 > /sys/kernel/debug/tracing/buffer_size_kb &&
echo *:* > /sys/kernel/debug/tracing/set_event &&
sleep 2 && echo 1 > /sys/kernel/debug/tracing/tracing_on &&
sleep 10 && echo 1 > /sys/kernel/debug/tracing/tracing_on &
refer to
- https://lwn.net/Articles/365835/
- https://lwn.net/Articles/366796/
- https://lwn.net/Articles/370423/
- https://lwn.net/Articles/410200/
- https://lwn.net/Articles/425583/
- https://github.com/brendangregg/perf-tools
- https://kernelshark.org/Documentation.html
- http://www.cnblogs.com/arnoldlu/p/7211249.html
- https://www.ibm.com/developerworks/cn/linux/l-cn-ftrace/
- https://www.ibm.com/developerworks/cn/linux/l-cn-ftrace1/index.html
- https://embeddedbits.org/tracing-the-linux-kernel-with-ftrace/
- https://www.kernel.org/doc/html/v4.18/trace/ftrace.html
- https://www.ibm.com/developerworks/cn/linux/1609_houp_ftrace/index.html(event tracing实现)