前言
之前写过一遍博客,使用docker命令直接安装的,不方便以后学习,操作比较繁琐,最近抽空看了下把他抽成docker-compose文件,方便以后快速使用,方便以后的学习。
步骤
部署Prometheus + Grafana
- 首先还是先给出
docker-compose.yml脚本文件
version: '3.2'

networks:
    monitor:
        driver: bridge

services:
    prometheus:
        image: prom/prometheus
        container_name: prometheus
        hostname: prometheus
        restart: always
        volumes:
            - /usr/local/src/config/prometheus.yml:/etc/prometheus/prometheus.yml
            - /usr/local/src/config/node_down.yml:/etc/prometheus/node_down.yml
        ports:
            - "9090:9090"
        networks:
            - monitor

    alertmanager:
        image: prom/alertmanager
        container_name: alertmanager
        hostname: alertmanager
        restart: always
        volumes:
            - /usr/local/src/config/alertmanager.yml:/etc/alertmanager/alertmanager.yml
        ports:
            - "9093:9093"
        networks:
            - monitor

    grafana:
        image: grafana/grafana
        container_name: grafana
        hostname: grafana
        restart: always
        ports:
            - "3000:3000"
        networks:
            - monitor

    node-exporter:
        image: quay.io/prometheus/node-exporter
        container_name: node-exporter
        hostname: node-exporter
        restart: always
        ports:
            - "9100:9100"
        networks:
            - monitor

    cadvisor:
        image: google/cadvisor:latest
        container_name: cadvisor
        hostname: cadvisor
        restart: always
        volumes:
            - /:/rootfs:ro
            - /var/run:/var/run:rw
            - /sys:/sys:ro
            - /var/lib/docker/:/var/lib/docker:ro
        ports:
            - "8080:8080"
        networks:
            - monitor
- 配置文件,首先是
prometheus.yml
mkdir -p /usr/local/src/config
cd /usr/local/src/config
vim prometheus.yml
global:
  scrape_interval:     15s # Set the scrape interval to every 15 seconds. Default is every 1 minute.
  evaluation_interval: 15s # Evaluate rules every 15 seconds. The default is every 1 minute.
  # scrape_timeout is set to the global default (10s).

# Alertmanager configuration
alerting:
  alertmanagers:
  - static_configs:
    - targets:
      # - alertmanager:9093

# Load rules once and periodically evaluate them according to the global 'evaluation_interval'.
rule_files:
  # - "first_rules.yml"
  # - "second_rules.yml"

# A scrape configuration containing exactly one endpoint to scrape:
# Here it's Prometheus itself.
scrape_configs:
  # The job name is added as a label `job=<job_name>` to any timeseries scraped from this config.
  - job_name: 'prometheus'

    # metrics_path defaults to '/metrics'
    # scheme defaults to 'http'.

    static_configs:
    - targets: ['localhost:9090']
  - job_name: 'springboot_app'
    scrape_interval: 5s
    metrics_path: '/actuator/prometheus'
    static_configs:
      - targets: ['192.168.1.9:8080']
        "labels": {


            "instance": "fast-commmon-prometheus-example",
            "service": "fast-commmon-prometheus-example-service"
        }
- 然后是邮件告警配置文件
global:
  smtp_smarthost: 'smtp.163.com:25'  #163服务器
  smtp_from: '[email protected]'        #发邮件的邮箱
  smtp_auth_username: '[email protected]'  #发邮件的邮箱用户名,也就是你的邮箱
  smtp_auth_password: 'TPP***'        #发邮件的邮箱密码
  smtp_require_tls: false        #不进行tls验证

route:
  group_by: ['alertname']
  group_wait: 10s
  group_interval: 10s
  repeat_interval: 10m
  receiver: live-monitoring

receivers:
- name: 'live-monitoring'
  email_configs:
  - to: '[email protected]'        #收邮件的邮箱
- 添加报警规则,vim node_down.yml
groups:
- name: node_down
  rules:
  - alert: InstanceDown
    expr: up == 0
    for: 1m
    labels:
      user: test
    annotations:
      summary: "Instance {

    { $labels.instance }} down"
      description: "{

    { $labels.instance }} of job {

    { $labels.job }} has been down for more than 1 minutes."
- 启动
docker-compose up -d,可以看到已经启动

监控 springboot 项目
- 项目我已放到
github,这个不在细说,想学习的可以点链接https://github.com/fafeidou/fast-cloud-nacos/tree/master/fast-common-examples/fast-commmon-prometheus-example - 启动 docker-compose 后,打开浏览器,输入地址 http://127.0.0.1:3000 ,输入用户名 admin 和密码 admin,登录进 grafana。我们先添加 data source:
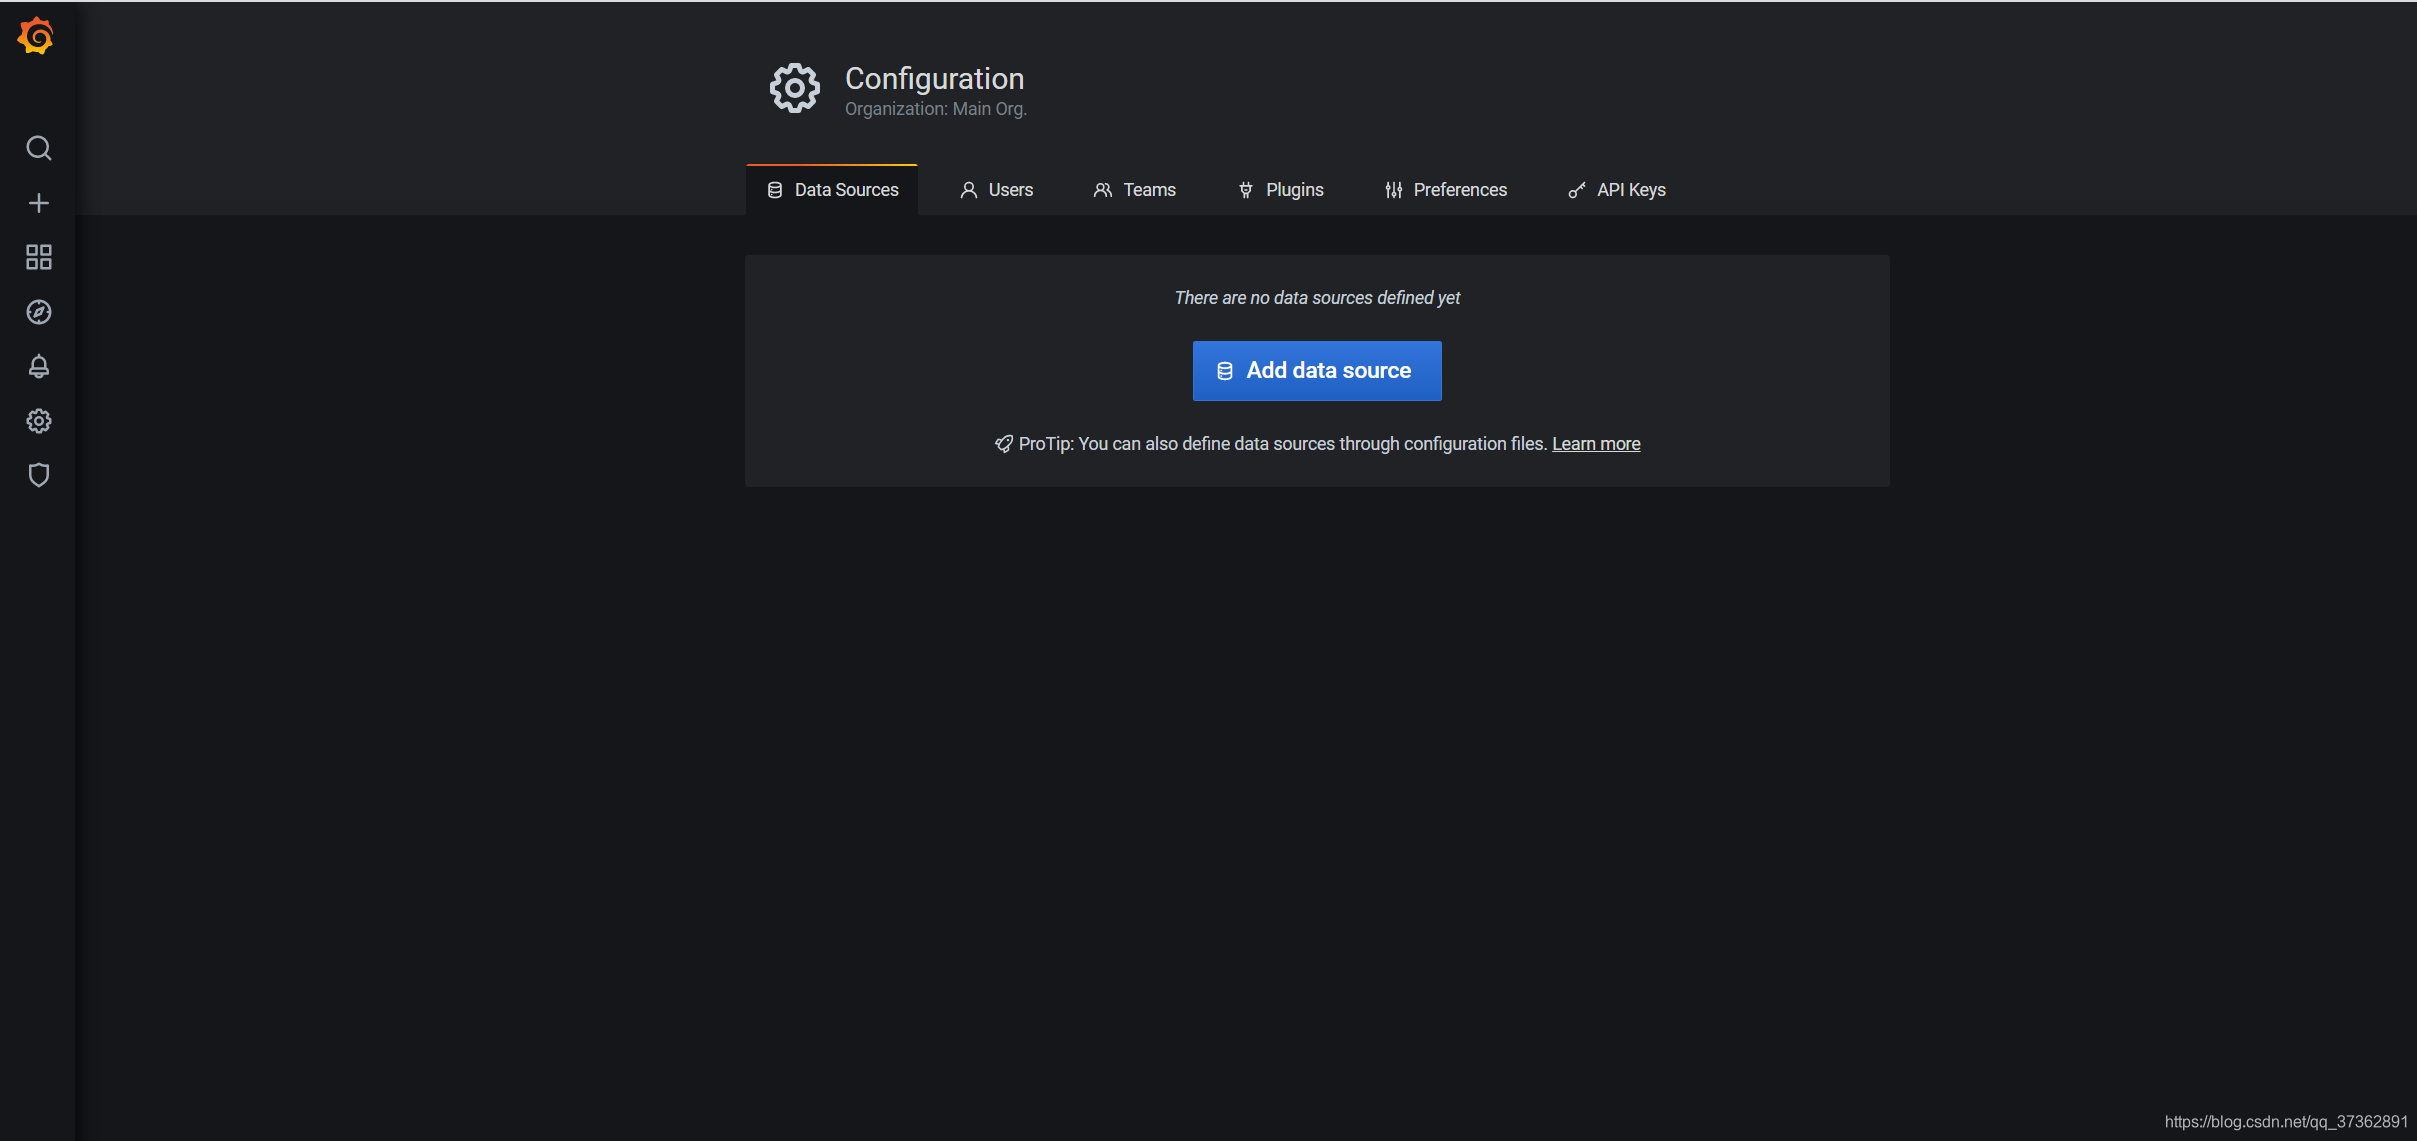
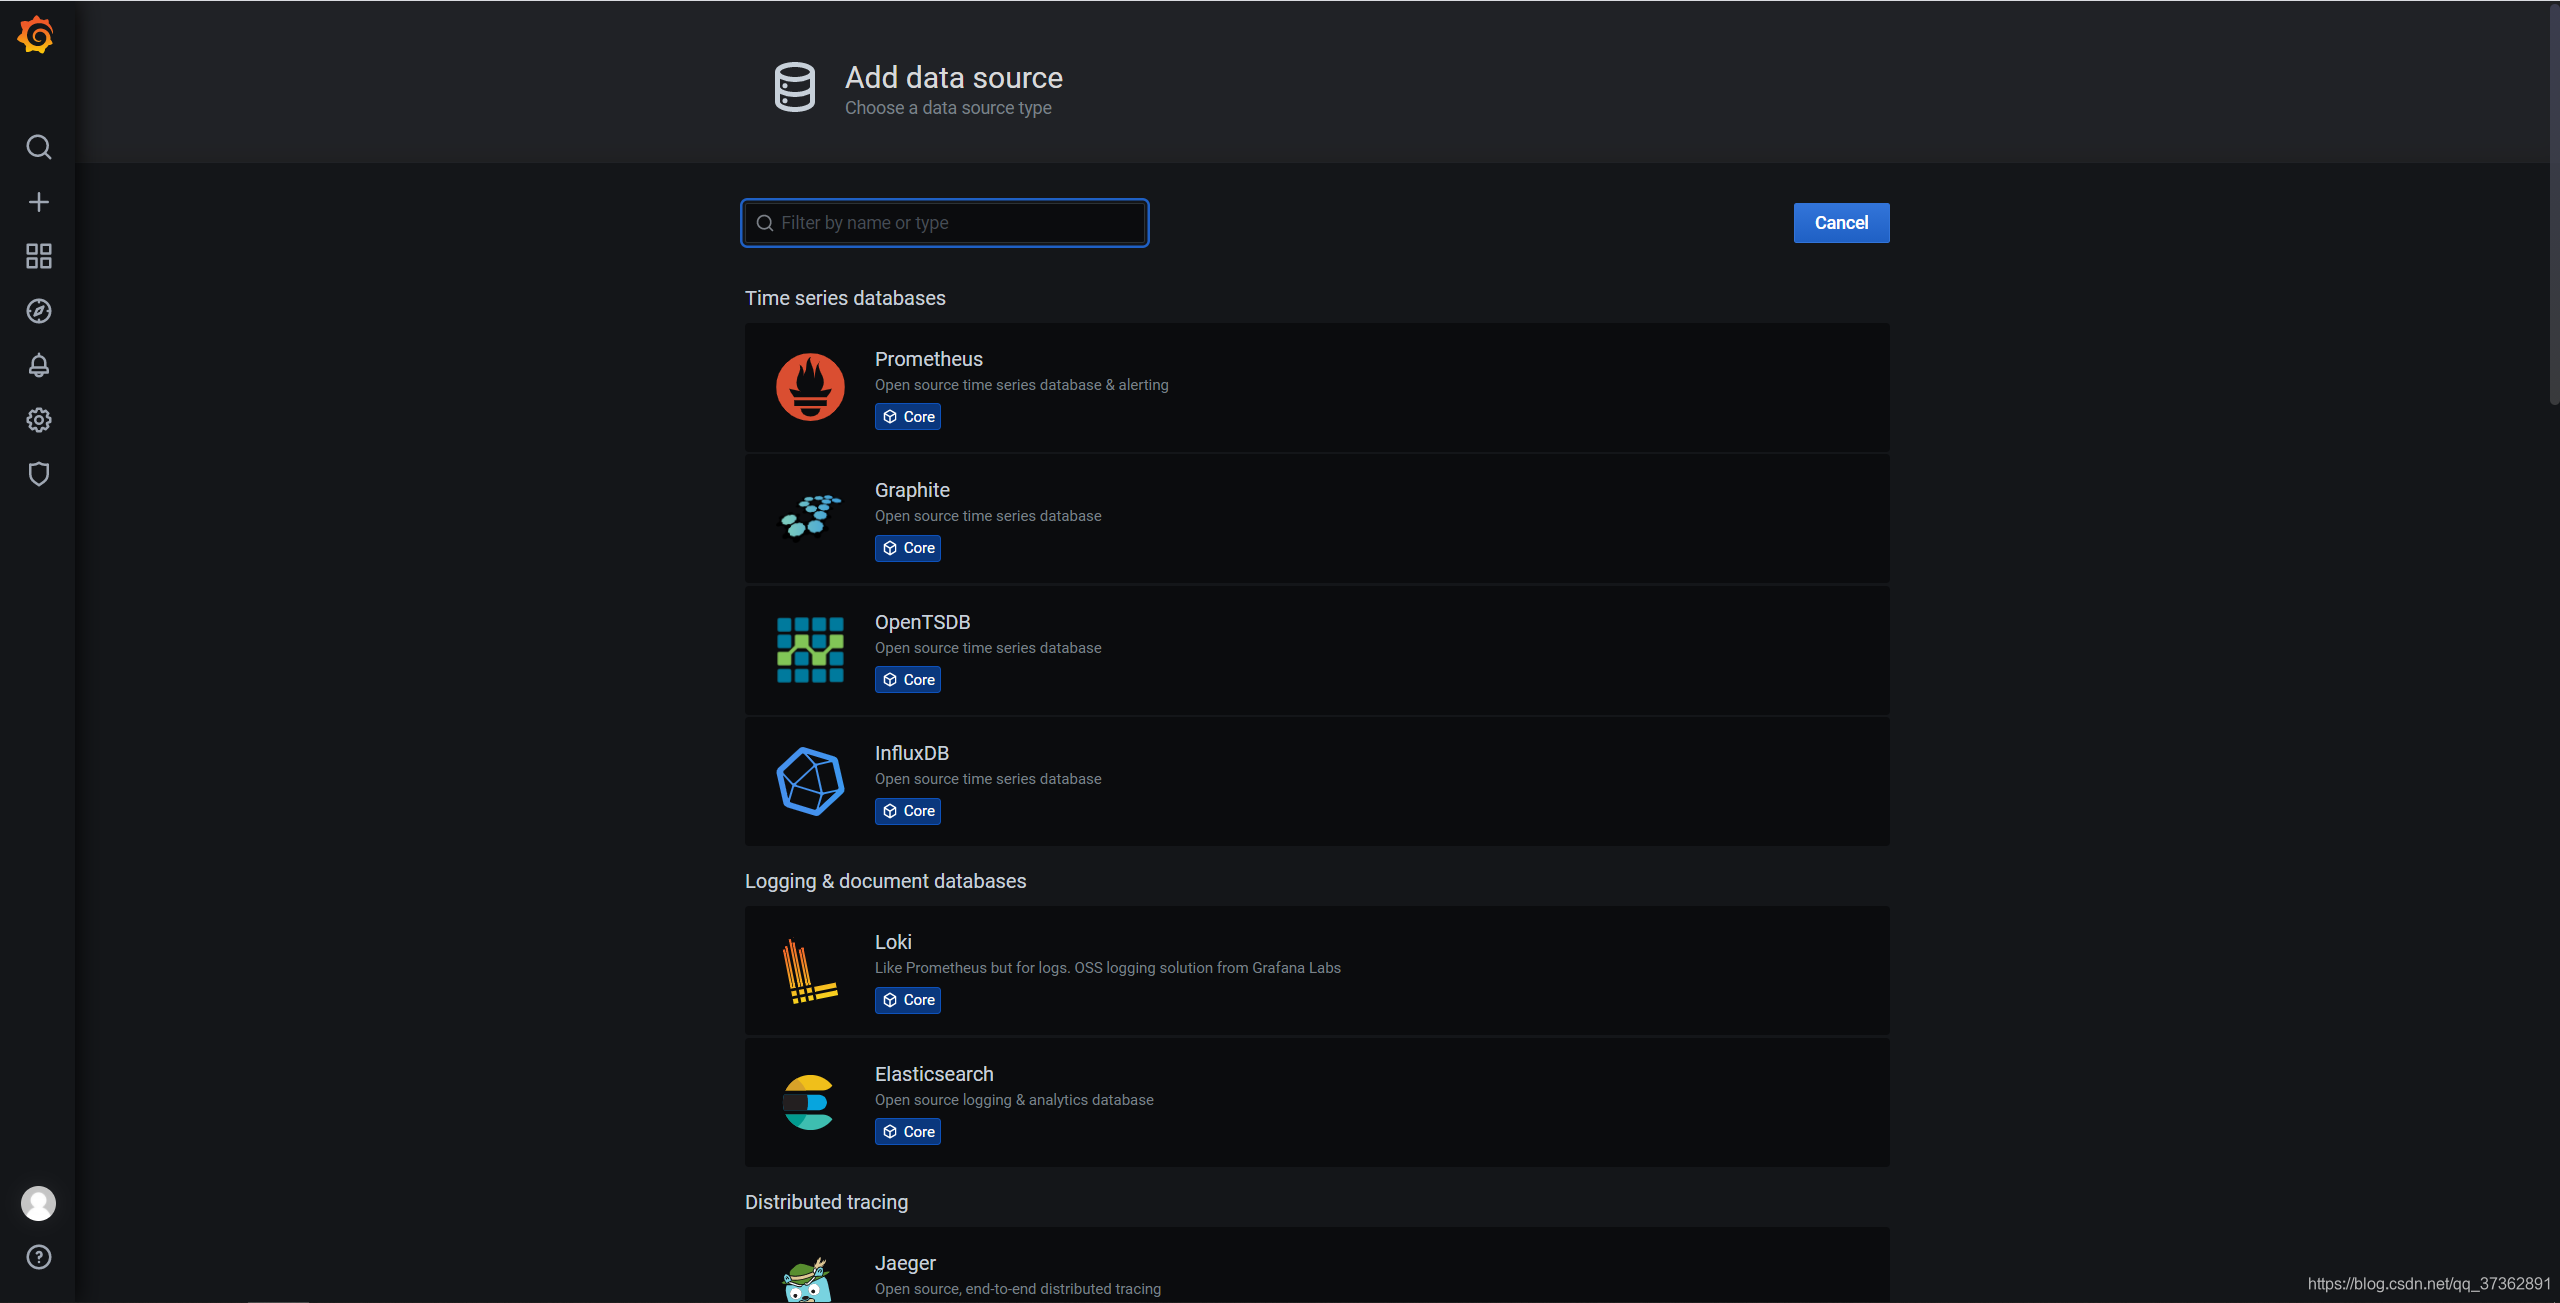
注意输入的 prometheus 地址为 http://192.168.56.124:9090。
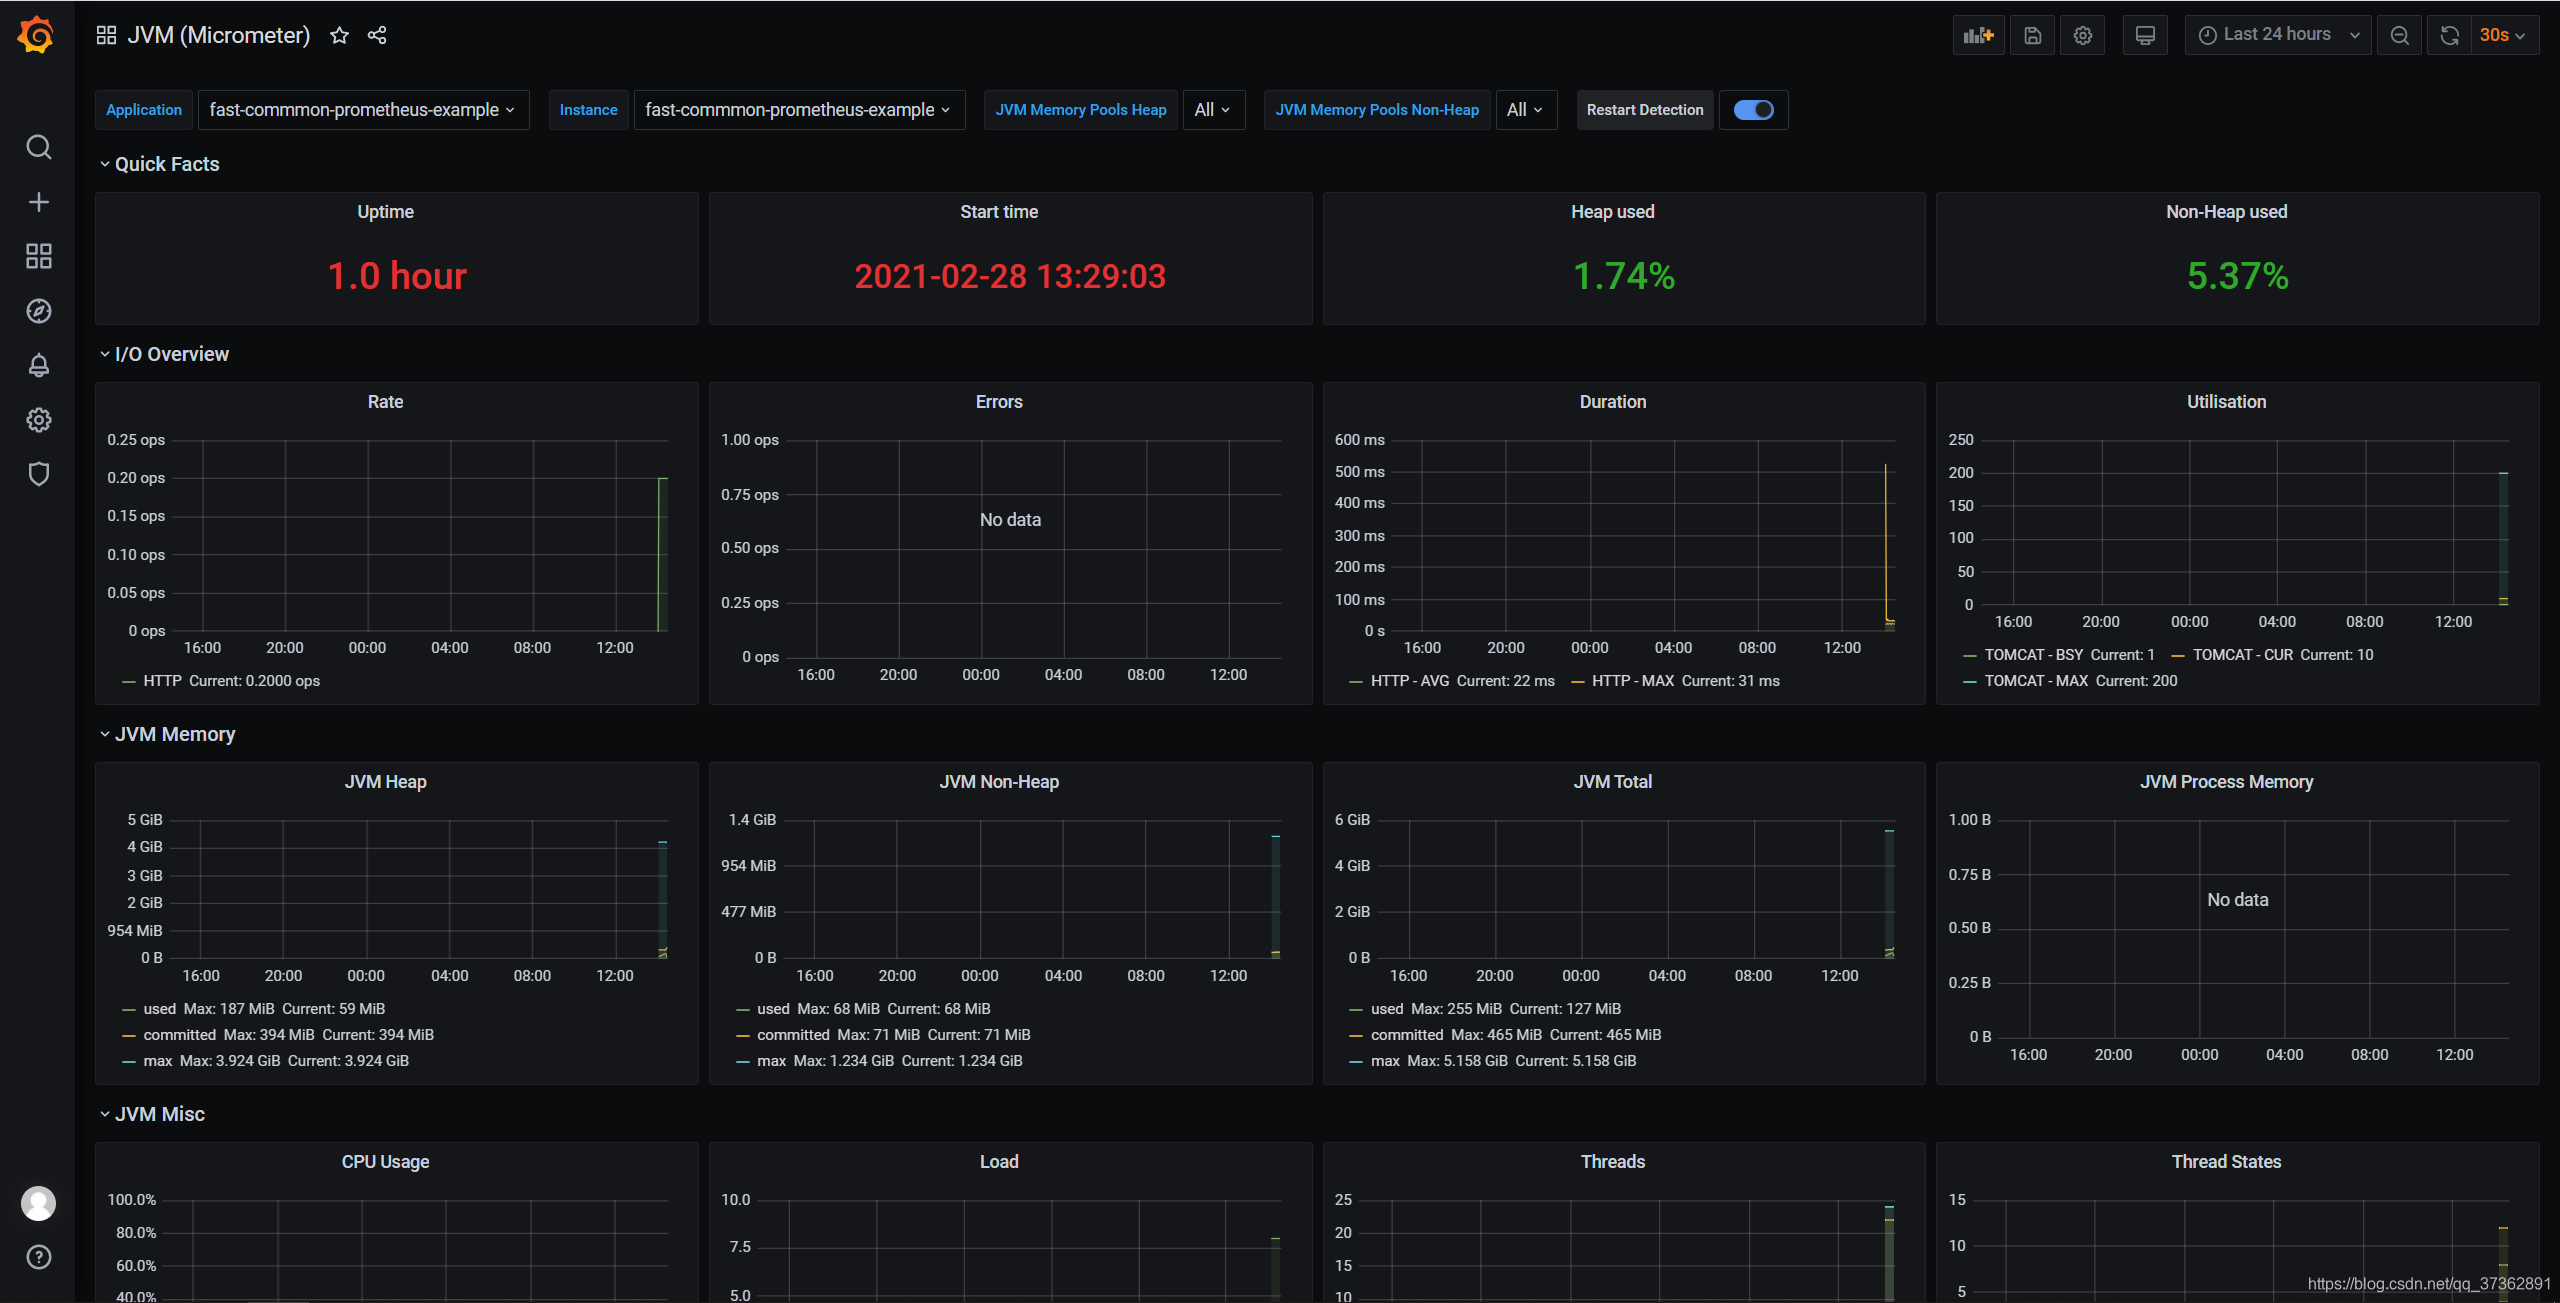
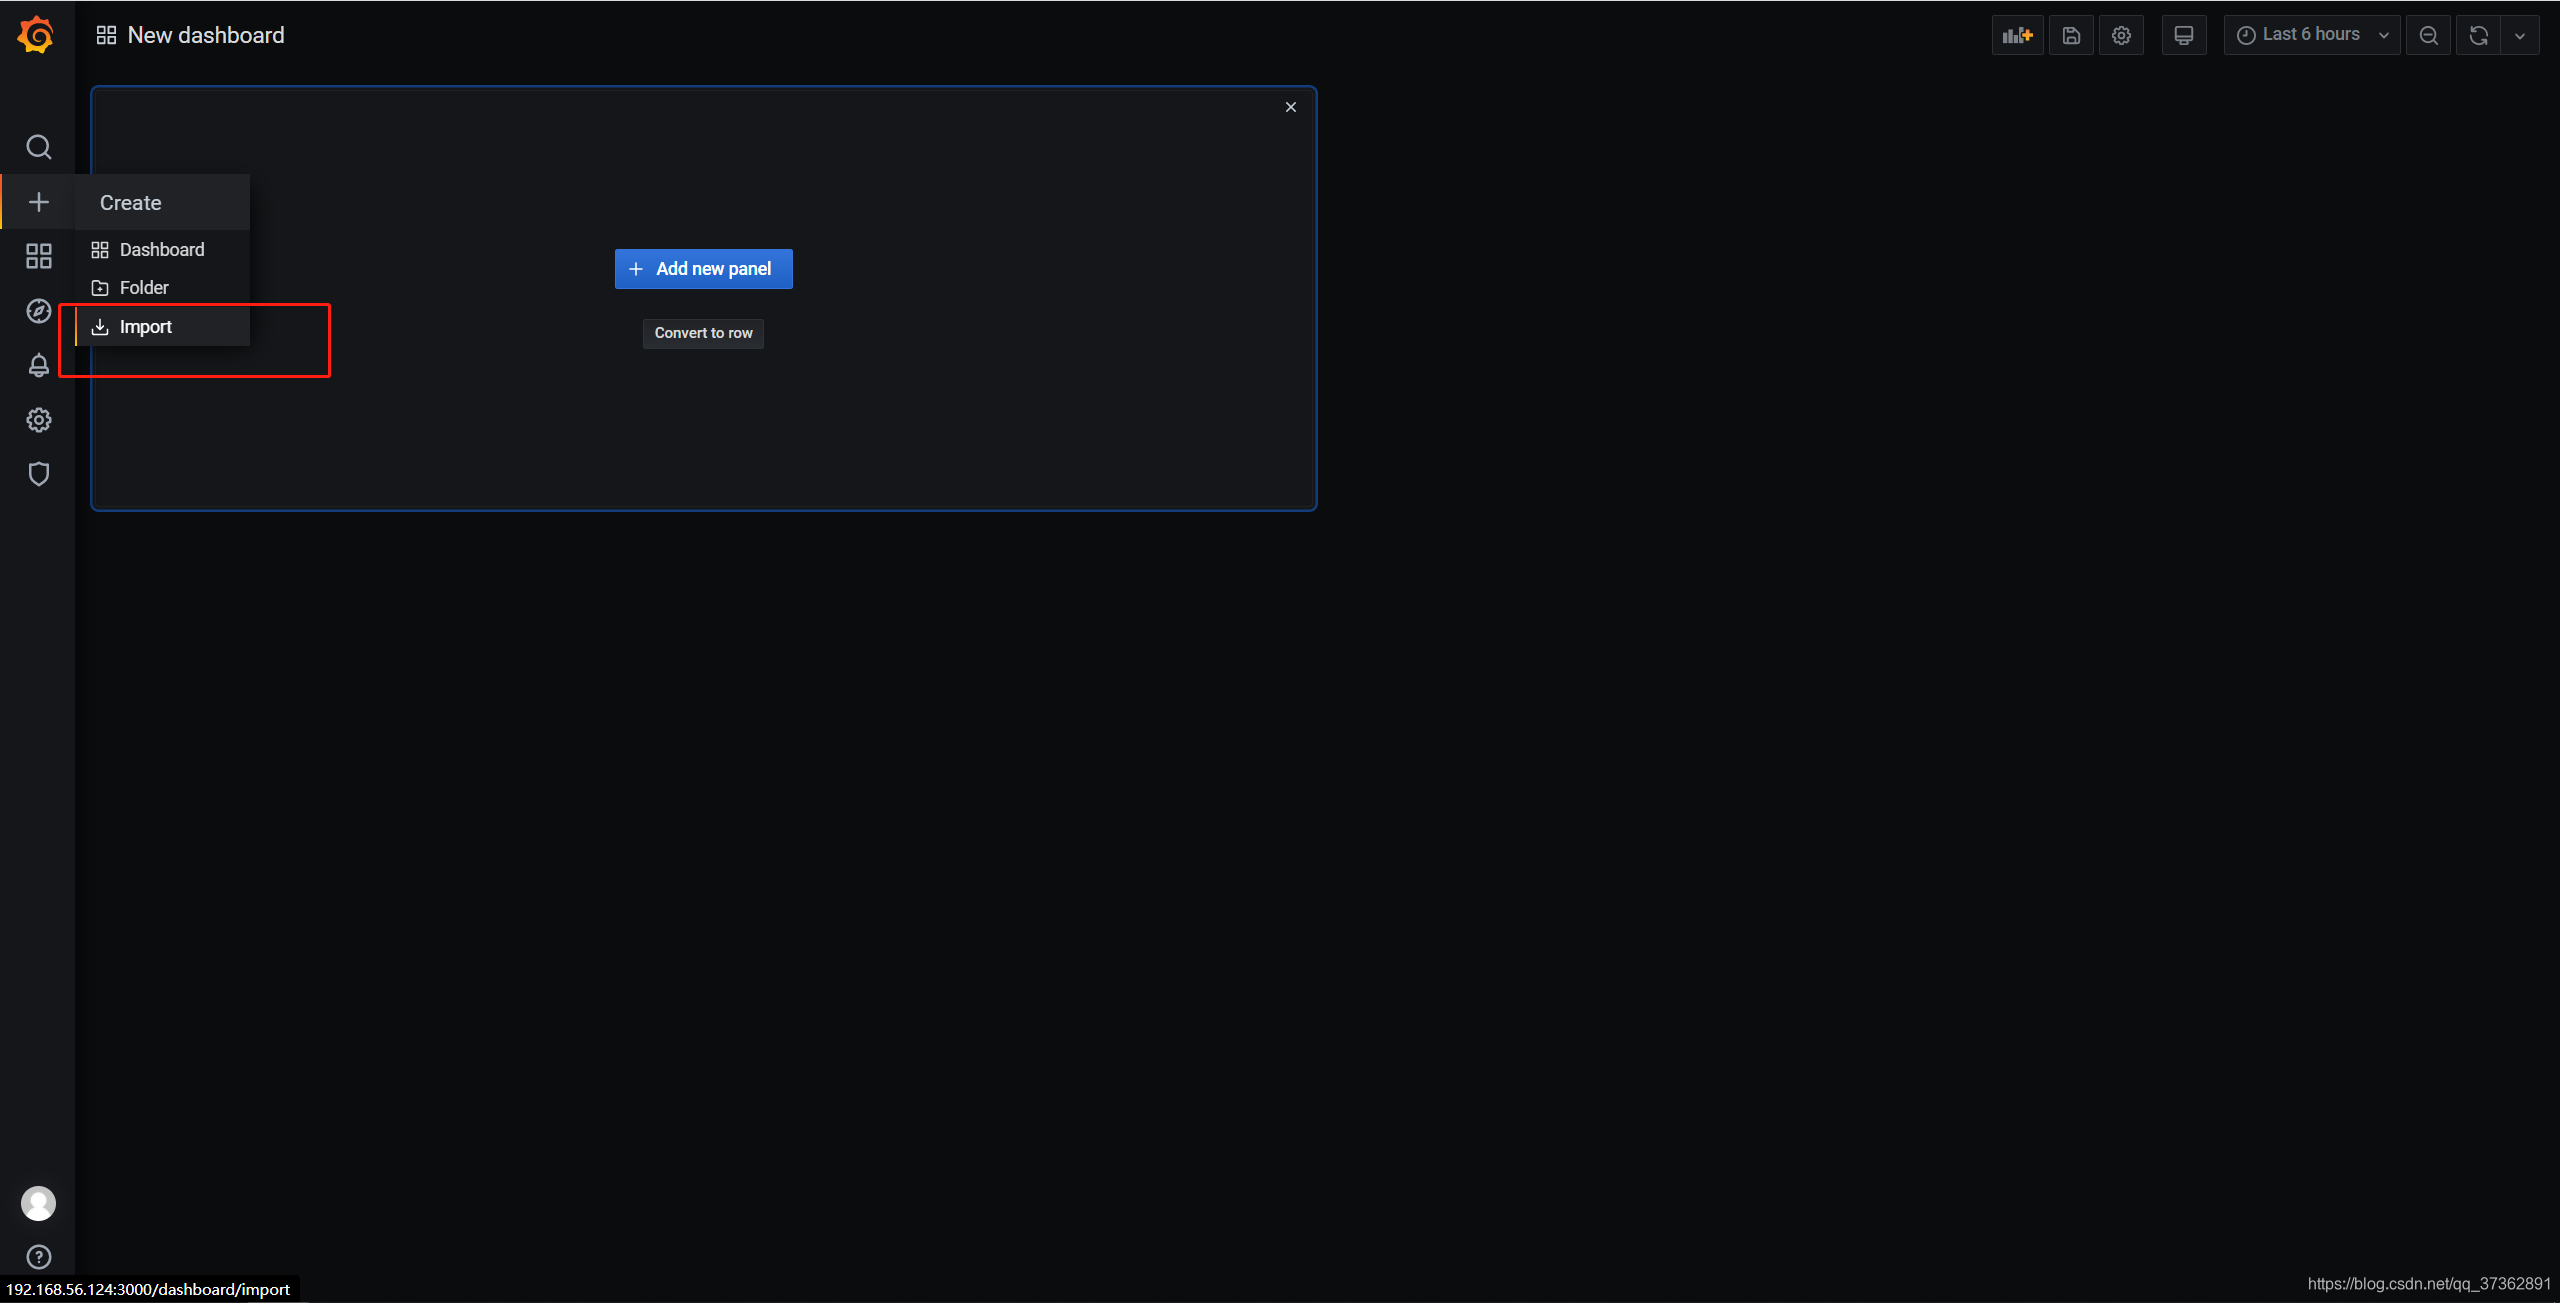
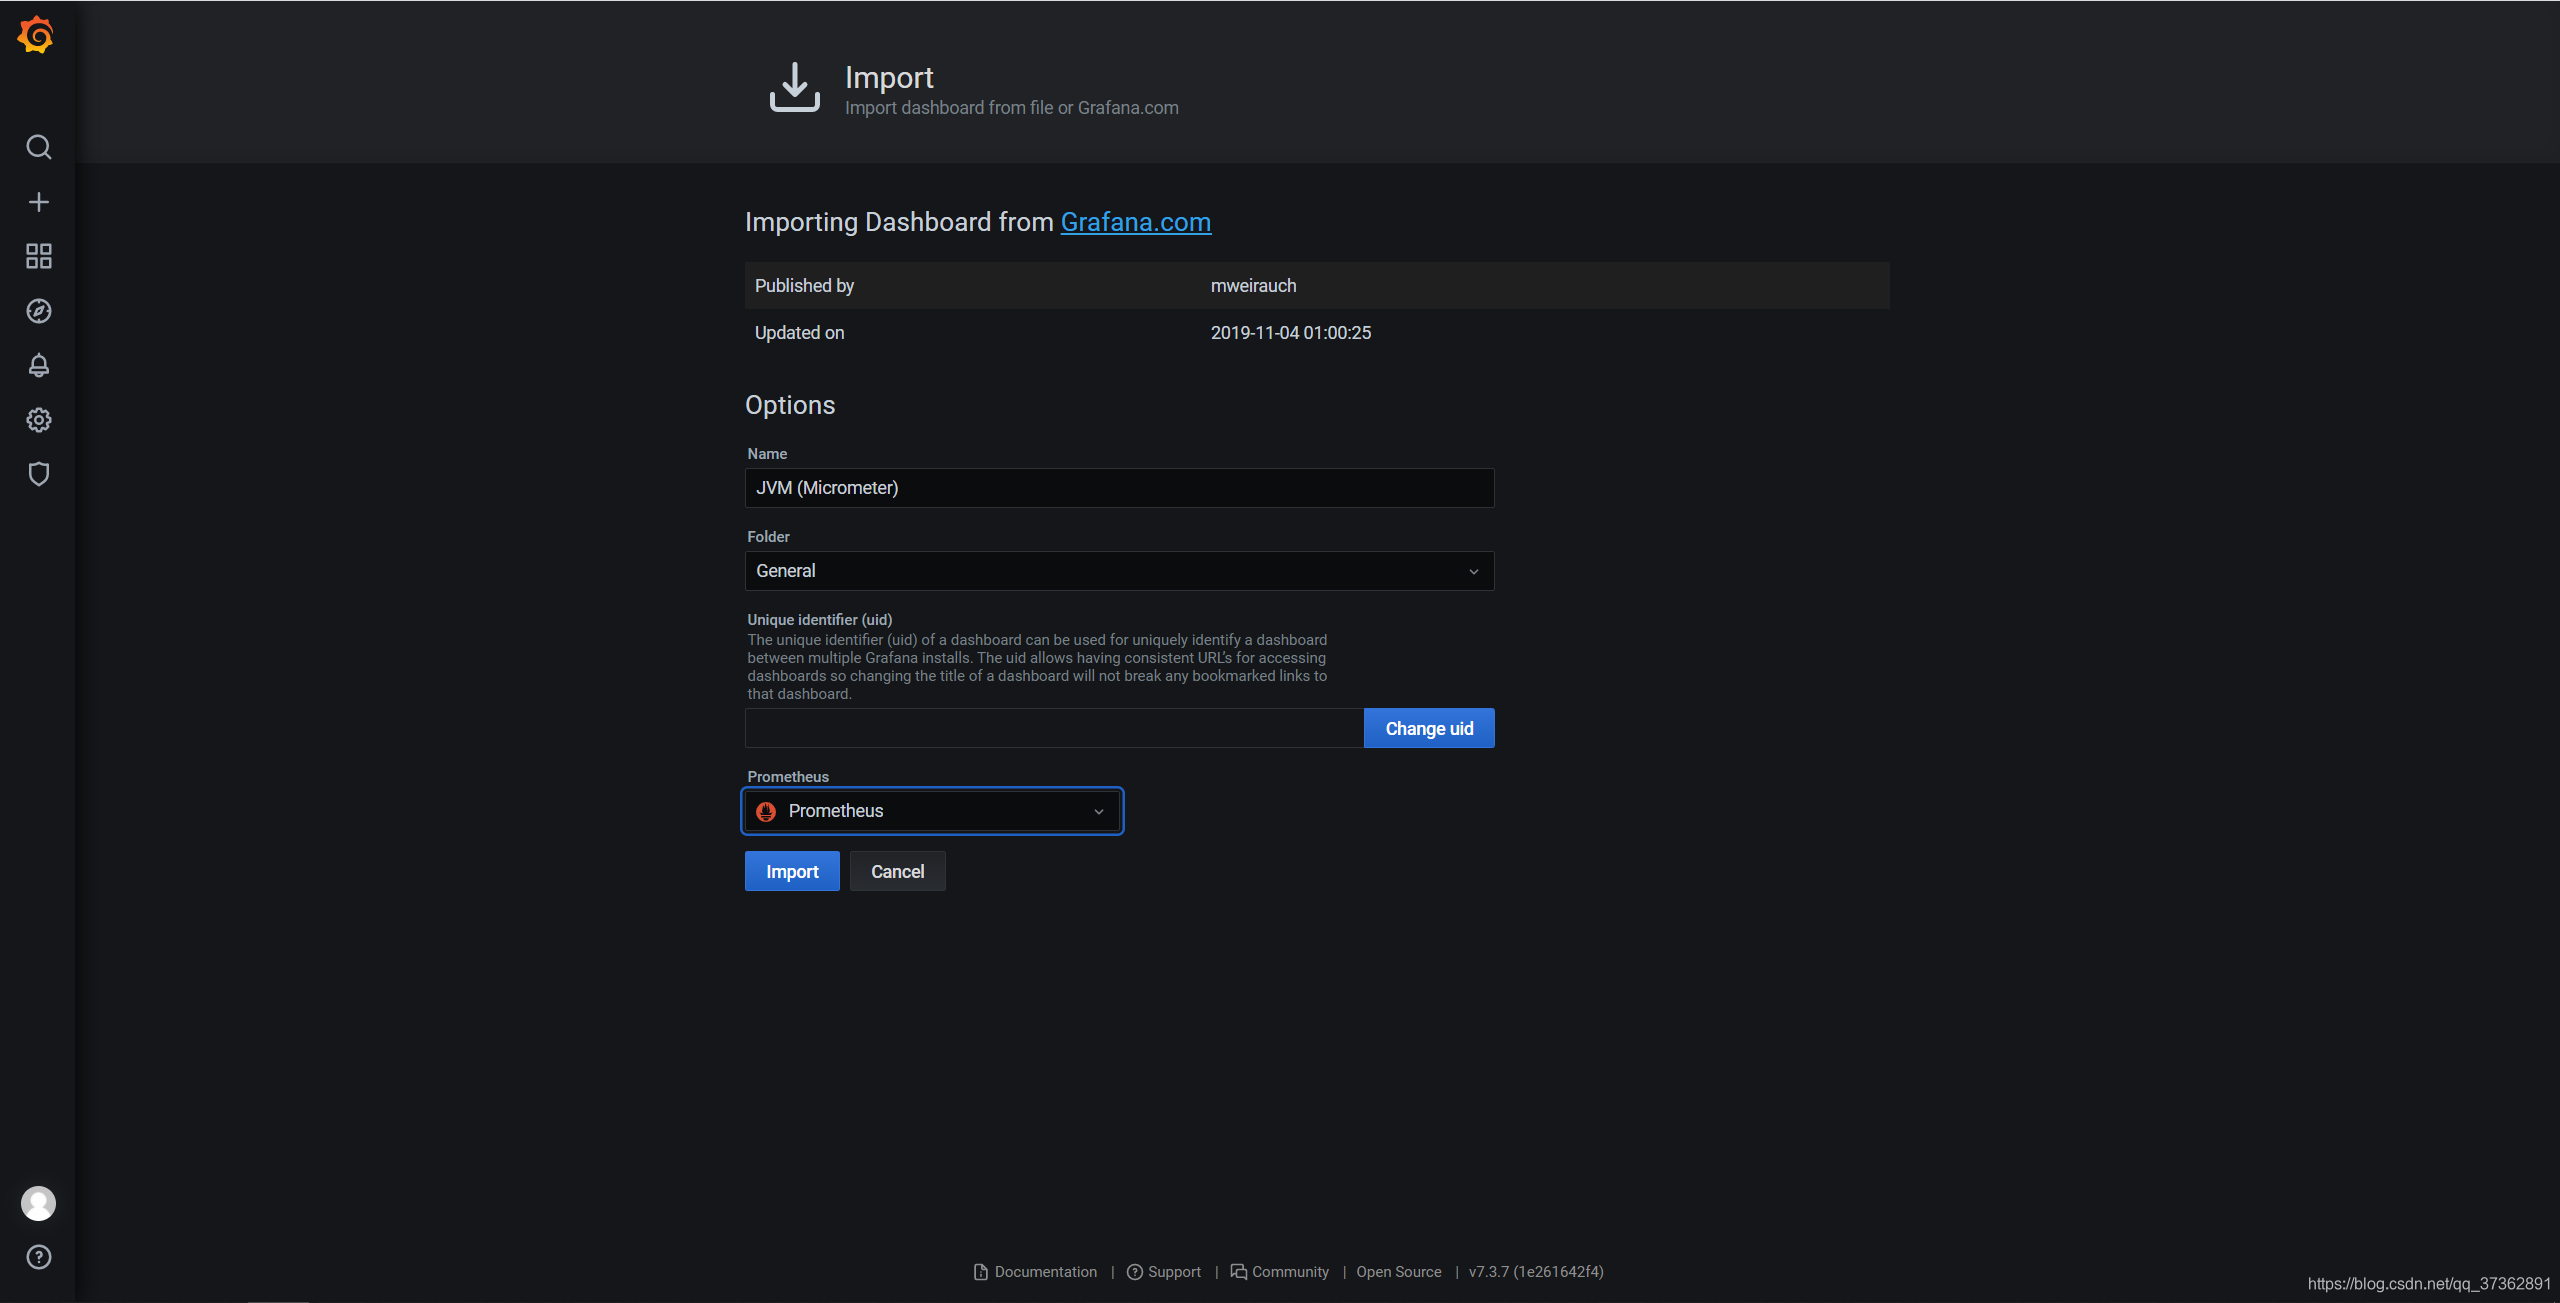
- 展示应用的 JVM 信息
Grafana 中已经有现成的 JVM 仪表盘,我们直接导入使用即可。这个仪表盘的编号为 4701。

至此,Prometheus + Grafana + Springboot 的整体流程已经跑通了。
但是,这些指标都是底层通用指标,在业务层面一定会有个性需求,下面我们自己定义一些监控指标。