一、简介
1、模型介绍
元胞自动机就是类似于一个系统,各个单元,即元胞都有联系,但整体的系统又对各个小的单元产生影响,这影响便可定义为规则。而我们的目的就是找到这些规则来进行预测未来系统的发展。(通过计算机的计算,来模拟一个复杂的自然过程)
元胞自动机是一种时间、空间、状态都离散,空间相互作用和时间因果关系为局部的网格动力学模型,具有模拟复杂系统时空演化过程的能力。
元胞自动机(CA)是一种用来仿真局部规则和局部联系的方法。典型的元
胞自动机是定义在网格上的,每一个点上的网格代表一个元胞与一种有限的状
态。变化规则适用于每一个元胞并且同时进行。
组成:
元胞:一个元胞相当于一个储存元件、可以记录状态
元胞空间:分为一维、二维、三维
状态和初始状态:就是初始的状态领域:一个元胞的领域由其周围的元胞组成
转换规则:状态转移的函数(多个规则一起作用)(典型的变化规则,决定于元胞的状态,以及其( 4 或 8 )邻居的状态。)
简单讲解:https://wk.baidu.com/view/ddf76d8c50e2524de4187e45?pcf=2&bfetype=new
2、模型适用范围或案例
1、容易与GIS、遥感数据处理等系统结合
2、城市发展演变、土地利用变化
3、应用于物理模拟,生物模拟等领域
4、森林火灾模拟
三、模型输入变量解释
元胞自动机仿真需要理解三点:
1、元胞:在matlab中可以理解为矩阵中的一点或多点组成的方形块,一般我们用矩阵中的一点代表一个元胞。
2、变化规则:元胞的变化规则决定元胞下一刻的状态。
3、元胞的状态:元胞的状态是自定义的,通常是对立的状态,比如生物的存活状态或死亡状态,红灯或绿灯,该点有障碍物或者没有障碍物等等。
3、模型输出变量解释
输出的是一个演化过程演化结束后的路径
二、源代码
%% NOTE
% Total runtime for this code was about 7.5 hours on the computer used by
% the original researcher (for 1000 run average of 3 different adherence
% values).
% This runtime is expected to vary from device to device, and is being used
% here to obtain a general comparison for runtime for the different
% models. It is not for a universal runtime value
% When run, this code does not display anything at the beginning. However,
% it will produce 2 graphs for each P_adh value every 2.5 hours approx.
%% Documentation
% n size of each dimension of our square cellular automata grid
% P_HIV fraction (probability) of cells initially infected by virus
% P_i probability of a healthy cell becoming infected if its
% neighborhood contains 1 I1 cell or X I2 cells
% P_v probability of a healthy cell becoming infected by coming
% in contact with a virus randomly (not from its
% neighborhood)
% P_RH Probability of a dead cell becoming replaced by a healthy
% cell
% P_RI Probability of a dead cell becoming replaced by an infected
% cell
% P_T1 Probability of a healthy cell receiving therapy 1
% P_iT1 Probability of a healthy cell receiving therapy 1 of
% becoming infected
% P_T2 Probability of a healthy cell receiving therapy 2
% P_iT2 Probability of a healthy cell receiving therapy 2 of
% becoming infected
% X Number of I2 cells in the neighborhood of an H cell that
% can cause it to become infected
% tau1 tau1 is the number of timesteps it takes for an acute
% infected cell to become latent.
% tau2 tau2 is the number of timesteps it takes for a latent
% infected cell to become dead.
% tau3 tau3 is the number of timesteps after which a healthy
% cell receiving dual therapy becomes a healthy cell again
% totalsteps totalsteps is the total number of steps of the CA (the
% total number of weeks of simulations)
% grid our cellular automata (CA) grid
% tempgrid tempgrid is a temporary grid full of random numbers that is
% used to randomly add different states to our CA grid.
% taugrid taugrid is a grid the same size as our CA grid that stores
% the number of timesteps that a cell has been in state I_1.
% If the number reaches tau1, then the state changes to I_2.
% state state is a [9 x totalsteps] size matrix that stores
% the total number of cells in each state at each timestep
% and the last 2 rows store total healthy and total infected
% cells
% timestep each simulation step of the cellular automata
% 1 timestep = 1 week of time in the real world
% nextgrid nextgrid is a temporary grid. It is a copy of the CA grid
% from the previous simulation. It stores all the CA rule
% updates of the current timestep and stores it all back to
% the grid to display.
%% Clean-up
clc; % clears command window
clear all; % clears workspace and deletes all variables
% close all; % closes all open figures
%% Parameters
n = 100; % meaning that our grid will have the dimensions n x n
P_HIV = 0.05; % initial grid will have P_hiv acute infected cells
P_i = 0.997; % probability of infection by neighbors
P_v = 0.00001; % probability of infection by random viral contact
P_RH = 0.99; % probability of dead cell being replaced by healthy
P_RI = 0.00001; % probability of dead cell being replaced by infected
P_T1 = 0.70; % probability of cell receiving therapy 1
P_iT1 = 0.07; % probability of infection of healthy with therapy 1
P_T2 = 0.50; % probability of cell receiving therapy 2
P_iT2 = 0.05; % probability of infection of healthy with therapy 2
X = 4; % there must be at least X I_2 neighbors to infect cell
tau1 = 4; % time delay for I_1 cell to become I_2 cell
tau2 = 1; % time delay for I_2 cell to become D cell
tau3 = 1; % time delay for H_Tb cell to become H cell
totalsteps = 600; % total number of weeks of simulation to be performed
T_start = 20; % The medication therapy will start on week T_start
totalruns = 1000; % total number of times to run the simulation to get an
% average
%% States
% State 1: H: Healthy (Color- Green)
% State 2: H_T1: Healthy with therapy 1 (Color- Red)
% State 3: H_T2: Healthy with therapy 2 (Color- Red)
% State 4: H_Tb: Healthy with dual therapy (Color- Red)
% State 5: I_1: Active Infected (Color- Cyan)
% State 6: I_2: Latent Infected (Color- Blue)
% State 7: D: Dead (Color- Black)
%% Simulation
for P_adh = 0.5:0.2:0.9
state1 = zeros(totalruns,totalsteps);
state2 = zeros(totalruns,totalsteps);
state3 = zeros(totalruns,totalsteps);
state4 = zeros(totalruns,totalsteps);
state5 = zeros(totalruns,totalsteps);
state6 = zeros(totalruns,totalsteps);
state7 = zeros(totalruns,totalsteps);
for run = 1:totalruns
state1dev = std(state1);
state2dev = std(state2);
state3dev = std(state3);
state4dev = std(state4);
state5dev = std(state5);
state6dev = std(state6);
state7dev = std(state7);
state8dev = state1dev + state2dev + state3dev + state4dev;
state9dev = state5dev + state6dev;
state1mean = mean(state1);
state2mean = mean(state2);
state3mean = mean(state3);
state4mean = mean(state4);
state5mean = mean(state5);
state6mean = mean(state6);
state7mean = mean(state7);
state8mean = state1mean + state2mean + state3mean + state4mean;
state9mean = state5mean + state6mean;
% The following lines of code are to display a graph of each state of
% cells during simulation
set(figure, 'OuterPosition', [200 100 700 500]) % sets figure window size
plot( 1:totalsteps , state1mean, 'g', ...
1:totalsteps , state2mean, 'r', ...
1:totalsteps , state3mean, 'm', ...
1:totalsteps , state4mean, 'y', ...
1:totalsteps , state5mean, 'c', ...
1:totalsteps , state6mean, 'b', ...
1:totalsteps , state7mean, 'k' , 'linewidth', 2 );
xlim([0 600]);
ylim([0 10000]);
hold on;
gridxy(20,'Color',[0.8 0.5 0.0],'linewidth',5) ;
errorbar( 1:15:totalsteps , state1mean(1:15:totalsteps), state1dev(1:15:totalsteps), 'g');
errorbar( 1:15:totalsteps , state2mean(1:15:totalsteps), state2dev(1:15:totalsteps), 'r');
errorbar( 1:15:totalsteps , state3mean(1:15:totalsteps), state3dev(1:15:totalsteps), 'm');
errorbar( 1:15:totalsteps , state4mean(1:15:totalsteps), state4dev(1:15:totalsteps), 'y');
errorbar( 1:15:totalsteps , state5mean(1:15:totalsteps), state5dev(1:15:totalsteps), 'c');
errorbar( 1:15:totalsteps , state6mean(1:15:totalsteps), state6dev(1:15:totalsteps), 'b');
errorbar( 1:15:totalsteps , state7mean(1:15:totalsteps), state7dev(1:15:totalsteps), 'k');
legend( 'Therapy start week', 'Healthy', 'Healthy with Therapy1', 'Healthy with Therapy2', ...
'Healthy with dual Therapy', 'Acute Infected', 'Latent Infected', ...
'Dead', 'Location' ,'NorthEast' );
saveas(gcf,strcat('Model3withAdherencePadh',num2str(P_adh*100),'Graph1.pdf'));
% The following lines of code are to display a graph of each state of
% cells during simulation
set(figure, 'OuterPosition', [200 100 700 500]) % sets figure window size
plot( 1:totalsteps , state8mean, 'g', ...
1:totalsteps , state9mean, 'b', ...
1:totalsteps , state7mean, 'k' , 'linewidth', 2 );
xlim([0 600]);
ylim([0 10000]);
hold on;
gridxy(20,'Color',[0.8 0.5 0.0],'linewidth',5) ;
errorbar( 1:15:totalsteps , state8mean(1:15:totalsteps), state8dev(1:15:totalsteps), 'g');
errorbar( 1:15:totalsteps , state9mean(1:15:totalsteps), state9dev(1:15:totalsteps), 'b');
errorbar( 1:15:totalsteps , state7mean(1:15:totalsteps), state7dev(1:15:totalsteps), 'k');
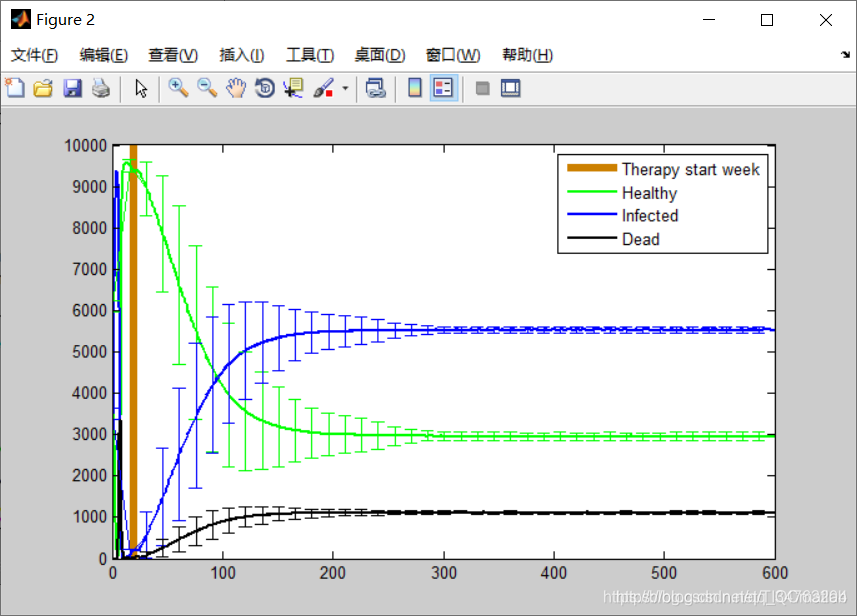
legend( 'Therapy start week', 'Healthy', 'Infected', 'Dead', ...
'Location' ,'NorthEast' );
saveas(gcf,strcat('Model3withAdherencePadh',num2str(P_adh*100),'Graph2.pdf'));
end
三、运行结果

四、备注
完整代码或者代写添加QQ912100926
往期回顾>>>>>>
【元胞自动机】元胞自动机之双车道交通流模型含靠右行驶【Matlab 164期】
【元胞自动机】元胞自动机的晶体生长【Matlab 165期】
【元胞自动机】元胞自动机之求解城市小区开放对周边道路通行的影响研究【Matlab 166期】
【元胞自动机】元胞自动机的图像处理【Matlab 167期 】
【元胞自动机】元胞自动机的森林大火【Matlab 168期】