拉普拉斯算子
拉普拉斯算子是最简单的各向同性微分算子,它具有旋转不变性。
我们经常把它作为边缘检测之一,也是工程数学中常用的一种积分变换,也可以用于图像增强、角点检测等等。
这里只给出它的代码,原理可参考其他博客及百科。
在图像处理中,拉普拉斯算子为离散的形式,其核心就是一个3✖3的卷积核。
# 图像增强算法
# 拉普拉斯算子,自编写实现,利用空域卷积运算实现滤波
# 具有图像增强效果,同时亦可用于边缘检测、角点检测

import cv2
import numpy as np
import matplotlib.pyplot as plt


if __name__ == '__main__':
    src = cv2.imread('enhance.jpg', 1)

    plt.subplot(3, 2, 1)
    plt.imshow(src)
    plt.axis('off')
    plt.title('Offical')

    kernel = np.array([[-1, -1, -1],
                       [2, 2, 2],
                       [-1, -1, -1]])
    horizontal_edge = cv2.filter2D(src, cv2.CV_32F, kernel)
    horizontal_edge = cv2.convertScaleAbs(horizontal_edge)
    # _, horizontal_edge = cv2.threshold(horizontal_edge, horizontal_edge.max() * 0.8, 255, cv2.THRESH_BINARY)

    plt.subplot(3, 2, 2)
    plt.imshow(horizontal_edge)
    plt.axis('off')
    plt.title('horizontal_edge')

    kernel = np.array([[-1, 2, -1],
                       [-1, 2, -1],
                       [-1, 2, -1]])
    vertical_edge = cv2.filter2D(src, ddepth=cv2.CV_32F, kernel=kernel)
    vertical_edge = cv2.convertScaleAbs(vertical_edge)
    # _, vertical_edge = cv2.threshold(vertical_edge, vertical_edge.max() * 0.8, 255, cv2.THRESH_BINARY)

    plt.subplot(3, 2, 3)
    plt.imshow(vertical_edge)
    plt.axis('off')
    plt.title('vertical_edge')

    kernel = np.array([[-1, -1, 2],
                       [-1, 2, -1],
                       [2, -1, -1]])
    positive_45_deg_edge = cv2.filter2D(src, ddepth=cv2.CV_32F, kernel=kernel)
    positive_45_deg_edge = cv2.convertScaleAbs(positive_45_deg_edge)
    # positive_45_deg_edge = cv2.threshold(positive_45_deg_edge, positive_45_deg_edge.max() * 0.8, 255, cv2.THRESH_BINARY)

    plt.subplot(3, 2, 4)
    plt.imshow(positive_45_deg_edge)
    plt.axis('off')
    plt.title('positive_45_deg_edge')

    kernel = np.array([[2, -1, -1],
                       [-1, 2, -1],
                       [-1, -1, 2]])
    negative_45_deg_edge = cv2.filter2D(src, ddepth=cv2.CV_32F, kernel=kernel)
    negative_45_deg_edge = cv2.convertScaleAbs(negative_45_deg_edge)
    # negative_45_deg_edge = cv2.threshold(negative_45_deg_edge, negative_45_deg_edge.max() * 0.8, 255, cv2.THRESH_BINARY)
    cv2.imshow('negative_45_deg_edge', negative_45_deg_edge)
    plt.subplot(3, 2, 5)
    plt.imshow(negative_45_deg_edge)
    plt.axis('off')
    plt.title('negative_45_deg_edge')

    plt.show()
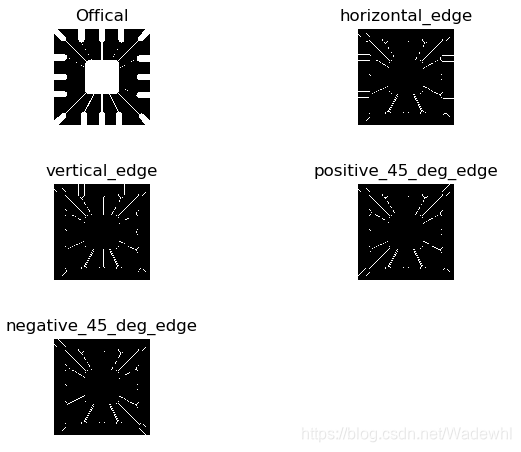
结果展示:
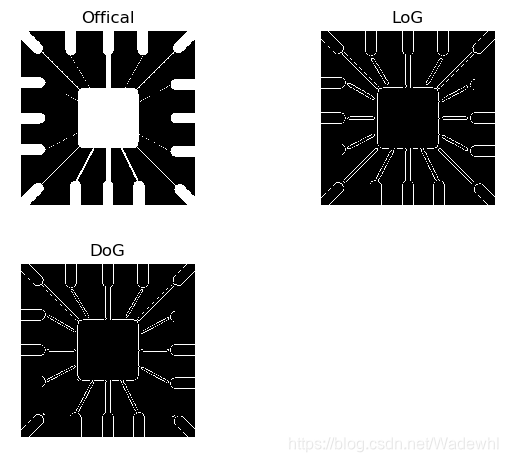
LoG和DoG算子
LoG和DoG算子是拉普拉斯算子的改进方法。
LoG:高斯拉普拉斯算子(LoG,Laplacian of Gaussian),首先对图像进行高斯暖卷积滤波进行降噪处理,再采用Laplace算子进行边缘检测。
DoG:高斯函数差分(DoG, Difference of Gaussian), 是可以通过将图像与高斯函数进行卷积得到一幅图像的低通滤波结果,即去噪过程,这里的Gaussian和高斯低通滤波器的高斯一样,是一个函数,即为正态分布函数。同时,它对高斯拉普拉斯LoG的近似.
# 图像增强算法
# LoG和DoG算子
# 均为基于拉普拉斯算子的改进
# 可用于边缘检测和角点检测

import cv2
import numpy as np
import matplotlib.pyplot as plt


def genGaussianKernel(ksize, sigma):
    half_ksize = ksize // 2
    C = 2 * np.pi * sigma * sigma
    x = y = np.linspace(-half_ksize, half_ksize, ksize)
    x, y = np.meshgrid(x, y)
    kernel = np.exp(-(x ** 2 + y ** 2) / (2 * sigma ** 2)) / C
    return kernel


def zerosCrossing(src, thresh):
    dsize = (src.shape[1], src.shape[0])
    M = np.array([[1, 0, -1], [0, 1, 0]], dtype=np.float32)
    shift_left = cv2.warpAffine(src, M, dsize)
    M = np.array([[1, 0, 1], [0, 1, 0]], dtype=np.float32)
    shift_right = cv2.warpAffine(src, M, dsize)

    M = np.array([[1, 0,  0], [0, 1, -1]], dtype=np.float32)
    shift_up = cv2.warpAffine(src, M, dsize)
    M = np.array([[1, 0,  0], [0, 1, 1]], dtype=np.float32)
    shift_down = cv2.warpAffine(src, M, dsize)

    M = np.array([[1, 0,  1], [0, 1, 1]], dtype=np.float32)
    shift_right_down = cv2.warpAffine(src, M, dsize)
    M = np.array([[1, 0,  -1], [0, 1, -1]], dtype=np.float32)
    shift_left_up = cv2.warpAffine(src, M, dsize)

    M = np.array([[1, 0,  1], [0, 1, -1]], dtype=np.float32)
    shift_right_up = cv2.warpAffine(src, M, dsize)
    M = np.array([[1, 0,  -1], [0, 1, 1]], dtype=np.float32)
    shift_left_down = cv2.warpAffine(src, M, dsize)

    shift_left_right_sign = (shift_left * shift_right)
    shift_up_down_sign = (shift_up * shift_down)
    shift_rd_lu_sign = (shift_right_down * shift_left_up)
    shift_ru_ld_sign = (shift_right_up * shift_left_down)

    shift_left_right_norm = abs(shift_left - shift_right)
    shift_up_down_norm = abs(shift_up - shift_down)
    shift_rd_lu_norm = abs(shift_right_down - shift_left_up)
    shift_ru_ld_norm = abs(shift_right_up - shift_left_down)

    candidate_zero_crossing = \
        ((shift_left_right_sign < 0) & (shift_left_right_norm > thresh)).astype('uint8') +\
        ((shift_up_down_sign < 0) & (shift_up_down_norm > thresh)).astype('uint8') + \
        ((shift_rd_lu_sign < 0) & (shift_rd_lu_norm > thresh)).astype('uint8') + \
        ((shift_ru_ld_sign < 0) & (shift_ru_ld_norm > thresh)).astype('uint8')

    ResImg = np.zeros(shape=src.shape, dtype=np.uint8)
    ResImg[candidate_zero_crossing >= 2] = 255

    return ResImg


def LoG(src, ksize, sigma=0, thresh=None, alpha=0.01):
    blur_img = cv2.GaussianBlur(src.astype('float32'), (ksize, ksize), sigmaX=sigma)
    LoG_img = cv2.Laplacian(blur_img, cv2.CV_32F)
    if thresh is None:
        thresh = abs(LoG_img).max() * alpha
    edge_image = zerosCrossing(LoG_img, thresh)
    return edge_image


def DoG(src, ksize, sigma, thresh=None, alpha=0.01):
    sigma2 = sigma / 1.6
    kernel_1 = genGaussianKernel(ksize=ksize, sigma=sigma)
    kernel_2 = genGaussianKernel(ksize=ksize, sigma=sigma2)
    kernel = kernel_1 - kernel_2

    DoG_img = cv2.filter2D(src=src, ddepth=cv2.CV_32FC1, kernel=kernel)
    if thresh is None:
        thresh = abs(DoG_img).max() * alpha
    edge_image = zerosCrossing(src=DoG_img, thresh=thresh)
    return edge_image


if __name__ == "__main__":
    src = cv2.imread('enhance.jpg', 1)

    plt.subplot(2, 2, 1)
    plt.imshow(src)
    plt.axis('off')
    plt.title('Offical')

    edge_log = LoG(src=src, ksize=25, alpha=0.05)

    plt.subplot(2, 2, 2)
    plt.imshow(edge_log)
    plt.axis('off')
    plt.title('LoG')

    edge_dog = DoG(src=src, ksize=25, sigma=4, alpha=0.1)

    plt.subplot(2, 2, 3)
    plt.imshow(edge_dog)
    plt.axis('off')
    plt.title('DoG')

    plt.show()
结果展示: