由于之前的排版较混乱,现重新整理发布
TProfiler工具
TProfiler是一个可以在生产环境长期使用的性能分析工具。它同时支持剖析和采样两种方式,记录方法执行的时间和次数,生成方法热点、对象创建热点、线程状态分析等数据,为查找系统性能瓶颈提供数据支持。
TProfiler在JVM启动时把时间采集程序注入到字节码中,整个过程无需修改应用源码.运行时会把数据写到日志文件,一般情况下每小时输出的日志小于50M。
业界同类开源产品都不是针对大型Web应用设计的,对性能消耗较大不能长期使,TProfiler解决了这个问题。目前TProfiler已应用于淘宝的核心Java前端系统。
关于更多工具的使用,请参考官方wiki:https://github.com/alibaba/TProfiler/wiki
定位性能瓶颈
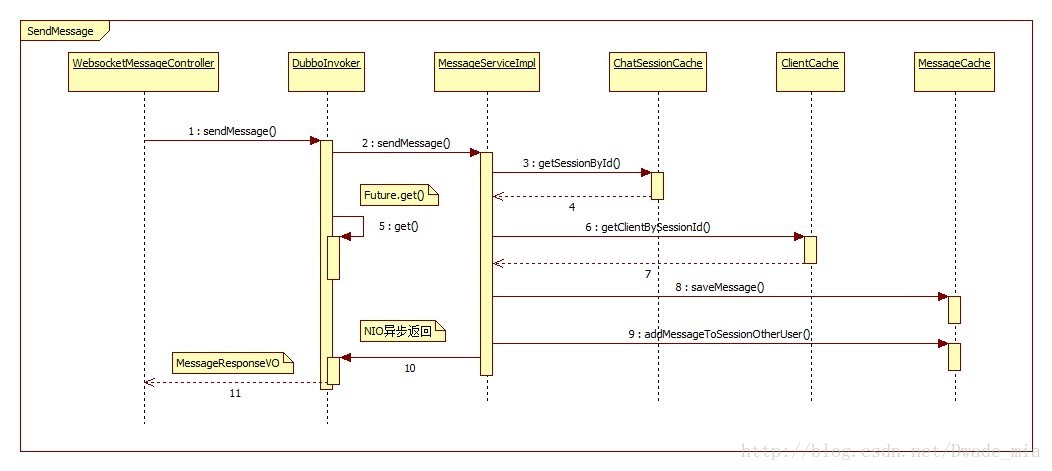
在线客服触屏版使用了websocket,下图是websocket消息发送的流程图
(查看原图)
根据业务流程,选取关键代码对其进行跟踪采样,在使用Tprofiler时需要设置profiler.properties,部分信息如下,其中includePackageStartsWith是指定哪些包需要受到监控。
includePackageStartsWith = org.springframework.messaging.simp.broker;org.springframework.messaging.support;com.alibaba.dubbo.rpc.proxy;net.dwade.livechat.dubbo.service;net.dwade.livechat.touch.client.controller.stomp
excludePackageStartsWith = com.taobao.sketch;org.apache;com.taobao
在 jvm 启动参数中添加-javaagent:/path/tprofiler.jar -Dprofile.properties=/path/profile.properties,然后重启应用。
Tprofiler实践
需要查看Tprofiler的数据,需要先执行flushMethod操作,将内存中的数据写入日志文件中,其中50001是Tprofiler的端口,由profiler.properties指定:
java -cp /dwade/tomcat/tomcat_touch_test/bin/TProfiler/tprofiler-1.0.1.jar com.taobao.profile.client.TProfilerClient 10.112.172.125 50001然后对线程和方法调用进行统计,其中tsampler.log是数据样本,stat-method.log、stat-thread.log是统计输出文件。
java -cp /dwade/tomcat/tomcat_touch_test/bin/TProfiler/tprofiler-1.0.1.jar com.taobao.profile.analysis.SamplerLogAnalysis tsampler.log stat-method.log stat-thread.log再对热点方法和对象进行统计,其中tprofiler.log、tmethod.log是数据样本,top-method.log、top-object.log是统计输出文件。
java -cp /dwade/tomcat/tomcat_touch_test/bin/TProfiler/tprofiler-1.0.1.jar com.taobao.profile.analysis.ProfilerLogAnalysis tprofiler.log tmethod.log top-method.log top-object.log最后得到stat-method.log、stat-thread.log、top-method.log、top-object.log
TProfiler数据分析
线程数据分析
查看stat-thread.log,可以得到线程的状态统计数据,比如哪些线程经常出现阻塞,哪些线程比较繁忙、哪些线程比较空闲等。下面是部分数据:
3562    New I/O client worker #1-19 RUNNABLE    6187
3196    LiveChat-WebSocketSessionManagerThread-7    WAITING 6187
21219   clientInboundChannel-2728   TIMED_WAITING   38
……
23458   clientInboundChannel-2769   BLOCKED 32
……
由上述数据可知,clientInboundChannel-*线程经常出现阻塞,再结合tsampler.log中的线程栈信息,或者使用jstack命令,很快就可以找到该线程阻塞的原因。如下图所示,在DefaultSubscriptionRegistry.java的第269行出现阻塞:
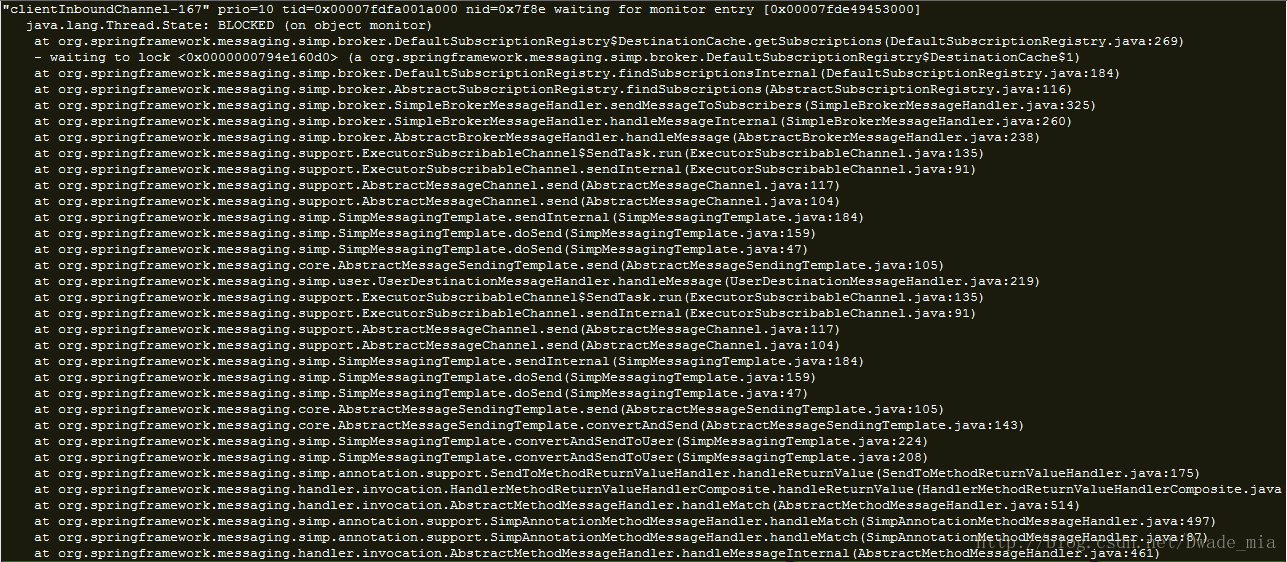
在getSubscriptions方法中,如果result为null,则出现synchronized锁,因为在accessCache中获取不到数据,为什么呢?因为使用的updateCache的value是LinkedMultiValueMap,如果当前size大于cacheLimit,则将最少访问的数据删除。代码如下所示:
private class DestinationCache {

    /** Map from destination -> <sessionId, subscriptionId> for fast look-ups */
    private final Map<String, LinkedMultiValueMap<String, String>> accessCache =
            new ConcurrentHashMap<String, LinkedMultiValueMap<String, String>>(DEFAULT_CACHE_LIMIT);

    /** Map from destination -> <sessionId, subscriptionId> with locking */
    @SuppressWarnings("serial")
    private final Map<String, LinkedMultiValueMap<String, String>> updateCache =
            new LinkedHashMap<String, LinkedMultiValueMap<String, String>>(DEFAULT_CACHE_LIMIT, 0.75f, true) {
                @Override
                protected boolean removeEldestEntry(Map.Entry<String, LinkedMultiValueMap<String, String>> eldest) {
                    if (size() > getCacheLimit()) {
                        accessCache.remove(eldest.getKey());
                        return true;
                    }
                    else {
                        return false;
                    }
                }
            };


    public LinkedMultiValueMap<String, String> getSubscriptions(String destination, Message<?> message) {
        LinkedMultiValueMap<String, String> result = this.accessCache.get(destination);
        if (result == null) {
            synchronized (this.updateCache) {
                result = new LinkedMultiValueMap<String, String>();
                for (SessionSubscriptionInfo info : subscriptionRegistry.getAllSubscriptions()) {
                    for (String destinationPattern : info.getDestinations()) {
                        if (getPathMatcher().match(destinationPattern, destination)) {
                            for (Subscription subscription : info.getSubscriptions(destinationPattern)) {
                                result.add(info.sessionId, subscription.getId());
                            }
                        }
                    }
                }
                if (!result.isEmpty()) {
                    this.updateCache.put(destination, result.deepCopy());
                    this.accessCache.put(destination, result);
                }
            }
        }
        return result;
    }

    // other code......
}
热点方法分析
查看stat-method.log,可以看到在采样期间目标方法被调用的次数,主要是关注哪些方法用的较多,下面是部分数据:
org.apache.tomcat.util.threads.TaskThread$WrappingRunnable.run(TaskThread.java:61) 77921
org.jboss.netty.util.ThreadRenamingRunnable.run(ThreadRenamingRunnable.java:108)    64885
org.jboss.netty.util.internal.DeadLockProofWorker$1.run(DeadLockProofWorker.java:44)   64885
org.jboss.netty.channel.socket.nio.NioWorker.run(NioWorker.java:163)    64861
org.jboss.netty.channel.socket.nio.SelectorUtil.select(SelectorUtil.java:38)    64861
org.apache.tomcat.util.threads.TaskQueue.take(TaskQueue.java:32)    50518
org.apache.tomcat.util.threads.TaskQueue.take(TaskQueue.java:104)   50518
org.apache.tomcat.util.threads.TaskQueue.poll(TaskQueue.java:86)    26948
org.apache.tomcat.util.threads.TaskQueue.poll(TaskQueue.java:32)    26948
top方法数据分析
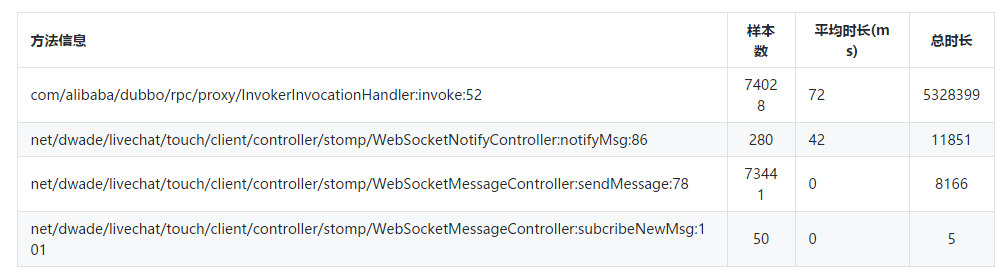
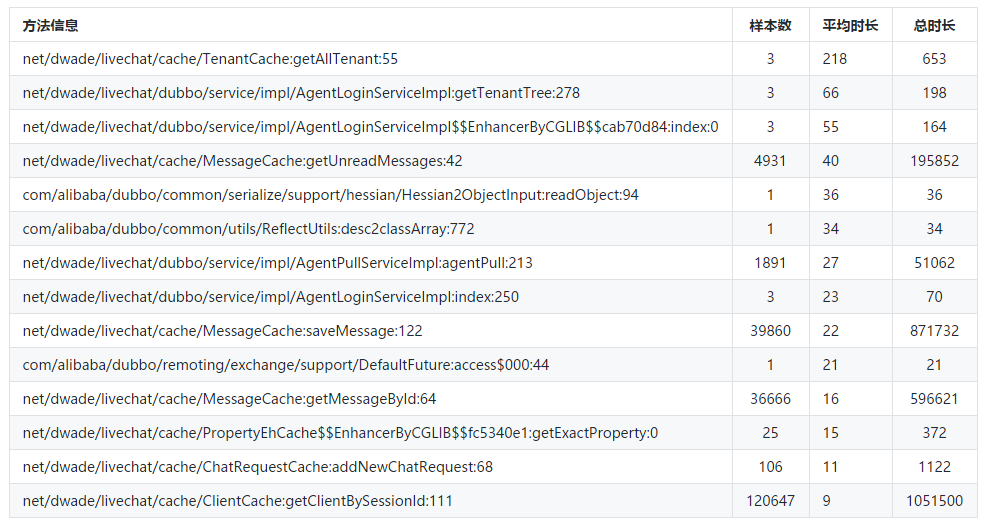
查看top-method.log,可以看到目标方法在采样期间的调用总时长、调用次数、平均耗时,下面是部分数据:
net/dwade/livechat/cache/ClientCache:getClientBySessionId:111   120647  9   1051500
net/dwade/livechat/cache/ChatSessionCache:getSessionById:45 105245  9   991919
net/dwade/livechat/cache/MessageCache:saveMessage:122   39860   22  871732
net/dwade/livechat/cache/MessageCache:getMessageById:64 36666   16  596621
net/dwade/livechat/cache/ChatRequestCache:getChatRequest:128    85844   6   477680
整理后的数据如下:
touch-client应用
dubbo应用
性能调优
关于tomcat等中间件的优化,这里不再重复,请另行参考相关的帖子。
减少线程BLOCKED
在线程数据分析章节中,我们分析了spring websocket的高并发场景下的线程阻塞问题。项目中,我们使用了spring默认的消息代理,在SimpleBrokerMessageHandler中有一个致命的弱点,就是使用了DefaultSubscriptionRegistry,而在这个里面又使用了DestinationCache,这是一个基于LinkedHashMap实现的LRU缓存策略,如果缓存大小超过了cacheLimit值,则会去将原有旧的数据清理掉,并且再次读取的时候仍然会去读取所有的订阅地址直到找到符合条件的,涉及到写的部分,都加了synchronized重量级锁,所以在压测的过程中这一块的线程BLOCK也是相对较频繁的,程序的并发性能下降。目前,项目中还未使用消息中间件,后续如果接入消息中间件,对应用系统的性能将会有很大提高。
有以下3种优化方案:
1. 增大cacheLimit值,扩大缓存数据量,减少频繁加锁;
2. 使用spring的BeanPostProcessor,改变SimpleBrokerMessageHandler的subscriptionRegistry实现类,这个方案难度比较大而且还有一定的风险,需要经过严格的测试;
3. 使用消息中间件,spring会将订阅操作交给消息中间件处理,这样便可以避免这个问题。
dubbo代码优化
dubbo日志输出
因为dubbo默认使用的log4j日志实现,但是项目里面使用的是logback,导致dubbo框架内部的日志无法输出(包括ERROR日志),不方便后续定位问题,以下日志是非常重要的:
1. com.alibaba.dubbo.rpc.RpcException: Invoke remote method timeout
2. c.a.d.c.t.s.AbortPolicyWithReport - [DUBBO] Thread pool is EXHAUSTED!
解决办法:在tomcat的启动脚本中加下以下jvm参数:-Ddubbo.application.logger=slf4j
cache优化
在top方法数据分析里面,我们得到了dubbo服务的方法执行耗时的统计数据:
MessageCache.getUnreadMessages()、ChatRequestCache.getChatRequest()、ChatSessionCache.getSessionById()等,这些方法有一个共同点就是大量使用了hget方法,其中ChatRequestCache.getChatRequest()使用了20+次hget调用reids取值,部分代码如下所示:
@Override
public ChatRequest getChatRequest(String requestId){

    String key = CacheConstants.ChatRequestCacheKey.PREFIX_CHAT_REQUEST+requestId;

    if(cache.exists(key)){

        ChatRequest chatRequest = new ChatRequest();
        chatRequest.setId(requestId);
        chatRequest.setClientId(cache.hget(key,"clientId"));
        chatRequest.setFromUserId(cache.hget(key,"fromUserId") );
        chatRequest.setToUserId(cache.hget(key,"toUserId") );
        String creationTime = cache.hget(key,"creationTime");

        if(!StringUtils.isEmpty(creationTime)){
          chatRequest.setCreationTime(DateUtil.str2Date(creationTime,DateUtil.YYYYMMDDHHMMSSSSS));
        }

        chatRequest.setWorkgroupId(cache.hget(key,"workgroupId"));
        String endTime = cache.hget(key,"endTime");
        if(!StringUtils.isEmpty(endTime)){
          chatRequest.setEndTime(DateUtil.str2Date(endTime,DateUtil.YYYYMMDDHHMMSSSSS ));
        }

        // 此处省略10行hget代码......

        return chatRequest;
    }

    return null;
}
因为会涉及多次数据传输,所以这个方法的性能较差。而JedisCluster中提供了hmset、hmget的api,如下图所示。但是考虑到hmset在并发情况下会有线程安全问题,hset方法可以先不改造,并且目前是读多写少的场景。也就是说,将多个hget方法改造成一个hmget,一次性获取多个字段值,从而提升查询性能。
JVM调优
为了提高系统的吞吐量,减少GC停顿时间,采用并行回收机制,同时为了减轻老年代GC压力,将更多的对象预留在新生代,设置了较大的新生代大小,并且提高了新生代触发GC的域值。
MEM_ARGS="-server -Xmx3550m -Xms3550m -Xmn2g -XX:PermSize=64m -XX:MaxPermSize=128m -XX:TargetSurvivorRatio=80 -XX:+UseParNewGC -XX:ParallelGCThreads=16 -XX:+UseConcMarkSweepGC"
JAVA_OPTS="-XX:+HeapDumpOnOutOfMemoryError -XX:HeapDumpPath=/dwade/livechat/log/jvm/touch-test.dump -Ddubbo.application.logger=slf4j $JAVA_OPTS $MEM_ARGS"
可以使用监控工具对主机资源进行监控,也可以使用常用的一些命令,比如top。另外还需要对GC活动进行监控,使用jstat –gcutil命令可以粗粒度地了解GC活动,也可以使用VisualVM进行可视化监控。