一、简介
1)对观测信号去均值是ICA算法最基本和最必须的预处理步骤,其处理过程是从观测中减去信号的均值向量,使得观测信号成为零均值变量。该预处理只是为了简化 ICA算法,并不意味着均值不能估计出来。
2)一般情况下所获得的数据都具有相关性,通常都要求对数据进行初步的白化或球化处理,因为白化处理可去除各观测信号之间的相关性,从而简化后续独立分量的提取过程。通常情况下,数据进行白化处理与不对数据进行白化处理相比,算法的收敛性较好,有更好的稳定性。
3)对多个独立分量的估计,需要将最大非高斯性的方法加以扩展。对应于不同独立分量的向量在白化空间中应是正交的,算法第6步用压缩正交化保证分离出来的是不同的信号,但是该方法的缺点是第1个向量的估计误差会累计到随后向量的估计上。
简单地说快速ICA算法通过三步完成:首先,对观测信号去均值;然后,对去均值后的观测信号白化处理;前两步可以看成是对观测信号的预处理,通过去均值和白化可以简化ICA算法。最后,独立分量提取算法及实现流程见流程图。
FastICA算法的方法输出向量,在排列顺序的时候可能出现颠倒和输出信号幅度发生变化。这主要是由于ICA的算法存在2个内在的不确定性导致的:
1)输出向量排列顺序的不确定性,即无法确定所提取的信号对应原始信号源的哪一个分量;
2)输出信号幅度的不确定性,即无法恢复到信号源的真实幅度。
但由于主要信息都包含在输出信号中,这2种不确定性并不影响其应用。
二、源代码
clear all
%% --------------------------------- Set Parameters
N = 1; %The number of observed mixtures
Ns = 2; %The number of independent sources
Ls = 1000; %Sample size, i.e.: number of observations
finalTime = 40*pi; %Final sample time (s)
initialTime = 0; %Initial sample time (s)
%% --------------------------------- Generating Data for SSA-ICA
Amix = rand(N,Ns); %Amix is a random N x Ns mixing matrix
timeVector = initialTime:(finalTime-initialTime)/(Ls-1):finalTime; %Vector of time coordinates
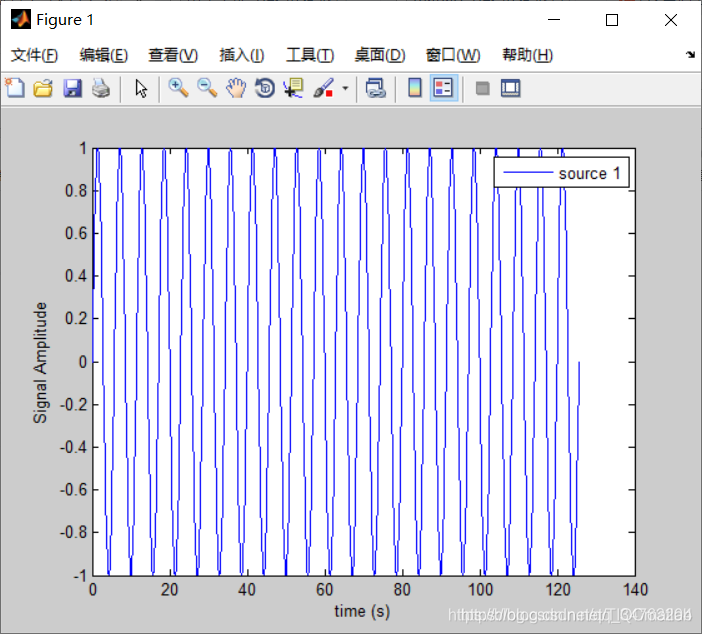
source1 = sin(1.1*timeVector); %Independent source component 1, sin(a * t)
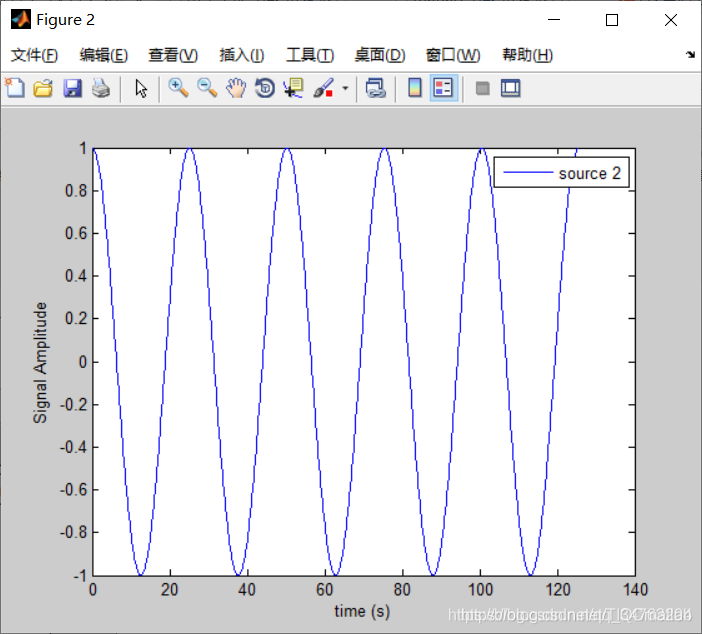
source2 = cos(0.25*timeVector); %Independent source component 2, cos(b * t)
S = [source1;source2]; %Source Matrix
figure
plot(timeVector,source1) %Plotting the N independent sources vs. time
xlabel('time (s)')
ylabel('Signal Amplitude')
legend('source 1')
figure
plot(timeVector,source2) %Plotting the N independent sources vs. time
xlabel('time (s)')
ylabel('Signal Amplitude')
legend('source 2')
Yobs = Amix*S; %Matrix consisting of M samples of N observed mixtures
figure
plot(timeVector,Yobs) %Plotting the observed signal vs. time
xlabel('time (s)')
ylabel('Signal Amplitude')
legend('observed signal')
%% --------------------------------- Call SSA-ICA algorithm
M = 200;
Sest = SSA_ICA(Yobs,Ns,M);
%% --------------------------------- Show results
figure
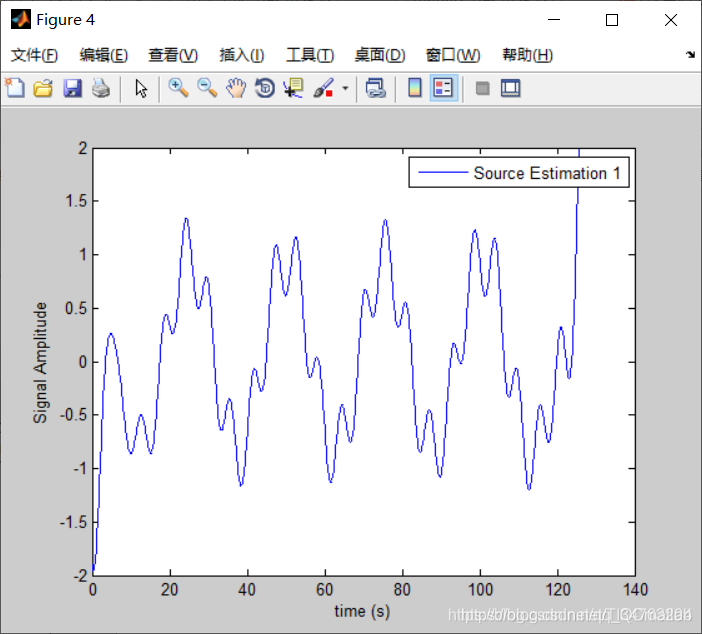
plot(timeVector, Sest(1,:))
xlabel('time (s)')
ylabel('Signal Amplitude')
legend('Source Estimation 1')
figure
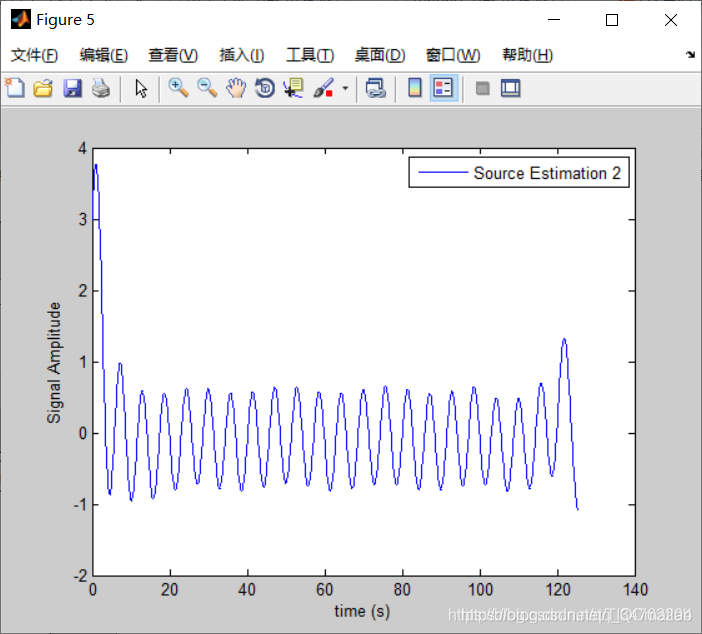
plot(timeVector, Sest(2,:))
xlabel('time (s)')
ylabel('Signal Amplitude')
legend('Source Estimation 2')
三、运行结果
四、备注
完整代码或者代写添加QQ2449341593
往期回顾>>>>>>
【信号处理】基于matlab HMM的睡眠状态检测【含Matlab源码 050期】
【信号处理】基于matlab CDR噪声和混响抑制【含Matlab源码 051期】
【信号处理】基于matlab最小二乘法解决稀疏信号恢复问题【含Matlab源码 052期】
【信号处理】基于matlab小波变换的音频水印嵌入提取【含Matlab源码 053期】