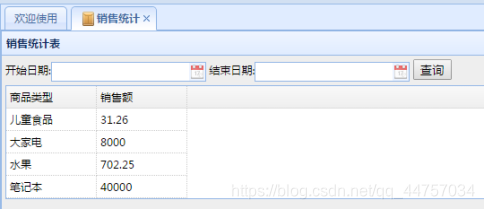
一、销售统计(报表)
1、需求以及实现思路
(1)需求
统计各类别的商品销售额,如下表
2、实现思路
技术:运用关联查询、聚合统计。
关键是SQL编写。
找出涉及的表有哪些?
报表数据存在哪个表里?
数据存在的表之间的中间表
查询条件所在的表
关联查询条件所在的表 和 数据所在的表之间 的中间表
销售额来源:订单明细表
商品类别: 商品类别表
关联用的表:商品表
条件类型为销售订单: 订单表
3、查询语句编写, 由简单到复杂
1)先将这4个表关联起来查询
关联查询,分组聚合
关键是编写SQL语句
(1)存在在哪些表当中(goodstype,orderdetail.money)
(2)中间表的关系(goods)
(3)找出条件所在的表(Orders.createtime)
(4)关联表如果没有,应该找其他的表进行关联:
库存表:goodstype,storeuuid,
中间表:goods
明细里:goodsuuid,money,storeuuid,
2)销售报表SQL编写
分三步来写
a、把所有相关的表,关联查询,查询goodstype表goods表orderdetail 表orders 表,其中商品类型goodstype的编号和商品goods的商品类型编号相同同时,底单详情的商品编号和商品的编号相同,订单编号和订单详情的订单编号相同
select * from goodstype gt,goods gs,orderdetail ol,orders o
where gt.uuid=gs.goodstypeuuid and ol.goodsuuid = gs.uuid and o.uuid = ol.ordersuuid
b、在上述SQL的基础上添加条件,并且订单类是出库的订单
select * from goodstype gt,goods gs,orderdetail ol,orders o
where
gt.uuid=gs.goodstypeuuid
and ol.goodsuuid = gs.uuid
and o.uuid = ol.ordersuuid
and o.type = '2'
c、进行分组统计
安装商品类型的名称分组,先商品类型的名称以及 对应的每个商品类型的订单总计价格
select gt.name,sum(ol.money)
from goodstype gt,goods gs,orderdetail ol,orders o
where
gt.uuid=gs.goodstypeuuid
and ol.goodsuuid = gs.uuid
and o.uuid = ol.ordersuuid
and o.type = '2'
group by gt.name
4、销售报表后端
(1)编写dao,在erp_dao下的com.itzheng.erp.dao当中创建接口IRepportDao ,以及对应的实现类ReportDao
package com.itzheng.erp.dao;
import java.util.List;
/*
 * 报表数据访问接口
 */
public interface IRepportDao {


	/*
	 * 销售统计报表
	 */
	List ordersReport();
}
package com.itzheng.erp.dao.impl;
import java.util.List;
import org.springframework.orm.hibernate5.support.HibernateDaoSupport;
import com.itzheng.erp.dao.IRepportDao;
public class ReportDao extends HibernateDaoSupport implements IRepportDao {


	@Override
	public List ordersReport() {


		String hql = "select gt.name,sum(ol.money) "
				+ " from goodstype gt,goods gs,orderdetail ol,orders o "
				+ "where gt.uuid=gs.goodstypeuuid "
				+ "and ol.goodsuuid = gs.uuid "
				+ "and o.uuid = ol.ordersuuid "
				+ "and o.type = '2' "
				+ "group by gt.name ";

		return getHibernateTemplate().find(hql);
	}
}
(2)在erp_biz当中的com.itzheng.erp.biz创建IReportBiz接口,以及ReportBiz实现类
package com.itzheng.erp.biz;
import java.util.List;
public interface IReportBiz {


	/*
	 * 销售统计报表
	 */
	List ordersReport();
}
package com.itzheng.erp.biz.impl;
import java.util.List;
import com.itzheng.erp.biz.IReportBiz;
import com.itzheng.erp.dao.IRepportDao;
public class ReportBiz implements IReportBiz {


	private IRepportDao reportDao;
	public void setReportDao(IRepportDao reportDao) {


		this.reportDao = reportDao;
	}
	/*
	 * 销售统计报表
	 */
	@Override
	public List ordersReport() {


		// TODO Auto-generated method stub
		return reportDao.ordersReport();
	}
}
(3)在erp_web当中的创建当中ReportAction
/*
 * 报表的Action
 */
public class ReportAction {


	private IReportBiz reportBiz;
	/*
	 * 销售统计报表
	 */
	public void setReportBiz(IReportBiz reportBiz) {


		this.reportBiz = reportBiz;
	}
	public void orderReport() {


		List list = reportBiz.ordersReport();
		write(JSON.toJSONString(list));
	}
	/**
	 * 输出字符串
	 *
	 * @param jsonString
	 */
	public void write(String jsonString) {


		HttpServletResponse response = ServletActionContext.getResponse();
		response.setCharacterEncoding("UTF-8");
		try {


			response.getWriter().print(jsonString);
		} catch (IOException e) {


			// TODO Auto-generated catch block
			e.printStackTrace();
		}
	}

}
(4)添加上诉所有的配置文件
a、resources/applicationContext_dao.xml当中
<!-- 销售报表 -->
	<bean id="reportDao" class="com.itzheng.erp.dao.impl.ReportDao">
		<property name="sessionFactory" ref="sessionFactory"></property>
	</bean>
b、resources/applicationContext_biz.xml
	<!-- 报表 -->
	<bean id="reportBiz" class="com.itzheng.erp.biz.impl.ReportBiz">
		<property name="reportDao" ref="reportDao"></property>
	</bean>
c、applicationContext_action.xml
<!--  报表  -->
	<bean id="reportAction" class="com.itzheng.erp.action.ReportAction" scope="prototype">
		<property name="reportBiz" ref="reportBiz"></property>
	</bean>
d、struts.xml
<!-- 报表 -->
		<action name="report_*" class="reportAction" method="{1}"></action>
(5)修改完以上的内依旧不能运行,将SQL转换为HQL
原生SQL与HQL的区别:
a、不能直接用表名、用类名、首字母大写
b、多的一方订单属性=1的一方的别名
 package com.itzheng.erp.dao.impl;

import java.util.List;

import org.springframework.orm.hibernate5.support.HibernateDaoSupport;

import com.itzheng.erp.dao.IRepportDao;

public class ReportDao extends HibernateDaoSupport implements IRepportDao {

	@Override
	public List ordersReport() {
		String hql = "select new Map(gt.name as name ,sum(ol.money) as y) "
				+ " from Goodstype gt,Goods gs,Orderdetail ol,Orders o "
				+ "where "
				+ "gs.goodstype=gt "
				+ "and ol.orders = o "
				+ "and ol.goodsuuid = gs.uuid "
				+ "and o.type = '2' "
				+ "group by gt.name ";

		return getHibernateTemplate().find(hql);
	}

}
访问测试

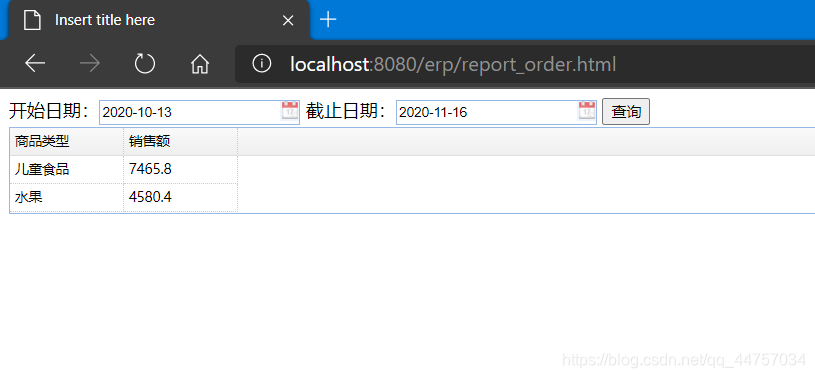
5、销售报表前端
(1)创建report_order.html
<!DOCTYPE html>
<html>
<head>
<meta charset="UTF-8">
<title>Insert title here</title>
<link rel="stylesheet" type="text/css"
	href="ui/themes/default/easyui.css">
<link rel="stylesheet" type="text/css" href="ui/themes/icon.css">
<script type="text/javascript" src="ui/jquery.min.js"></script>
<script type="text/javascript" src="ui/jquery.easyui.min.js"></script>
<script type="text/javascript" src="ui/locale/easyui-lang-zh_CN.js"></script>
<script type="text/javascript" src="ui/jquery.serializejson.min.js"></script>
<script type="text/javascript" src="ui/report.js"></script>
</head>
<body>
	<form id="searchForm" action="">
		开始日期:<input name="" class="easyui-datebox" />
		截止日期:<input name="" class="easyui-datebox" />
		<button type="button" id="btnSearch">查询</button>
	</form>
	<div style="height: 2px;" ></div>
	<table id="grid"></table>
</body>
</html>
(2)创建report.js
$(function() {


	// 表格数据初始化
	$('#grid').datagrid({


		url:'report_orderReport',
		columns : [[
			{

    field:'name',title:'商品类型',width:100},
			{

    field:'y',title:'销售额',width:100},
		]],
		singleSelect : true
	});
	// 条件查询
	$('#btnSearch').bind('click', function() {


		var formdata = $('#searchForm').serializeJSON();
		$('#grid').datagrid('load', formdata);
	});
});
6、销售报表_实现日期查询
(1)修改IRepportDao和ReportDao
package com.itzheng.erp.dao;
import java.util.Date;
import java.util.List;
/*
 * 报表数据访问接口
 */
public interface IRepportDao {


	/*
	 * 销售统计报表
	 */
	List ordersReport(Date startDate,Date endDate);
}
 package com.itzheng.erp.dao.impl;
import java.util.Date;
import java.util.List;
import org.springframework.orm.hibernate5.support.HibernateDaoSupport;
import com.itzheng.erp.dao.IRepportDao;
public class ReportDao extends HibernateDaoSupport implements IRepportDao {


	@Override
	public List ordersReport(Date startDate,Date endDate) {


		String hql = "select new Map(gt.name as name ,sum(ol.money) as y) "
				+ " from Goodstype gt,Goods gs,Orderdetail ol,Orders o "
				+ "where "
				+ "gs.goodstype=gt "
				+ "and ol.orders = o "
				+ "and ol.goodsuuid = gs.uuid "
				+ "and o.type = '2' "
				+ "group by gt.name ";
		return getHibernateTemplate().find(hql);
	}
}
(2)修改IReportBiz和ReportBiz
package com.itzheng.erp.biz;
import java.util.Date;
import java.util.List;
/*
 * 报表的业务接口
 */
public interface IReportBiz {


	/*
	 * 销售统计报表
	 */
	List ordersReport(Date startDate,Date endDate);
}

(3)修改ReportAction,添加startDate和endDate属性以及对应的set方法

package com.itzheng.erp.action;

import java.io.IOException;
import java.util.Date;
import java.util.List;

import javax.servlet.http.HttpServletResponse;

import org.apache.struts2.ServletActionContext;

import com.alibaba.fastjson.JSON;
import com.itzheng.erp.biz.IReportBiz;

/*
 * 报表的Action
 */
public class ReportAction {


	private IReportBiz reportBiz;

	private Date startDate;
	private Date endDate;

	public void setStartDate(Date startDate) {


		this.startDate = startDate;
	}
	public void setEndDate(Date endDate) {


		this.endDate = endDate;
	}
	/*
	 * 销售统计报表
	 */
	public void setReportBiz(IReportBiz reportBiz) {


		this.reportBiz = reportBiz;
	}
	public void orderReport() {


		List list = reportBiz.ordersReport(startDate,endDate);
		write(JSON.toJSONString(list));
	}
	/**
	 * 输出字符串
	 *
	 * @param jsonString
	 */
	public void write(String jsonString) {


		HttpServletResponse response = ServletActionContext.getResponse();
		response.setCharacterEncoding("UTF-8");
		try {


			response.getWriter().print(jsonString);
		} catch (IOException e) {


			// TODO Auto-generated catch block
			e.printStackTrace();
		}
	}

}
(4)修改report_order.html和report.js

$(function() {


	// 表格数据初始化
	$('#grid').datagrid({


		url:'report_orderReport',
		columns : [[
			{

    field:'name',title:'商品类型',width:100},
			{

    field:'y',title:'销售额',width:100},
		]],
		singleSelect : true
	});
	// 条件查询
	$('#btnSearch').bind('click', function() {


		var formdata = $('#searchForm').serializeJSON();
		if(formdata.endDate != ''){


			formdata+= "23:59:59"
		}

		$('#grid').datagrid('load', formdata);
	});
});
(5)修改ReportDao
 package com.itzheng.erp.dao.impl;
import java.util.ArrayList;
import java.util.Date;
import java.util.List;
import org.springframework.orm.hibernate5.support.HibernateDaoSupport;
import com.itzheng.erp.dao.IRepportDao;
public class ReportDao extends HibernateDaoSupport implements IRepportDao {


	@Override
	public List ordersReport(Date startDate,Date endDate) {


		String hql = "select new Map(gt.name as name ,sum(ol.money) as y) "
				+ " from Goodstype gt,Goods gs,Orderdetail ol,Orders o "
				+ "where "
				+ "gs.goodstype=gt "
				+ "and ol.orders = o "
				+ "and ol.goodsuuid = gs.uuid "
				+ "and o.type = '2' ";
		List<Date> dateList = new ArrayList<Date>();
		if(startDate != null) {


			hql +=  "and o.createtime >= ? ";
			dateList.add(startDate);
		}
		if(endDate != null) {


			hql += "and o.createtime <= ? ";
			dateList.add(endDate);
		}
		hql += "group by gt.name ";
		return getHibernateTemplate().find(hql,dateList.toArray(new Date[]{

    }));
	}
}
运行测试
7、销售报表_数组转换,修改ReportDao

二、销售统计(图表工具)
1、JFreeChart(Java)
JFreeChart是JAVA平台上的一个开放的图表绘制类库。它完全使用JAVA语言编写,是为applications, applets, servlets 以及JSP等使用所设计。JFreeChart可生成饼图(pie charts)、柱状图(bar charts)、散点图(scatter plots)、时序图(time series)、甘特图(Gantt charts)等等多种图表,并且可以产生PNG和JPEG格式的输出,还可以与PDF和EXCEL关联。
入门demo
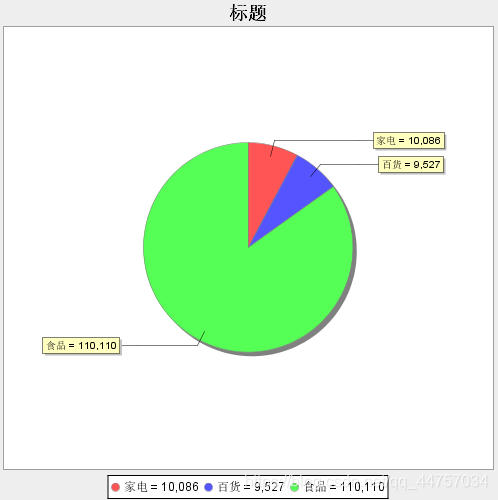
在 D 盘根目录生成饼图图片 chart.png
在 D 盘根目录生成饼图图片 chart.png
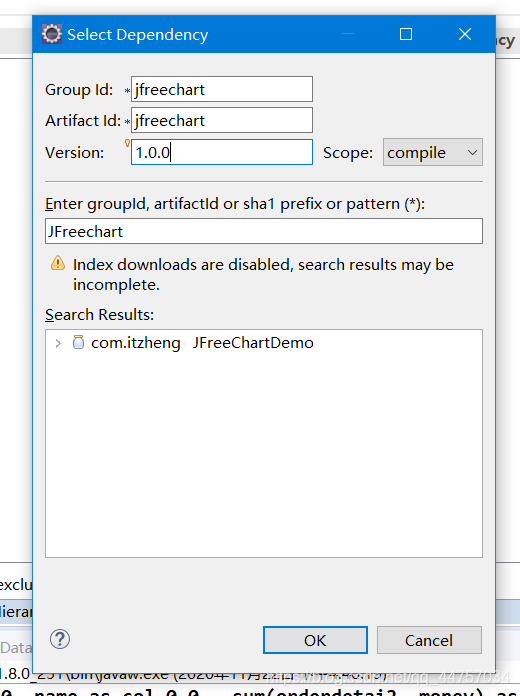
1)创建JfreeChartDemo工程,创建Maven progect

2)引入相关jar包

3)创建类

4)JFreeCharDemo当中创建main方法并创建DefaultPieDataset对象,向该对象当中设置对应的值
package com.itzheng.demo;
import java.io.File;
import java.io.IOException;
import org.jfree.chart.ChartFactory;
import org.jfree.chart.ChartUtilities;
import org.jfree.chart.JFreeChart;
import org.jfree.data.general.DefaultPieDataset;
public class JFreeCharDemo {


	public static void main(String[] args) throws IOException {


		DefaultPieDataset dataSet = new DefaultPieDataset();
		//设置数据集
		dataSet.setValue("家电", 10086);
		dataSet.setValue("百货", 9527);
		dataSet	.setValue("食品", 110110);
		//参数1:title = 图标的标题
		//参数2:PieDataset = 数据集(这里是dataSet)
		//参数3:true = 设置是否显示下标题(legend)
		//参数4:toopltip:鼠标移动过去的提示
		//参数5:url是否为超链接
		JFreeChart chart =  ChartFactory.createPieChart("标题",dataSet,true,false,false);
		//保存到本地目录下
		//参数1:文件名称,本地的目录
		//参数2:图标对象
		//参数3:图标的宽度
		//参数4:图标的高度
		ChartUtilities.saveChartAsPNG(new File("d:\\pie.png"), chart, 500, 500);

	}
}
运行上诉程序

成功创建图表
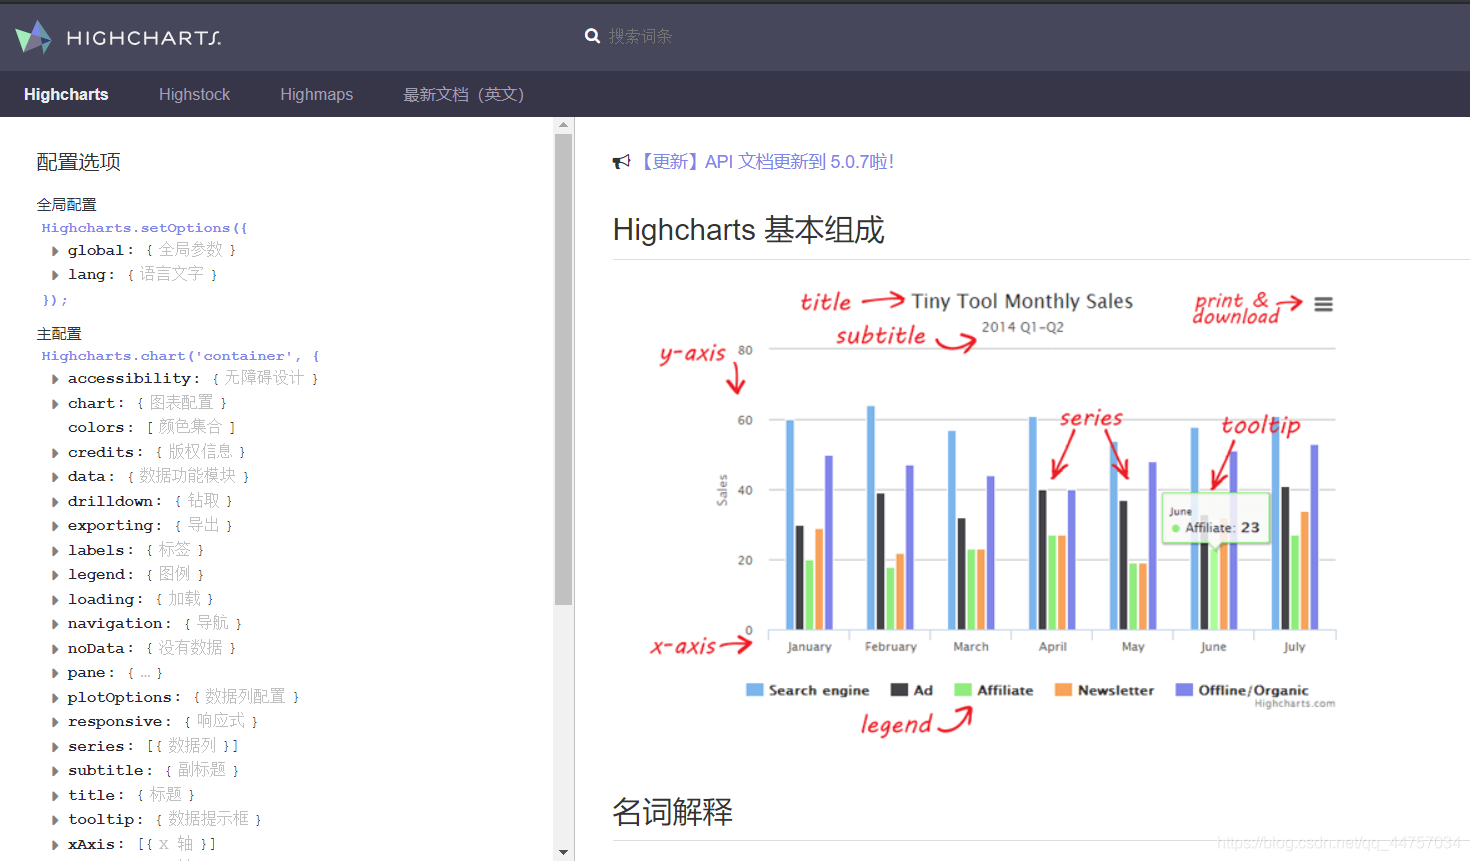
2、Highcharts (JavaScript)
Highcharts 是一个用纯JavaScript编写的一个图表库, 能够很简单便捷的在web网站或是web应用程序添加有交互性的图表,并且免费提供给个人学习、个人网站和非商业用途使用。
HighCharts支持的图表类型有曲线图、区域图、柱状图、饼状图、散状点图和综合图表。
HighCharts 界面美观,由于使用JavaScript编写,所以不需要像Flash和Java那样需要插件才可以运行,而且运行速度快。
另外HighCharts还有很好的兼容性,能够完美支持当前大多数浏览器
我们的ERP项目就采用HighCharts
(1)入门Demo,hightchart的实例
1)创建report_order.html,并引入report.js
<!DOCTYPE html>
<html>
<head>
<meta charset="UTF-8">
<title>Insert title here</title>
<link rel="stylesheet" type="text/css" href="ui/themes/default/easyui.css">
<link rel="stylesheet" type="text/css" href="ui/themes/icon.css">
<script type="text/javascript" src="ui/jquery.min.js"></script>
<script type="text/javascript" src="ui/jquery.easyui.min.js"></script>
<script type="text/javascript" src="ui/locale/easyui-lang-zh_CN.js"></script>
<script type="text/javascript" src="ui/jquery.serializejson.min.js"></script>
<script type="text/javascript" src="ui/highcharts.js"></script>
<script type="text/javascript" src="ui/exporting.js"></script>
<script type="text/javascript" src="js/report.js"></script>
</head>
<body class="easyui-layout">
<div data-options="region:'center',title:'销售统计表'" style="padding:4px;background-color:#eee; ">
<form id="searchForm">
	开始日期:<input name="startDate" class="easyui-datebox">
	截止日期:<input name="endDate" class="easyui-datebox">
	<button type="button" id="btnSearch">查询</button>
</form>
<div style="height:2px;"></div>
<table id="grid"></table>
</div>
<div data-options="region:'east',title:'销售统计图' ,split:true" style="width:600px;">
<div id="pieChart" style="min-width: 310px; height: 400px; max-width: 600px; margin: 0 auto"></div>
</div>
</body>
</html>
2)将highchars.js 拷贝到ui文件夹,并在页面 report_order.html 中引入highchars.js
3)将exporting.js 拷贝到ui文件夹,并在页面 report_order.html 中引入exporting.js
4)创建report.js
$(function() {


	// 表格数据初始化
	$('#grid').datagrid({


		url:'report_orderReport',
		columns : [[
			{

    field:'name',title:'商品类型',width:100},
			{

    field:'y',title:'销售额',width:100},
		]],
		singleSelect : true,
		onLoadSuccess:function(data){


			//alert(JSON.stringify(data));
			//显示图
			showChart(data.rows);
		}
	});
	//点击查询按钮
	$('#btnSearch').bind('click',function(){


		//把表单数据转换成json对象
		var formdata = $('#searchForm').serializeJSON();
		if(formdata.endDate != ''){


			formdata.endDate += " 23:59:59";
		}
		$('#grid').datagrid('load',formdata);
	});
});
//显示图
function showChart(_data){


	 // Build the chart
    $('#pieChart').highcharts({


        chart: {


            plotBackgroundColor: null,
            plotBorderWidth: null,
            plotShadow: false,
            type: 'pie'
        },
        title: {


            text: '销售统计'
        },
        tooltip: {


            pointFormat:'{series.name}: <b>{point.percentage:.1f}%</b>'
        },
        plotOptions:{


            pie:{


                allowPointSelect: true,
                cursor: 'pointer',
                dataLabels: {


                    enabled: true
                },
                showInLegend: true
            }
        },
        series: [{


            name: "比例",
            colorByPoint: true,
            data: _data
        }]
    });
}
6)运行测试

(2)hightchars配置介绍
API官网:https://api.highcharts.com.cn/
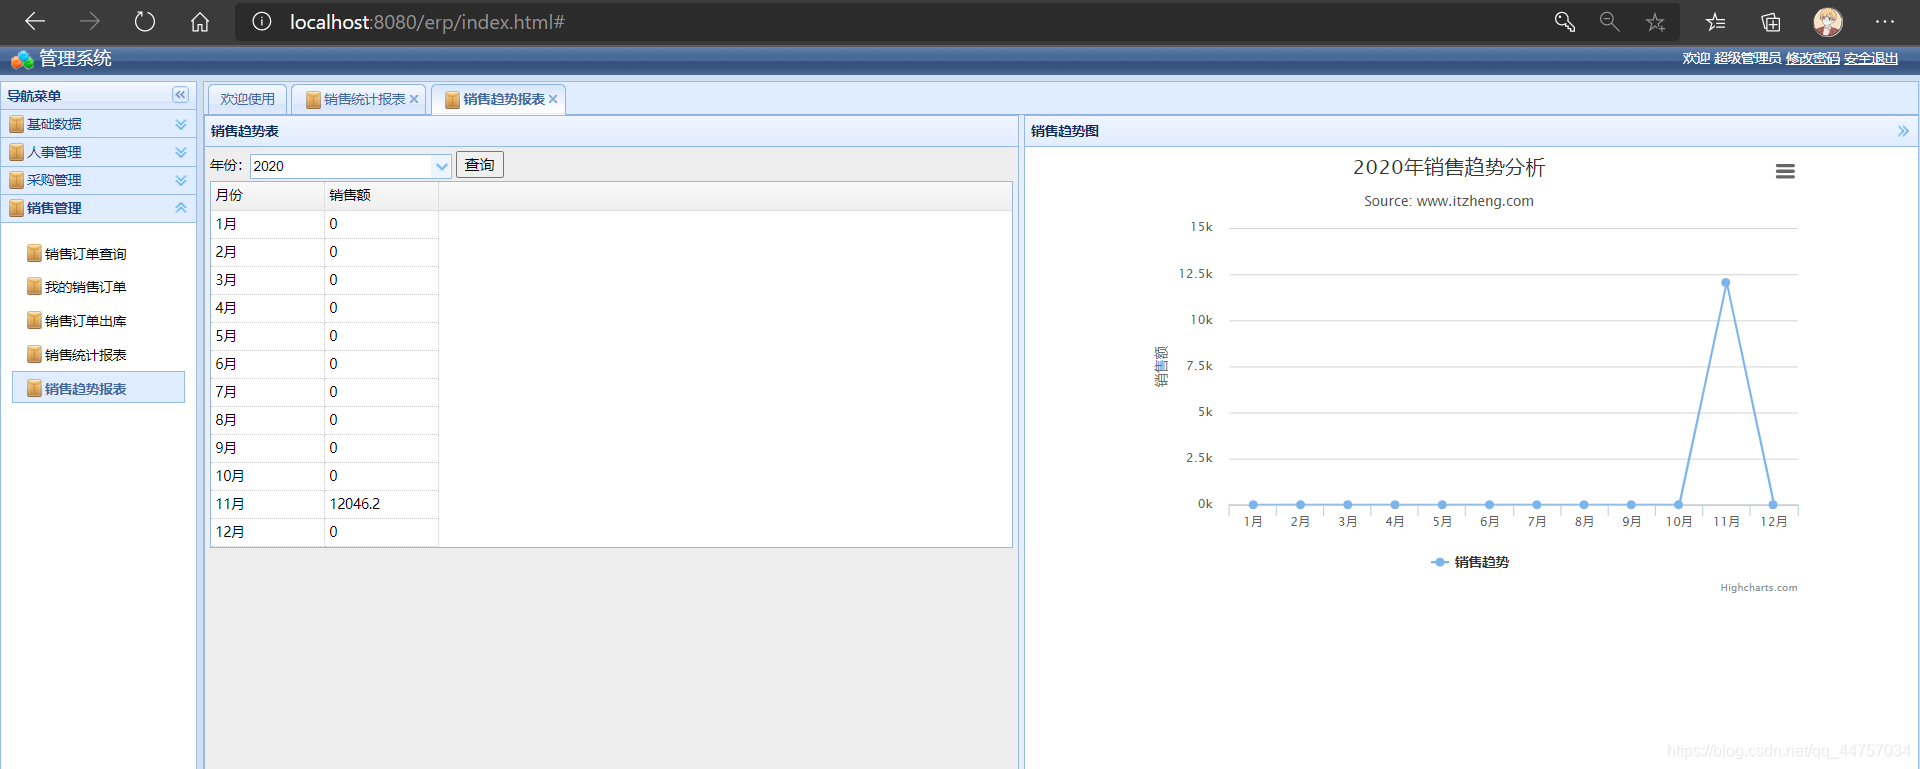
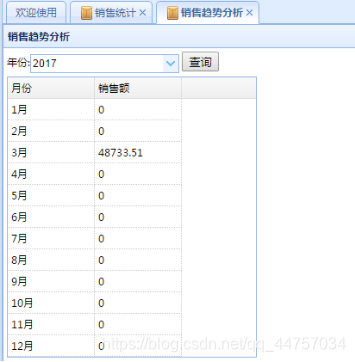
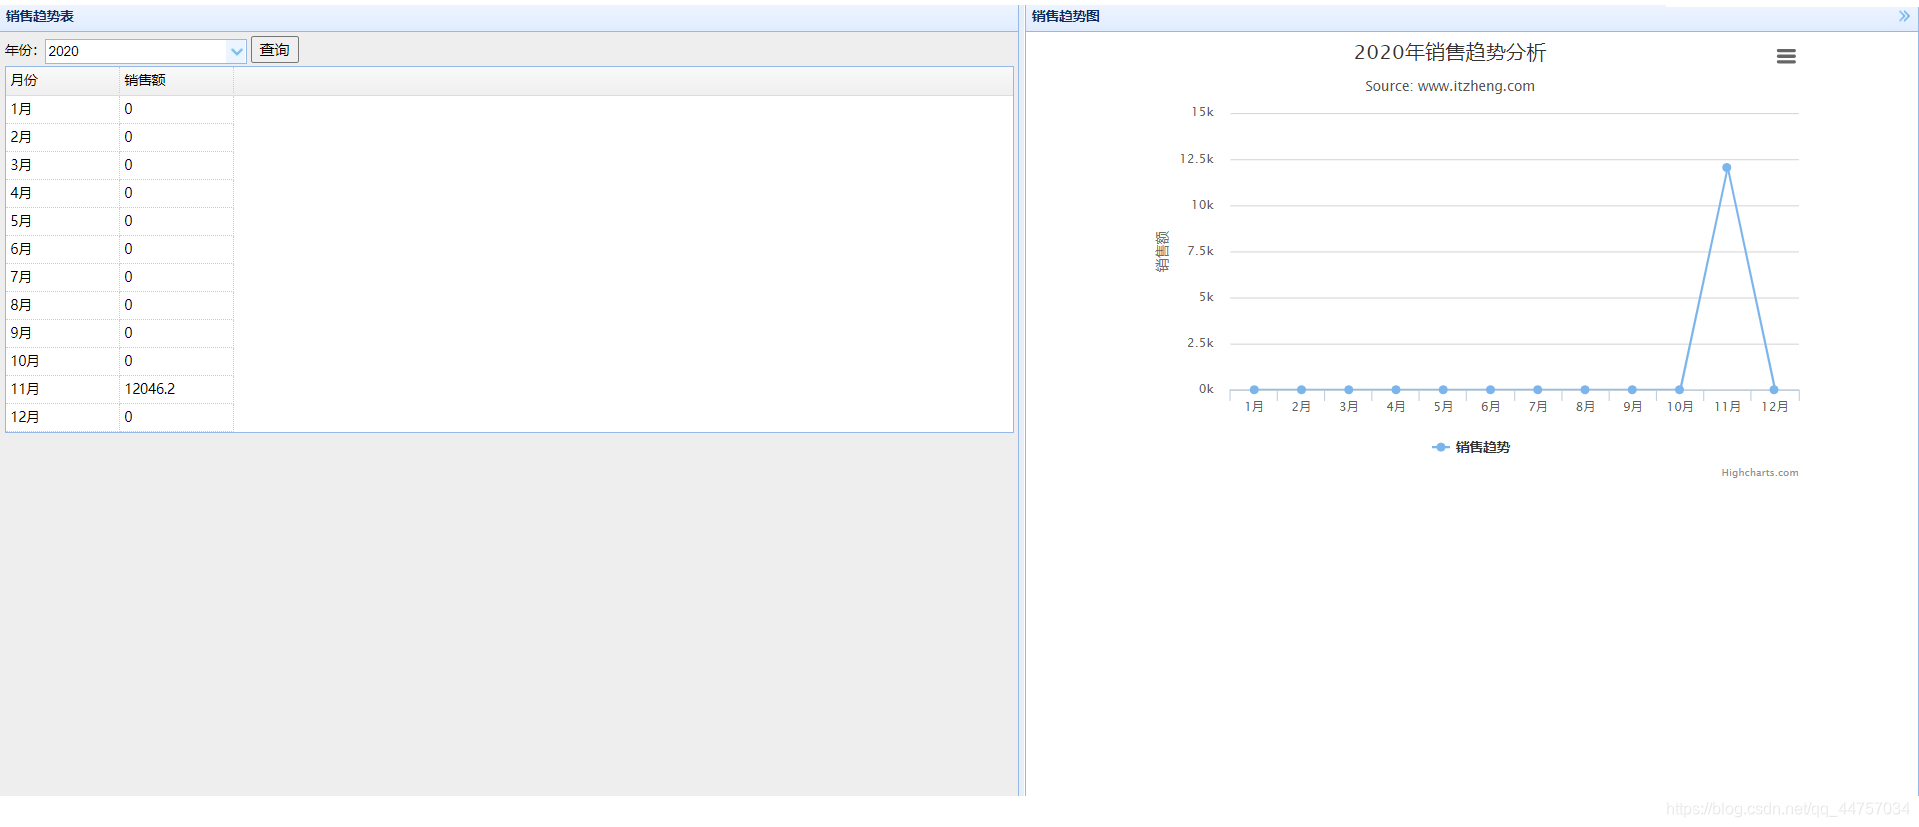
三、销售趋势分析
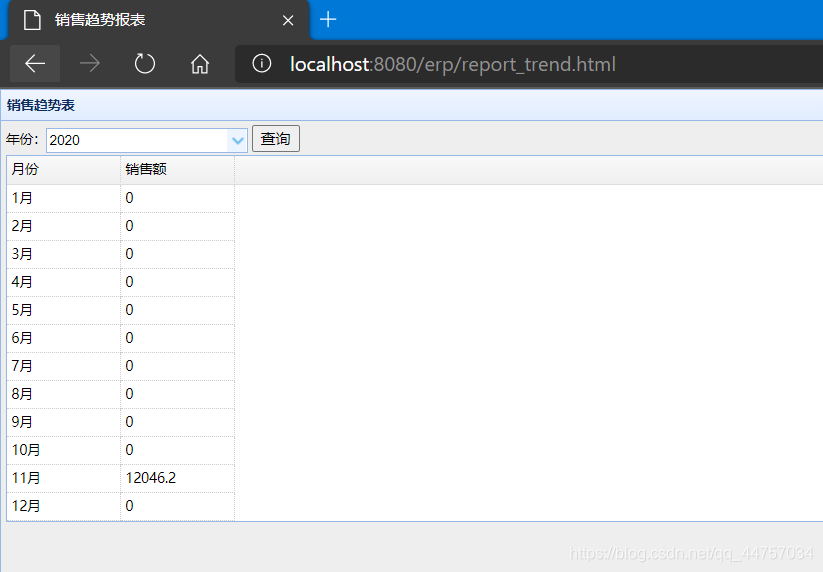
1、需求
选择年份点击查询,可以看到所选择年份的各个月份的销售额的统计数据
2、后端实现
(1)编写测试SQL语句
--销售趋势
select ol.*,o.createtime from orderdetail ol,orders o
where o.uuid = ol.ordersuuid
and o.type = '2';
(2)修改IRepportDao和ReportDao

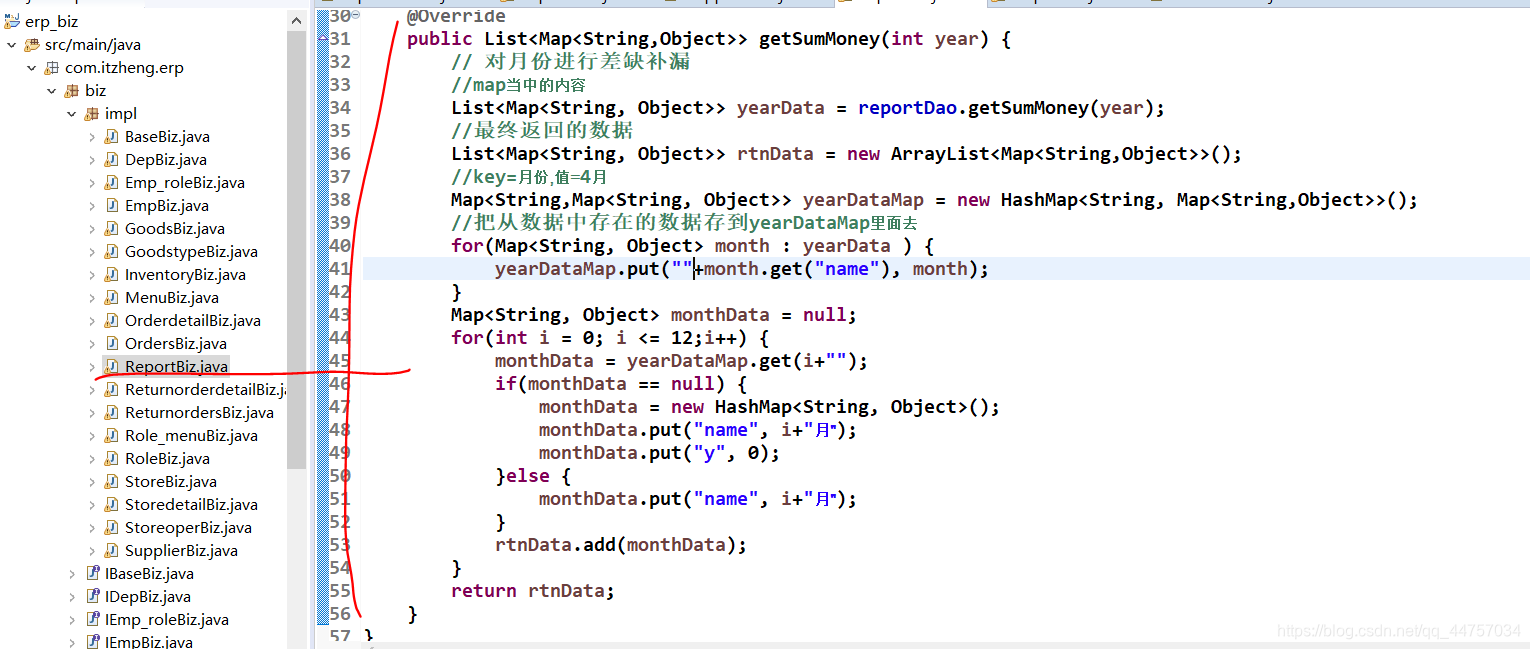
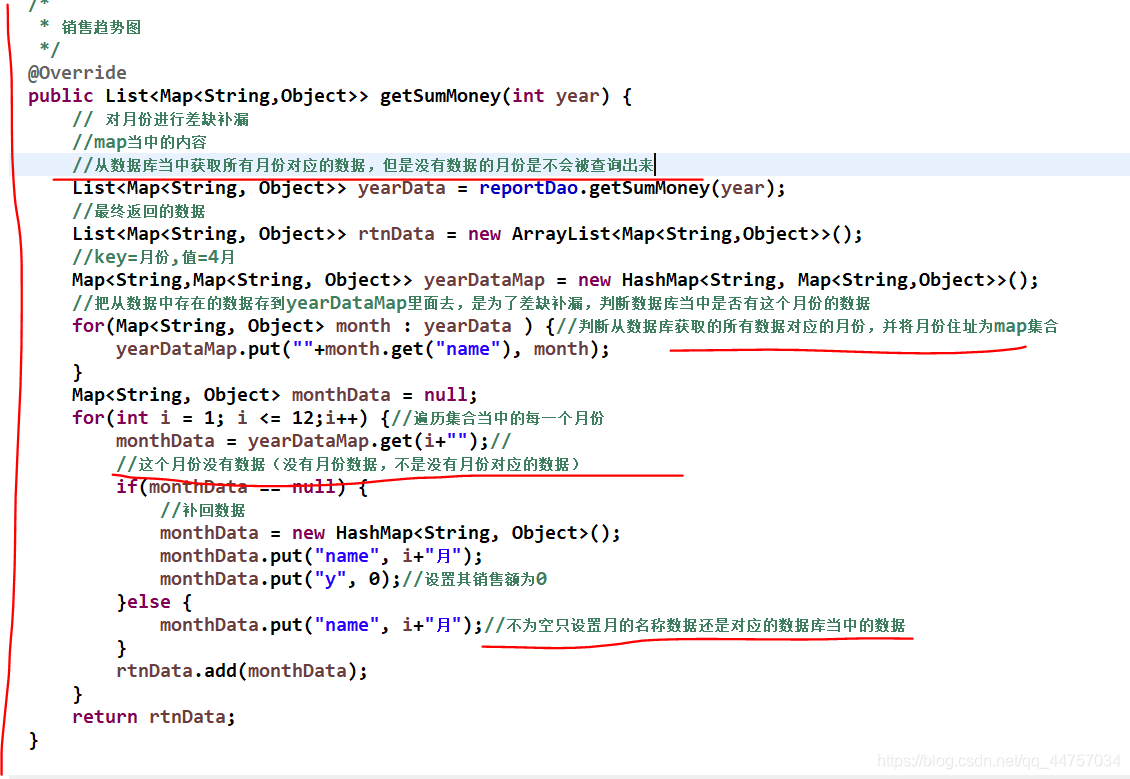
(3)修改IReportBiz和ReportBiz

在ReportBiz当中的getSumMoney方法当中进行差缺补漏
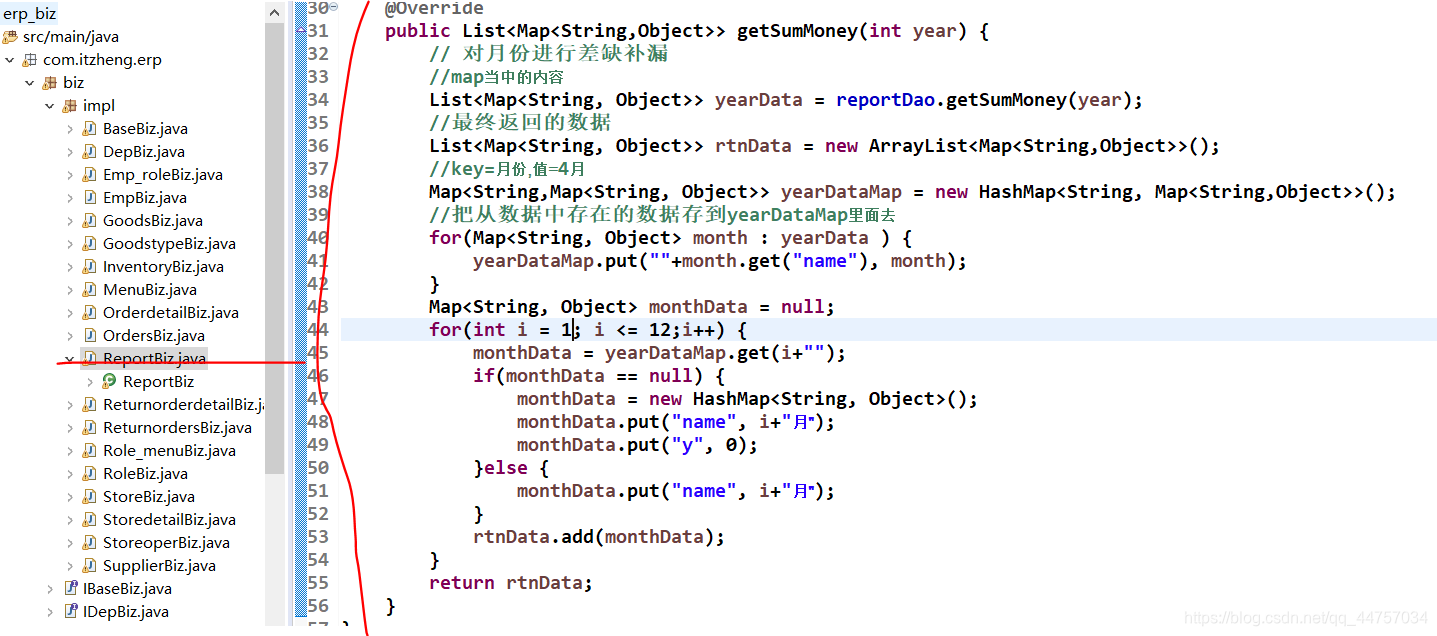
对应解析
(4) ReportAction

3、前端实现
(1)创建report_trend.html
<!DOCTYPE html>
<html>
<head>
<meta charset="UTF-8">
<title>销售趋势报表</title>
<link rel="stylesheet" type="text/css" href="ui/themes/default/easyui.css">
<link rel="stylesheet" type="text/css" href="ui/themes/icon.css">
<script type="text/javascript" src="ui/jquery.min.js"></script>
<script type="text/javascript" src="ui/jquery.easyui.min.js"></script>
<script type="text/javascript" src="ui/locale/easyui-lang-zh_CN.js"></script>
<script type="text/javascript" src="ui/jquery.serializejson.min.js"></script>
<script type="text/javascript" src="ui/highcharts.js"></script>
<script type="text/javascript" src="ui/exporting.js"></script>
<script type="text/javascript" src="js/report_trend.js"></script>
</head>
<body class="easyui-layout">
<div data-options="region:'center',title:'销售趋势表'" style="padding:4px;background-color:#eee; ">
<form id="searchForm">
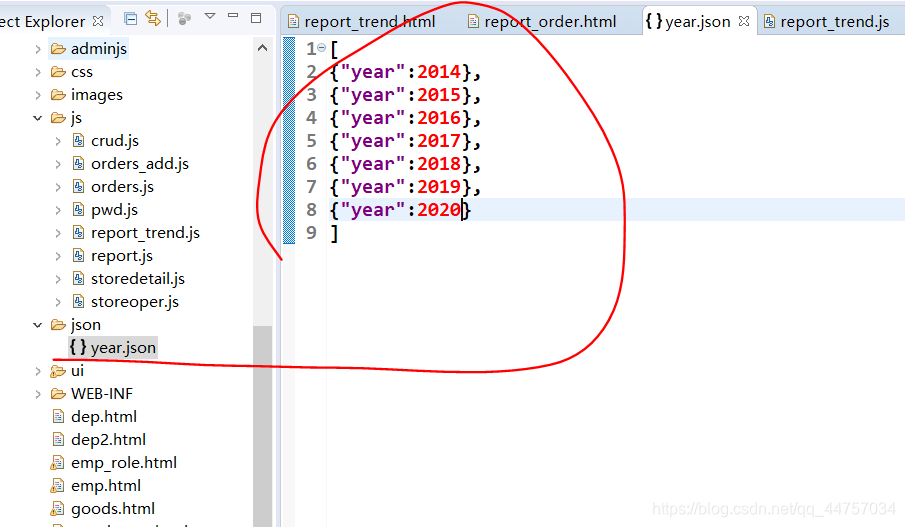
年份:<input name="year" id="year" class="easyui-combobox" data-options="
url:'json/year.json',valueField:'year',textField:'year'
">
<button type="button" id="btnSearch">查询</button>
</form>
<div style="height:2px;"></div>
<table id="grid"></table>
</div>
<div data-options="region:'east',title:'销售趋势图' ,split:true" style="width:800px;">
<div id="trendChart" style="min-width: 310px; height: 400px; max-width: 600px; margin: 0 auto"></div>
</div>
</body>
</html>
(2)创建json文件夹
(3)创建report_trend.js
$(function() {


	// 表格数据初始化
	$('#grid').datagrid({


		queryParams:{


		},
		columns : [[
			{

    field:'name',title:'月份',width:100},
			{

    field:'y',title:'销售额',width:100},
		]],
		singleSelect : true,
		onLoadSuccess:function(data){


			//alert(JSON.stringify(data));
			//显示图
			//showChart(data.rows);
		}
	});
	//点击查询按钮
	$('#btnSearch').bind('click',function(){


		//把表单数据转换成json对象
		var formdata = $('#searchForm').serializeJSON();
		$('#grid').datagrid('load',formdata);
		$('#grid').datagrid({


			url:'report_trendReport',
			queryParams:formdata
		});
	});
});
测试
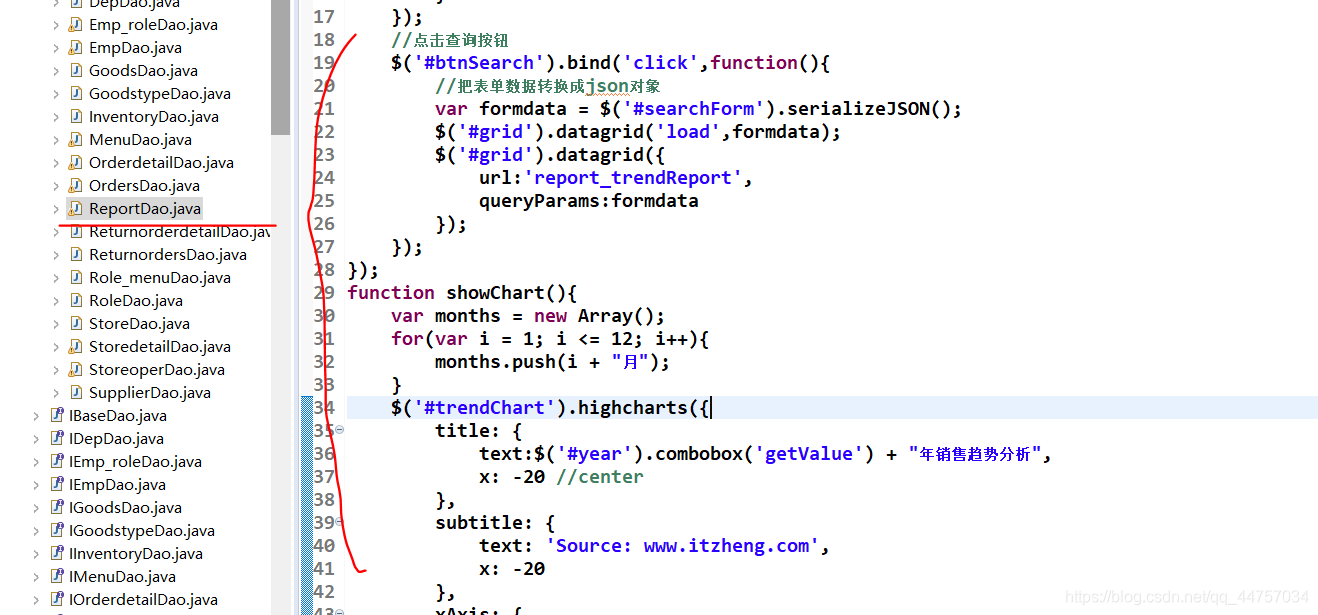
(4)添加趋势图(修改report_trend.js)
$(function() {


	// 表格数据初始化
	$('#grid').datagrid({


		queryParams:{


		},
		columns : [[
			{

    field:'name',title:'月份',width:100},
			{

    field:'y',title:'销售额',width:100},
		]],
		singleSelect : true,
		onLoadSuccess:function(data){


			//alert(JSON.stringify(data));
			//显示图
			//showChart(data.rows);
			showChart();
		}
	});
	//点击查询按钮
	$('#btnSearch').bind('click',function(){


		//把表单数据转换成json对象
		var formdata = $('#searchForm').serializeJSON();
		$('#grid').datagrid('load',formdata);
		$('#grid').datagrid({


			url:'report_trendReport',
			queryParams:formdata
		});
	});
});
function showChart(){


	var months = new Array();
	for(var i = 1; i <= 12; i++){


		months.push(i + "月");
	}
	$('#trendChart').highcharts({


        title: {


            text:$('#year').combobox('getValue') + "年销售趋势分析",
            x: -20 //center
        },
        subtitle: {


            text: 'Source: www.itzheng.com',
            x: -20
        },
        xAxis: {


            categories: months
        },
        yAxis: {


            title: {


                text: '销售额'
            },
            plotLines: [{


                value: 0,
                width: 1,
                color: '#808080'
            }]
        },
        tooltip: {


            valueSuffix: '元'
        },
        legend: {


            layout: 'vertical',
            align: 'center',
            verticalAlign: 'bottom',
            borderWidth: 0
        },
        series: [{


            name: '销售趋势',
            data: $('#grid').datagrid('getRows')
        }]
    });
}
测试
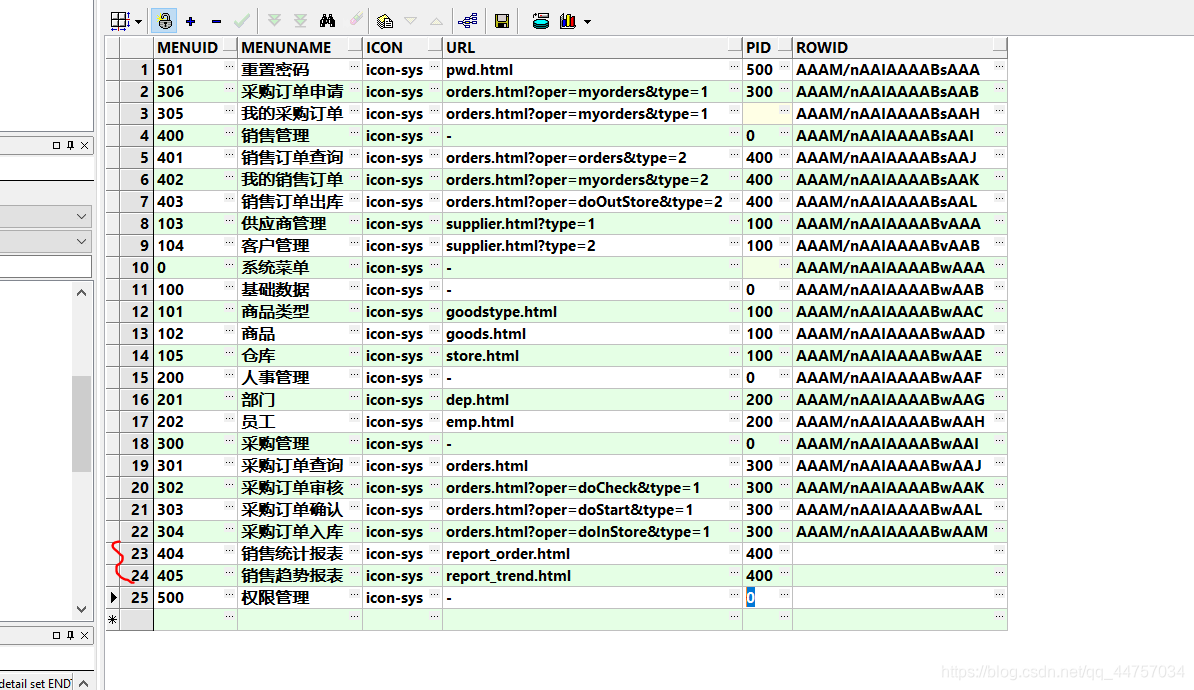
4、将销售趋势挂到菜单上,修改MENU表
5、测试