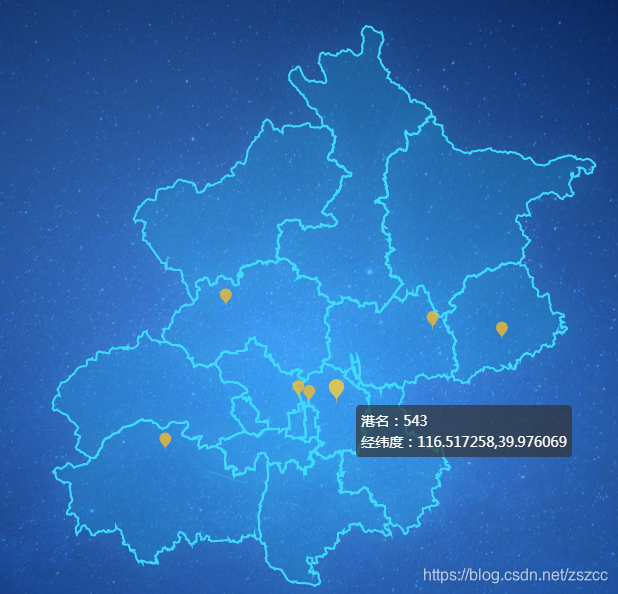
需求:需要展示北京地图并在地图加散点鼠标悬浮有提示文字
效果图:
代码
<template>
  <div class="harbormap">
    <div :style="{width:'800px',height:'700px'}" ref="myEchart"></div>
  </div>
</template>
<script>
import { findForMap } from "../../api";//此次引入的是自己封装的AXIOS请求
import "../../../node_modules/echarts/map/js/province/beijing.js"; // 引入北京地图数据
export default {
  name: "echarts",
  data() {
    return {
      chart: null,
      myData: ""
    };
  },
  mounted() {
    //此处是获取后台数据
    findForMap().then(data => {
      this.myData = data;
      console.log(this.myData);
      this.chinaConfigure();
    });
  },
  beforeDestroy() {
    if (!this.chart) {
      return;
    }
    this.chart.dispose();
    this.chart = null;
  },
  methods: {
    chinaConfigure() {
      let myChart = echarts.init(this.$refs.myEchart); //这里是为了获得容器所在位置
      window.onresize = myChart.resize;
      myChart.setOption({
        // 进行相关配置
        backgroundColor: "",
        color: "#f0bb31",
        tooltip: {
          formatter: function(params) {
            console.log(params);
            return (
              "港名:" + params.data.name + "</br>" + "经纬度:" + params.value
            );
          }
        },
        geo: {
          // 这个是重点配置区
          map: "北京", // 表示北京地图
          roam: false,
          label: {
            normal: {
              show: false, // 是否显示对应地名
              textStyle: {
                color: "rgba(0,0,0,0.4)"
              }
            }
          },
          itemStyle: {
            normal: {
              areaColor: "rgba(0,217,255,.1)",
              borderColor: "#3fdaff",
              borderWidth: 2,
              shadowColor: "rgba(63, 218, 255, 0.5)",
              shadowBlur: 30
            },
            emphasis: {
              areaColor: "#2B91B7",
              shadowOffsetX: 0,
              shadowOffsetY: 0,
              shadowBlur: 20,
              borderWidth: 0,
              shadowColor: "rgba(0, 0, 0, 0.5)"
            }
          }
        },
        series: [
          {
            name: "位置", //series名称
            type: "scatter", //为散点类型
            coordinateSystem: "geo", // series坐标系类型
            data: this.myData,
            symbol: "pin",
            symbolSize: [20, 20],
            itemStyle: {
              normal: {
                color: "#f0bb31"
              }
            }
          }
        ]
      });
    }
  }
};
</script>
由于本人之前从未接触过Echarts所以写下此篇,如有不足之处,欢迎各位大佬们指出!